Two IPv4 addresses — 3.33.130.190 and 15.197.148.33 — answer for 23.9 million websites. In our September 2026 crawl that is one registrable domain in every twelve that has a website record at all — more websites than the corpus holds under Germany's .de and the United Kingdom's .uk combined. Both addresses belong to Amazon's Global Accelerator anycast ranges; both are rented by GoDaddy; and what they serve, overwhelmingly, is a parked page.
That is the most extreme answer to a question that sounds simpler than it is: how many computers host the web? The folk model is one site, one server. The measurement literature has known since at least Shue, Kalafut and Gupta's 2007 study that the web is far smaller than its name count — 71.9 million .com and .net web-server A records on 3.6 million addresses in 2007 — and Cloudflare showed in 2022 that fewer than ten addresses reach a fifth of the names in the big gTLD zones. Netcraft, which counts machines rather than addresses, puts the number of web-facing computers at 14.77 million in July 2026.
What nobody publishes is the trend. Is the physical substrate of the web consolidating — fewer front doors carrying more sites — and if so, is it because existing websites are moving onto shared infrastructure, or because the new web arrives that way? It matters beyond curiosity. Since February 2025 a Barcelona court order has let LaLiga have Spanish ISPs block IP addresses during football matches — Cloudflare's, Vercel's and Squarespace's among them — and OONI measured roughly 554,500 domains caught in the blast in the first half of 2026 alone; a single blocked Squarespace address carried 18,592 of them. Encrypted Client Hello, which the IETF standardised as RFC 9849 in March, hides which site you visit only among the sites that share its address. The crowd on an address is the unit in which both censorship damage and privacy are denominated.
We counted it. For each of 29 full A-record crawls of the DomainsProject corpus, April 2023 to September 2026, we took the website record of every registrable domain — its bare-apex A record, else its www — and counted the distinct IPv4 addresses behind them, how many websites each address serves, and how that distribution moved. DNS cannot see machines, only the addresses they answer on, so this post counts front doors and uses Netcraft's machine count as the cross-check. It is the physical-layer companion to our Internet Concentration Index, which measured who owns the web's layers; this measures how many doors it has.
The headline: the web grew 71% while the addresses it answers from grew 16% — 169.3 million websites on 10.9 million addresses in April 2023, 289.7 million on 12.7 million in September 2026 — and the top of the distribution collapsed: half of all websites now answer from just 1,025 addresses, down from 3,908, and the median website answers from an address that serves 18,124 websites, up from 2,407. But that collapse is the parking layer. Take out the parked and for-sale front doors and the live web still needs about 17,700 addresses to reach half its sites, much as it did in 2023. What is consolidating in the live (non-parked) web is the middle and the bottom: its dedicated-address share fell by a quarter (4.66% → 3.47%), the median live website's address serves twice as many sites (669 → 1,350), and half the live web sits inside 11 networks instead of 20.
The Data
| April 2023 | September 2026 | |
|---|---|---|
| Crawls in the series | 29 full A-record passes | April 7, 2023 → September 18, 2026 |
| Merged apex rows read | 176,499,563 | 319,381,117 |
Registry-wildcard TLD rows removed (ph, ws, tk, ml, ga, cf, gq) |
7,129,855 | 14,614,886 |
| Private-suffix pseudo-apexes removed (EC2 hostnames et al.) | 1,621 | 14,179,411 |
| DNS-filter sinkhole answers removed | 24,576 | 851,145 |
| Websites analysed | 169,343,511 | 289,735,675 |
| Distinct IPv4 addresses behind them | 10,932,231 | 12,689,520 |
| Distinct /24 blocks | 1,318,579 | 1,704,043 |
| Distinct networks (mapped ASNs) | 43,804 | 49,125 |
| Websites per address | 15.5 | 22.8 |
| Websites that are parked (#98 tier) | 16.64% | 25.16% |
A website here is a registrable apex domain with a website record in that crawl; its addresses are the public IPv4 addresses in that record (up to 24, deduplicated). The universe is the one used by Where the Web Moves and The Parking Lot, so every figure below lines up with those posts' classifications. The corpus grew 1.7× over the window, much of it in a single December 2024 expansion of the crawler's known-name list, so this post reports shares and concentration statistics, and controls composition explicitly with a fixed panel.
Methodology
Definitions.
- Website / website record. A registrable domain under the ICANN section of the Public Suffix List whose bare-apex A record resolved, else whose
wwwA record did. Private-use, loopback, CGNAT and multicast answers are dropped. - Address. A distinct public IPv4 address in any website record of that crawl. An address is not a computer: an anycast address such as Cloudflare's is announced from 335+ cities and answered by thousands of machines, and one machine can hold many addresses. What DNS can count is front doors. We return to the computer question below.
- Incidence (tenants). The number of websites whose record contains a given address, the website itself included. "An address serving 18,124 websites" means 18,124 registrable domains list it.
- Fractional weight. A website with k addresses contributes 1/k to each. Weights sum to the number of websites, so shares add to 100%. The Gini coefficient, HHI and "top-k share" statistics use fractional weight, ranked by weight.
- Union coverage. The share of websites with at least one address among the k addresses of highest incidence — the "how many addresses do you need to reach X% of the web" statistic, and the one that corresponds to IP blocking. The two statistics rank addresses differently (by weight, by incidence), so their top-100 sets differ — incidence favours round-robin sets such as Squarespace's four addresses, weight favours single-address platforms — but they land within half a point of each other: in September 2026 the 100 heaviest addresses carry 38.47% of fractional weight and the 100 most-listed addresses reach 38.12% of websites.
- Dedicated website. Every address in its record serves no other website in the crawl. Tenancy classes (1, 2–9, 10–99 … 1 million or more) classify a website by the busiest address it uses.
- Gini. Computed over addresses, over /24 blocks, and over networks. /24 → network mapping is the empirical majority-vote map used since #95 (5.16 million prefixes); a /24 with no mapping counts as its own network (1.8–2.0% of websites).
- Parked / live. A website is parked in a crawl if the Parking Lot classifier — majority vote over its first six addresses against the 18-operator front-door registry — places it in the parking tier; every other website is live. "Live" is not "has content": registrar default pages and builder-platform "coming soon" pages remain in it.
- Categories of crowded addresses. Each of the top 1,000 addresses in every crawl carries an operator label and one of six categories: parked / for sale, registrar & host placeholder, site builder & app platform, CDN / proxy shared address, hosting, unidentified.
How the crowded addresses were identified. Labels come first from the verified front-door registry published with #95 and #98, then from a new audit of every address that reached the top 250 in any crawl without a label. For each we reservoir-sampled 25 of its tenants and fingerprinted them live — their current nameservers, whether they still resolve to the address, the HTTP page title and redirect target — and ran a page-marker probe for platform signatures; addresses that dropped out of the corpus were traced by looking up the same sampled tenants in later crawls. That is how, for example, 198.202.211.1 resolves to Webflow (24 of 24 sampled pages carry Webflow markup), 162.159.128.70 to Jimdo (every tenant delegated to jimdo.com), 34.111.179.208 to Replit and 172.237.129.x to ParkLogic's parking fleet. 409 addresses were labelled this way. Where the evidence does not identify an operator, the address stays unidentified — including a twelve-address Linode fleet that served about 586,000 websites in April 2023 and whose tenants, where they still exist at all, now sit with half a dozen expiry and aftermarket registrars.
Three corpus artifacts are removed, and two of them are large.
- Registry wildcards.
.phanswers for any label, so its "domains" are unbounded: 14.35 million apex rows in September 2026, overwhelmingly on one Linode address. Left in,45.79.222.138would be the single most crowded address on the web by a wide margin..wsdoes the same at smaller scale, and Freenom's free TLDs are excluded as in How Long the Internet Remembers. Whole TLDs are dropped in every crawl. - Private-suffix pseudo-apexes. The Public Suffix List's private section contains wildcard rules such as
*.compute-1.amazonaws.com, under which every EC2 public hostname counts as its own "registrable name". Until November 2024 the corpus held about 1,100–1,600 such names per crawl. When the crawler's name list expanded in December 2024, 13,973,962 EC2 hostnames entered it in a single pass — about 14.8 million a month after that, 14.18 million in September 2026 — each resolving to exactly one dedicated EC2 address. Counted as websites, they make "unique addresses" jump from 9.6 million to 24.7 million in one month and nearly triple the dedicated-address share; we found them because that jump looked too good to be real. The same names sat inside the denominators of four earlier posts built on the same extraction, and each now carries a correction: The Half-Life of a Domain, Where the Web Moves, The Parking Lot and How Long the Internet Remembers, where they had reversed the direction of the long-TTL trend. They are removed: a name survives only if it equals its ICANN-only registrable domain. - DNS-filter sinkholes. A share of the crawl's queries pass through filtering resolvers that return a Fortinet block page (
208.91.112.55) for listed domains: 24,576 websites in April 2023, 851,145 in September 2026. That is resolver-mix drift, not hosting, and those websites are dropped.
Known limitations. (1) IPv4 only. This post measures A records; The IPv6 Mirage found 64.2 million apexes publishing AAAA, 44.7% of them on Cloudflare. (2) One vantage point per query. Geo-DNS services answer differently by resolver location, and Cloudflare's 2022 study used five regions. The addresses that drive this post's trend — GoDaddy's, Squarespace's, Wix's, Cloudflare's shared pools — are anycast or fixed platform addresses that answer the same everywhere, so resolver drift cannot manufacture them, but it can move counts for CloudFront- or Akamai-style services by a few percent. (3) Apex-level only. Subdomain-hosted services (a SaaS tenant on customer.vendor.com) are outside the unit. (4) Known-names corpus. A website absent from a crawl may be dead, failing, or unqueried; incidence counts are lower bounds on an address's true tenancy. (5) The December 2024 coverage step added 32.1 million websites in one month (161.0M → 193.1M after the filters above); every trend below is also shown on a fixed panel that the step cannot touch. (6) Hosting-country cuts use geoIP, which blanks on anycast: the un-geolocated share grew from 0.5% to 13.0% of websites, so country figures are used for level comparisons, never trends.
Dataset versus external counts. Our 10.9–12.7 million addresses sit below Netcraft's 12.1–14.8 million "web-facing computers" over the same window, as they should: Netcraft counts every responding web server (not only registrable-domain websites) and collapses addresses into machines using TCP/IP fingerprints, so the two are different units that happen to share an order of magnitude — and a direction (Netcraft +22%, us +16%). Cloudflare's December 2022 measurement of 255 million names needed about 16 million addresses (IPv4 and IPv6, five regions) and found 100 addresses reaching about half of them; we find 100 addresses reaching 38.1% of all websites and 45.4% of .com in September 2026. The difference is the unit: Cloudflare counted every name in the .com, .net, .info and .org zone files — the namespaces where parking is densest — reachable from any of five vantage points; we count one website record per registrable domain across all TLDs. Hoang et al. found 18.7% of popular domains single-hosted in 2019; our 2.6% is the long tail, where almost nothing is.
Reproducibility. A single-pass Go scanner reads each crawl's merged website-record table — the same tables behind #95 and #98, extended by three new crawls (July, August and September 2026) through the identical extractor and classifier. It reproduces #98's April 2023 row count exactly (176,499,563) and its 500 audited first-address counts with zero mismatches before any filter is applied, and ships with a unit-test suite. Per-chart CSVs are linked under each chart; the full per-crawl series is in ipdensity-series.csv.
The Scorecard
| April 2023 | September 2026 | Change | |
|---|---|---|---|
| Websites | 169.3M | 289.7M | +71.1% |
| Distinct addresses | 10.93M | 12.69M | +16.1% |
| Websites per address | 15.5 | 22.8 | ×1.47 |
| Median website's address serves… | 2,407 websites | 18,124 websites | ×7.5 |
| Addresses reaching 25% of websites | 51 | 18 | |
| Addresses reaching 50% of websites | 3,908 | 1,025 | ÷3.8 |
| Addresses reaching 90% of websites | 858,105 | 496,290 | |
| Websites reachable via the top 1 / 10 / 100 addresses | 5.3% / 14.0% / 29.0% | 8.3% / 18.4% / 38.1% | |
| Websites reachable via the top 1,000 / 10,000 | 43.4% / 55.2% | 49.9% / 60.6% | |
| Dedicated-address websites | 3.89% | 2.59% | −33% |
| Websites on an address shared by 1 million+ | 21.0% (23 addresses) | 31.4% (34 addresses) | |
| Gini — addresses / blocks / networks | 0.915 / 0.965 / 0.994 | 0.940 / 0.978 / 0.997 |
Almost a third of all websites now answer from one of just 34 addresses, each shared with at least a million others. In April 2023 it was a fifth, on 23. At the other end, 7.9 million addresses — 62% of all the addresses the web uses — serve exactly one website each, and between them they carry 2.6% of websites. The web's address distribution is not a pyramid; it is a handful of tower blocks and a vast suburb of detached houses with almost nobody in them.
The hierarchy of consolidation
| To reach half of all websites you need… | April 2023 | September 2026 |
|---|---|---|
| Addresses | 3,908 | 1,025 |
| /24 blocks | 438 | 153 |
| Networks (ASNs) | 14 | 6 |
| Companies (from the Concentration Index, cloud layer) | — | a handful |
Each step up the hierarchy is more concentrated, and every step tightened. The single largest network by fractional share is Amazon's AS16509 in both years, and it went from 11.2% of all websites to 24.2%. Most of that is not Amazon customers' websites: GoDaddy's parking, for-sale and default front doors — 26 addresses on Amazon's Global Accelerator anycast ranges — carry 19.4% of the whole web on their own. This is the physical substrate under the ownership picture in the Concentration Index, whose cloud layer counted Amazon at 15.9% of resolving apexes by address range: by address, the largest tenant of the largest network is a registrar's inventory.
The series
| Crawl | Websites | Addresses | Websites per address | Addresses reaching half the web | …half the live web | Top-100 reach | Dedicated | Gini |
|---|---|---|---|---|---|---|---|---|
| 2023-04-07 | 169,343,511 | 10,932,231 | 15.5 | 3,908 | 16,553 | 29.00% | 3.89% | 0.915 |
| 2023-10-10 | 186,572,991 | 11,171,590 | 16.7 | 3,274 | 18,580 | 30.23% | 3.54% | 0.920 |
| 2023-12-27 | 192,822,206 | 11,178,958 | 17.2 | 2,033 | 17,258 | 32.16% | 3.41% | 0.922 |
| 2024-02-14 | 187,477,978 | 10,939,787 | 17.1 | 1,983 | 17,338 | 32.29% | 3.43% | 0.922 |
| 2024-07-30 | 169,962,297 | 9,995,310 | 17.0 | 1,618 | 16,479 | 32.80% | 3.49% | 0.921 |
| 2024-09-02 | 167,833,462 | 9,882,925 | 17.0 | 1,572 | 16,261 | 33.24% | 3.49% | 0.921 |
| 2024-11-13 | 160,997,573 | 9,615,990 | 16.7 | 1,538 | 16,073 | 33.44% | 3.53% | 0.920 |
| 2024-12-21 | 193,087,965 | 10,916,057 | 17.7 | 989 | 13,465 | 35.27% | 3.18% | 0.922 |
| 2025-01-24 | 228,873,812 | 11,784,178 | 19.4 | 792 | 12,097 | 36.94% | 2.90% | 0.928 |
| 2025-02-27 | 238,375,221 | 11,950,447 | 19.9 | 783 | 12,182 | 36.90% | 2.83% | 0.930 |
| 2025-03-24 | 242,542,791 | 12,001,548 | 20.2 | 804 | 12,218 | 37.28% | 2.80% | 0.931 |
| 2025-04-29 | 249,817,283 | 12,132,846 | 20.6 | 794 | 12,241 | 37.33% | 2.75% | 0.932 |
| 2025-05-25 | 255,277,011 | 12,254,056 | 20.8 | 764 | 12,275 | 38.58% | 2.72% | 0.933 |
| 2025-06-24 | 258,780,330 | 12,336,140 | 21.0 | 731 | 12,276 | 39.16% | 2.70% | 0.933 |
| 2025-07-24 | 259,305,056 | 12,360,006 | 21.0 | 746 | 12,275 | 39.13% | 2.69% | 0.933 |
| 2025-08-25 | 261,536,511 | 12,360,409 | 21.2 | 709 | 11,739 | 38.86% | 2.68% | 0.934 |
| 2025-09-23 | 263,779,998 | 12,348,917 | 21.4 | 957 | 18,107 | 36.98% | 2.67% | 0.934 |
| 2025-10-24 | 266,460,509 | 12,349,104 | 21.6 | 917 | 18,002 | 37.54% | 2.64% | 0.935 |
| 2025-11-30 | 268,332,756 | 12,305,981 | 21.8 | 892 | 19,314 | 37.92% | 2.63% | 0.936 |
| 2025-12-15 | 269,539,930 | 12,295,367 | 21.9 | 890 | 20,048 | 37.99% | 2.62% | 0.936 |
| 2026-01-08 | 270,148,957 | 12,254,594 | 22.0 | 866 | 19,742 | 38.28% | 2.62% | 0.936 |
| 2026-02-05 | 271,716,355 | 12,247,654 | 22.2 | 924 | 20,266 | 38.22% | 2.61% | 0.937 |
| 2026-03-05 | 273,772,844 | 12,286,296 | 22.3 | 894 | 19,360 | 38.35% | 2.60% | 0.937 |
| 2026-04-17 | 276,388,107 | 12,308,963 | 22.5 | 885 | 19,591 | 38.19% | 2.61% | 0.938 |
| 2026-05-15 | 275,879,356 | 12,296,641 | 22.4 | 951 | 20,693 | 37.87% | 2.61% | 0.938 |
| 2026-06-13 | 280,914,040 | 12,496,678 | 22.5 | 1,022 | 21,622 | 37.66% | 2.61% | 0.938 |
| 2026-07-08 | 284,906,538 | 12,604,846 | 22.6 | 1,039 | 19,852 | 37.73% | 2.60% | 0.939 |
| 2026-08-15 | 288,599,355 | 12,661,057 | 22.8 | 1,061 | 19,378 | 37.94% | 2.58% | 0.939 |
| 2026-09-18 | 289,735,675 | 12,689,520 | 22.8 | 1,025 | 17,709 | 38.12% | 2.59% | 0.940 |
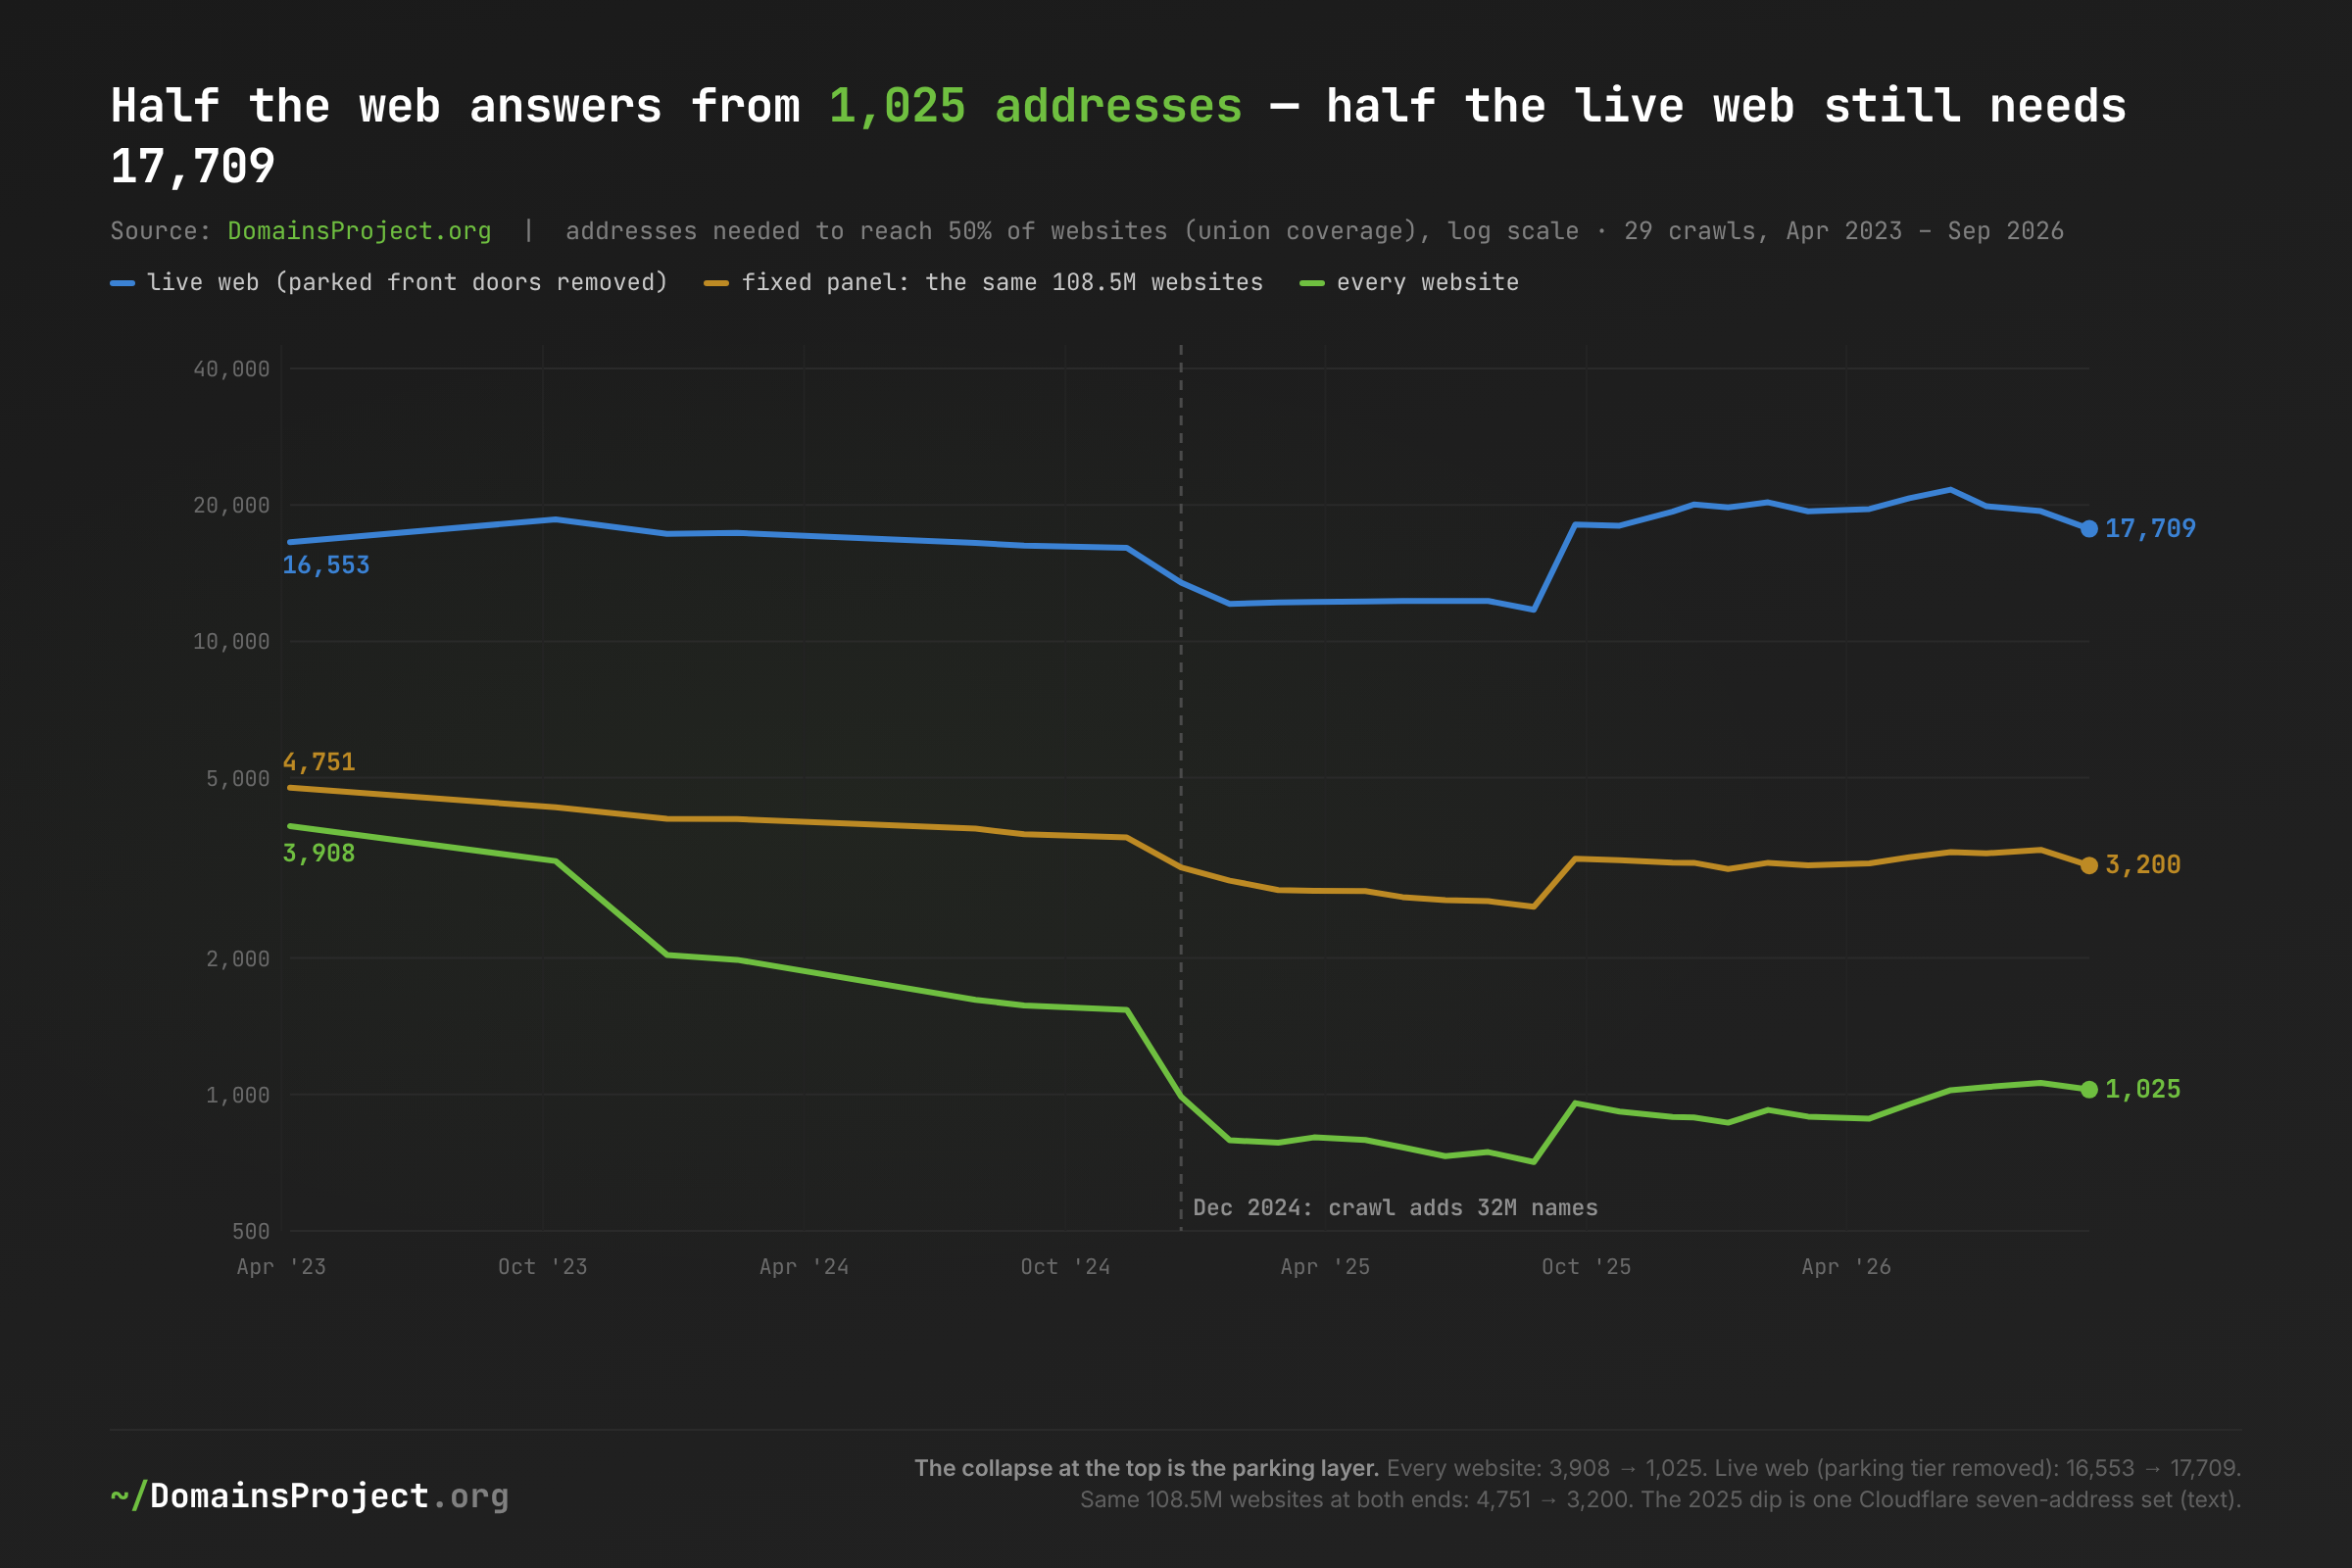
Download: ipdensity-half.csv · union coverage: the fewest most-crowded addresses whose tenants include half of the group's websites. Full per-crawl series for every group: ipdensity-series.csv.
Three lines, three different stories. The whole web's line (green) falls in two steps — late 2023, when GoDaddy consolidated its parking estate onto a pair of Amazon anycast addresses, and December 2024, when the crawl's expansion brought in millions of names that were already parked — bottoms at 709 in August 2025, and has drifted back to about 1,000 since. The fixed panel (amber) drifts down steadily: the same websites really are using fewer, busier front doors. The live web (blue) is flat at the ends and dented in the middle, and the dent has a single cause: from December 2024 to August 2025 one set of seven Cloudflare addresses — 104.21.16.1, 104.21.32.1 … 104.21.112.1, the first address of seven consecutive /20 blocks — was the entire answer for a growing population of Cloudflare-proxied websites, 1.28 million in the first month and 5.09 million in the last, and then vanished from every record in September 2025. Every Cloudflare-proxied answer in the pool listed all seven. It was not a quirk of one resolver: in the August 2025 raw records the seven-address answer arrives through Cloudflare's own resolvers and through unrelated public resolvers in other networks alike, so for those nine months it was what Cloudflare's authoritative servers handed out. Whether it was a deliberate allocation experiment of the kind Fayed et al. described, DNS alone cannot say; it is flagged in every chart rather than smoothed away.
The Tower Blocks: Who Lives on the Most Crowded Addresses
| Rank | April 2023 | Websites | September 2026 | Websites | |
|---|---|---|---|---|---|
| 1 | 34.102.136.180 GoDaddy parked lander (Google Cloud) |
9.01M | 3.33.130.190 GoDaddy parked lander |
23.94M | |
| 2 | 185.230.63.171 Wix |
6.45M | 15.197.148.33 GoDaddy parked lander |
23.91M | |
| 3 | 185.230.63.186 Wix |
6.43M | 13.248.169.48 GoDaddy / Afternic for-sale |
12.74M | |
| 4 | 185.230.63.107 Wix |
6.43M | 76.223.54.146 GoDaddy / Afternic for-sale |
12.74M | |
| 5 | 3.33.152.147 GoDaddy / Afternic for-sale |
4.26M | 198.185.159.144 Squarespace |
7.48M | |
| 6 | 15.197.142.173 GoDaddy / Afternic for-sale |
4.26M | 198.185.159.145 Squarespace |
7.42M | |
| 7–10 | Squarespace ×4 | 3.80–3.87M | 198.49.23.144/.145 Squarespace; 3.33.251.168 GoDaddy default |
7.37–7.41M | |
| 11 | 3.64.163.50 GoDaddy parked lander |
2.53M | 185.230.63.107 Wix |
7.19M | |
| 12–15 | Google front ends (Blogger / Sites / Cloud Run custom domains) ×4 | 1.53–1.55M | Wix ×2; GoDaddy default ×2 | 6.42–6.63M | |
| 16–17 | 34.98.99.30 GoDaddy lander (Google Cloud); 23.227.38.32 Shopify |
1.30–1.44M | HugeDomains ×2 | 3.46M | |
| 18–20 | GoDaddy default ×2; Bodis | 1.28–1.29M | GoDaddy CashParking ×2; 23.227.38.65 Shopify |
2.52–3.27M |
In 2023 the web's busiest addresses were a mix of parking and platforms; by 2026 the top four, and ten of the top twenty, are GoDaddy parking and for-sale front doors. The platforms did not shrink — Squarespace's four addresses nearly doubled, from 3.8 million websites each to 7.4 million — but GoDaddy's estate grew faster, and it grew by concentrating onto pairs of Amazon anycast addresses that each answer for millions of domains.
What the top 100 addresses are
| Category of address | Top-100 addresses, Apr 2023 | Share of all websites | Top-100 addresses, Sep 2026 | Share of all websites |
|---|---|---|---|---|
| Parked / for sale | 38 | 15.31% | 40 | 24.97% |
| Site builders & app platforms | 24 | 10.25% | 37 | 10.43% |
| Registrar & host placeholders | 12 | 2.18% | 10 | 1.41% |
| CDN / proxy shared addresses | 4 | 0.21% | 6 | 0.83% |
| Hosting | 9 | 0.54% | 0 | 0.00% |
| Unidentified | 13 | 0.46% | 7 | 0.40% |
| Total | 100 | 28.95% | 100 | 38.05% |
The entire rise in the top-100 share is parking. The hundred busiest addresses went from 29.0% of all websites to 38.1% — nine points — and the parked and for-sale category gained 9.7, more than the whole rise, while placeholders, hosting and unidentified addresses lost ground. The builder platforms occupy more of the top 100 than they used to (37 addresses, up from 24 — Vercel, Webflow, Render, GoHighLevel and Firebase now have addresses big enough to qualify) yet carry the same tenth of the web they did in 2023.
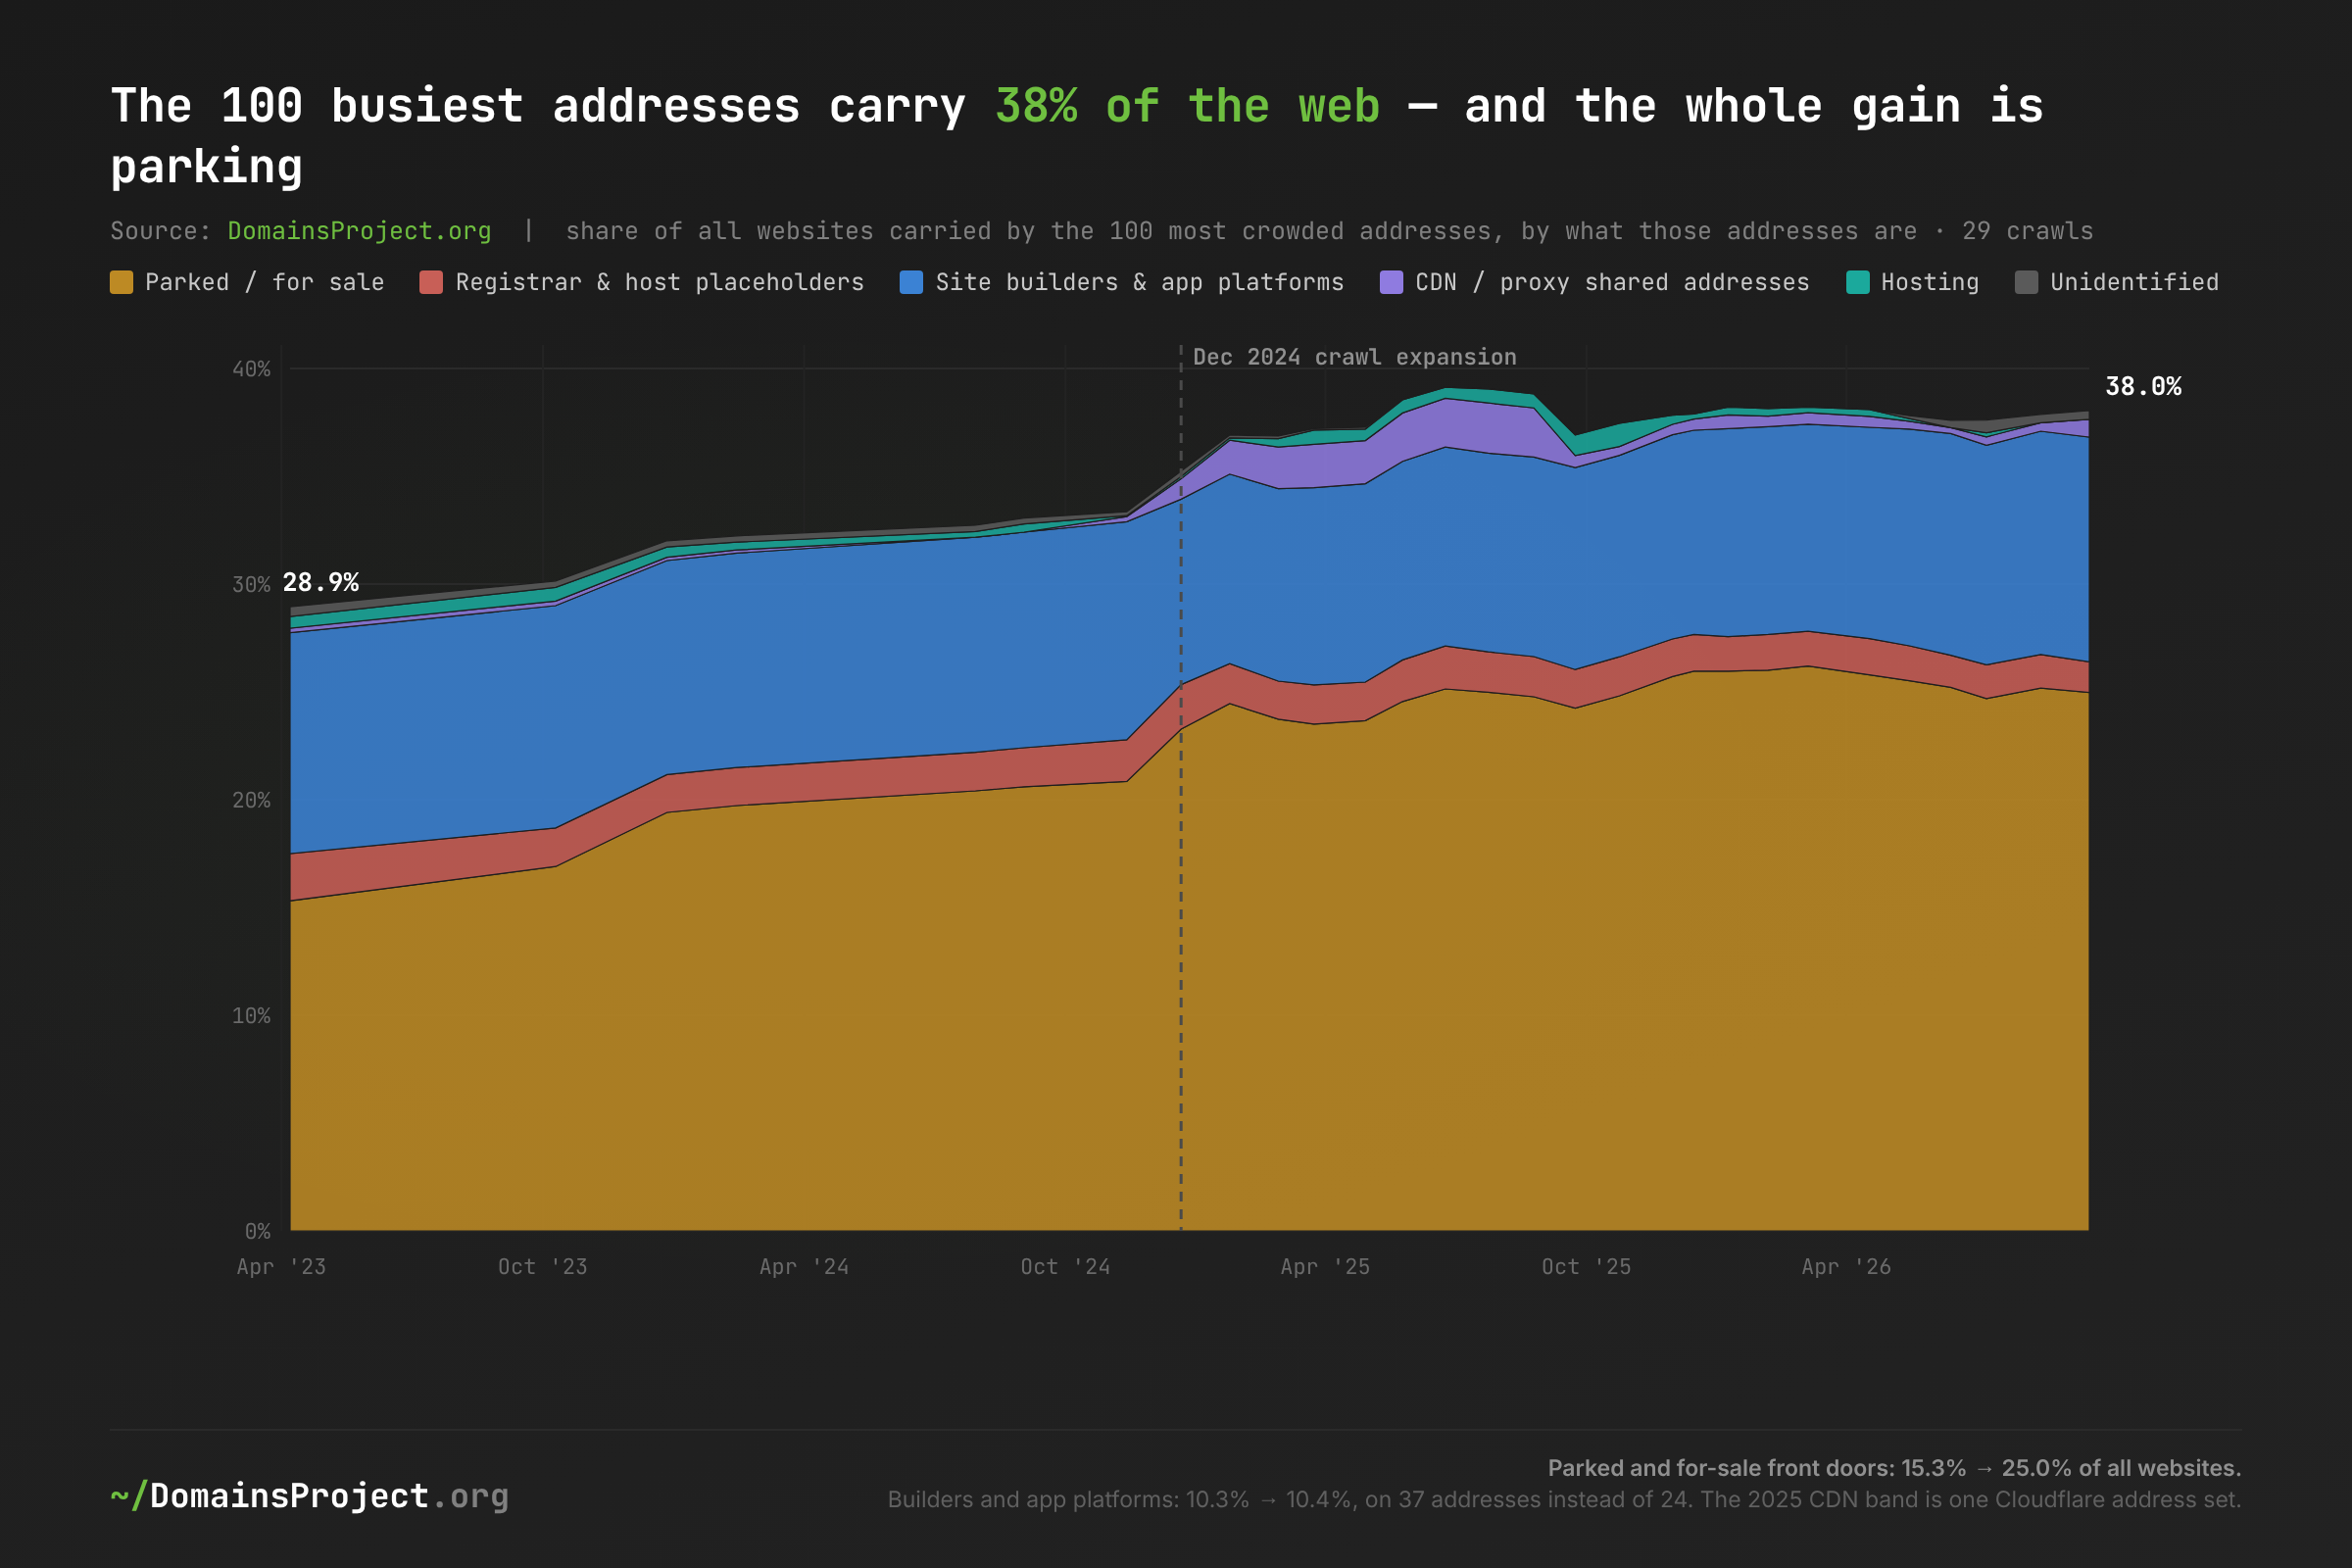
Download: ipdensity-top100.csv · fractional share of all websites carried by the 100 most crowded addresses of each crawl, by category; operator labels in Methodology.
The busiest address on the web changed hands once, in the autumn of 2023, and has not changed since. In April 2023 it was 34.102.136.180, GoDaddy's parked lander on Google Cloud, with 9.0 million websites — the address Zirngibl et al. identified as the internet's most crowded that September. By our October 2023 crawl GoDaddy had moved that estate onto 3.33.130.190 on Amazon's anycast (10.2 million), which crossed 14.9 million by December 2023, 22.5 million in January 2025, and peaked at 24.8 million in February 2026. It has been the single most crowded address in 28 consecutive crawls.
The composition is steady once the inflow settles. From the start of 2025 the parked share of the top 100 sits between 23.5% and 26.2% of the whole web and the builder share between 8.8% and 10.4%. Builders are where the top 100 is turning over: Vercel, Webflow, Render, GoHighLevel and Firebase now each have at least one address among the hundred busiest (Framer, Replit and Carrd are in the top 250), and the builder category holds 37 of the hundred, up from 24. Only 40 of the April 2023 top-100 addresses are still in the top 100 today; in a typical month 86–98 carry over.
The Distribution: Tower Blocks and Empty Suburbs
| The busiest address a website uses serves… | Websites, Apr 2023 | Websites, Sep 2026 | Addresses in the class, Sep 2026 |
|---|---|---|---|
| only that website (dedicated) | 3.89% | 2.59% | 7,884,591 |
| 2–9 websites | 5.76% | 4.29% | 3,686,866 |
| 10–99 | 11.20% | 7.34% | 881,520 |
| 100–999 | 23.39% | 13.33% | 172,465 |
| 1,000–9,999 | 11.10% | 19.91% | 62,374 |
| 10,000–99,999 | 12.69% | 9.32% | 1,470 |
| 100,000–999,999 | 10.93% | 11.82% | 200 |
| 1 million or more | 21.04% | 31.40% | 34 |
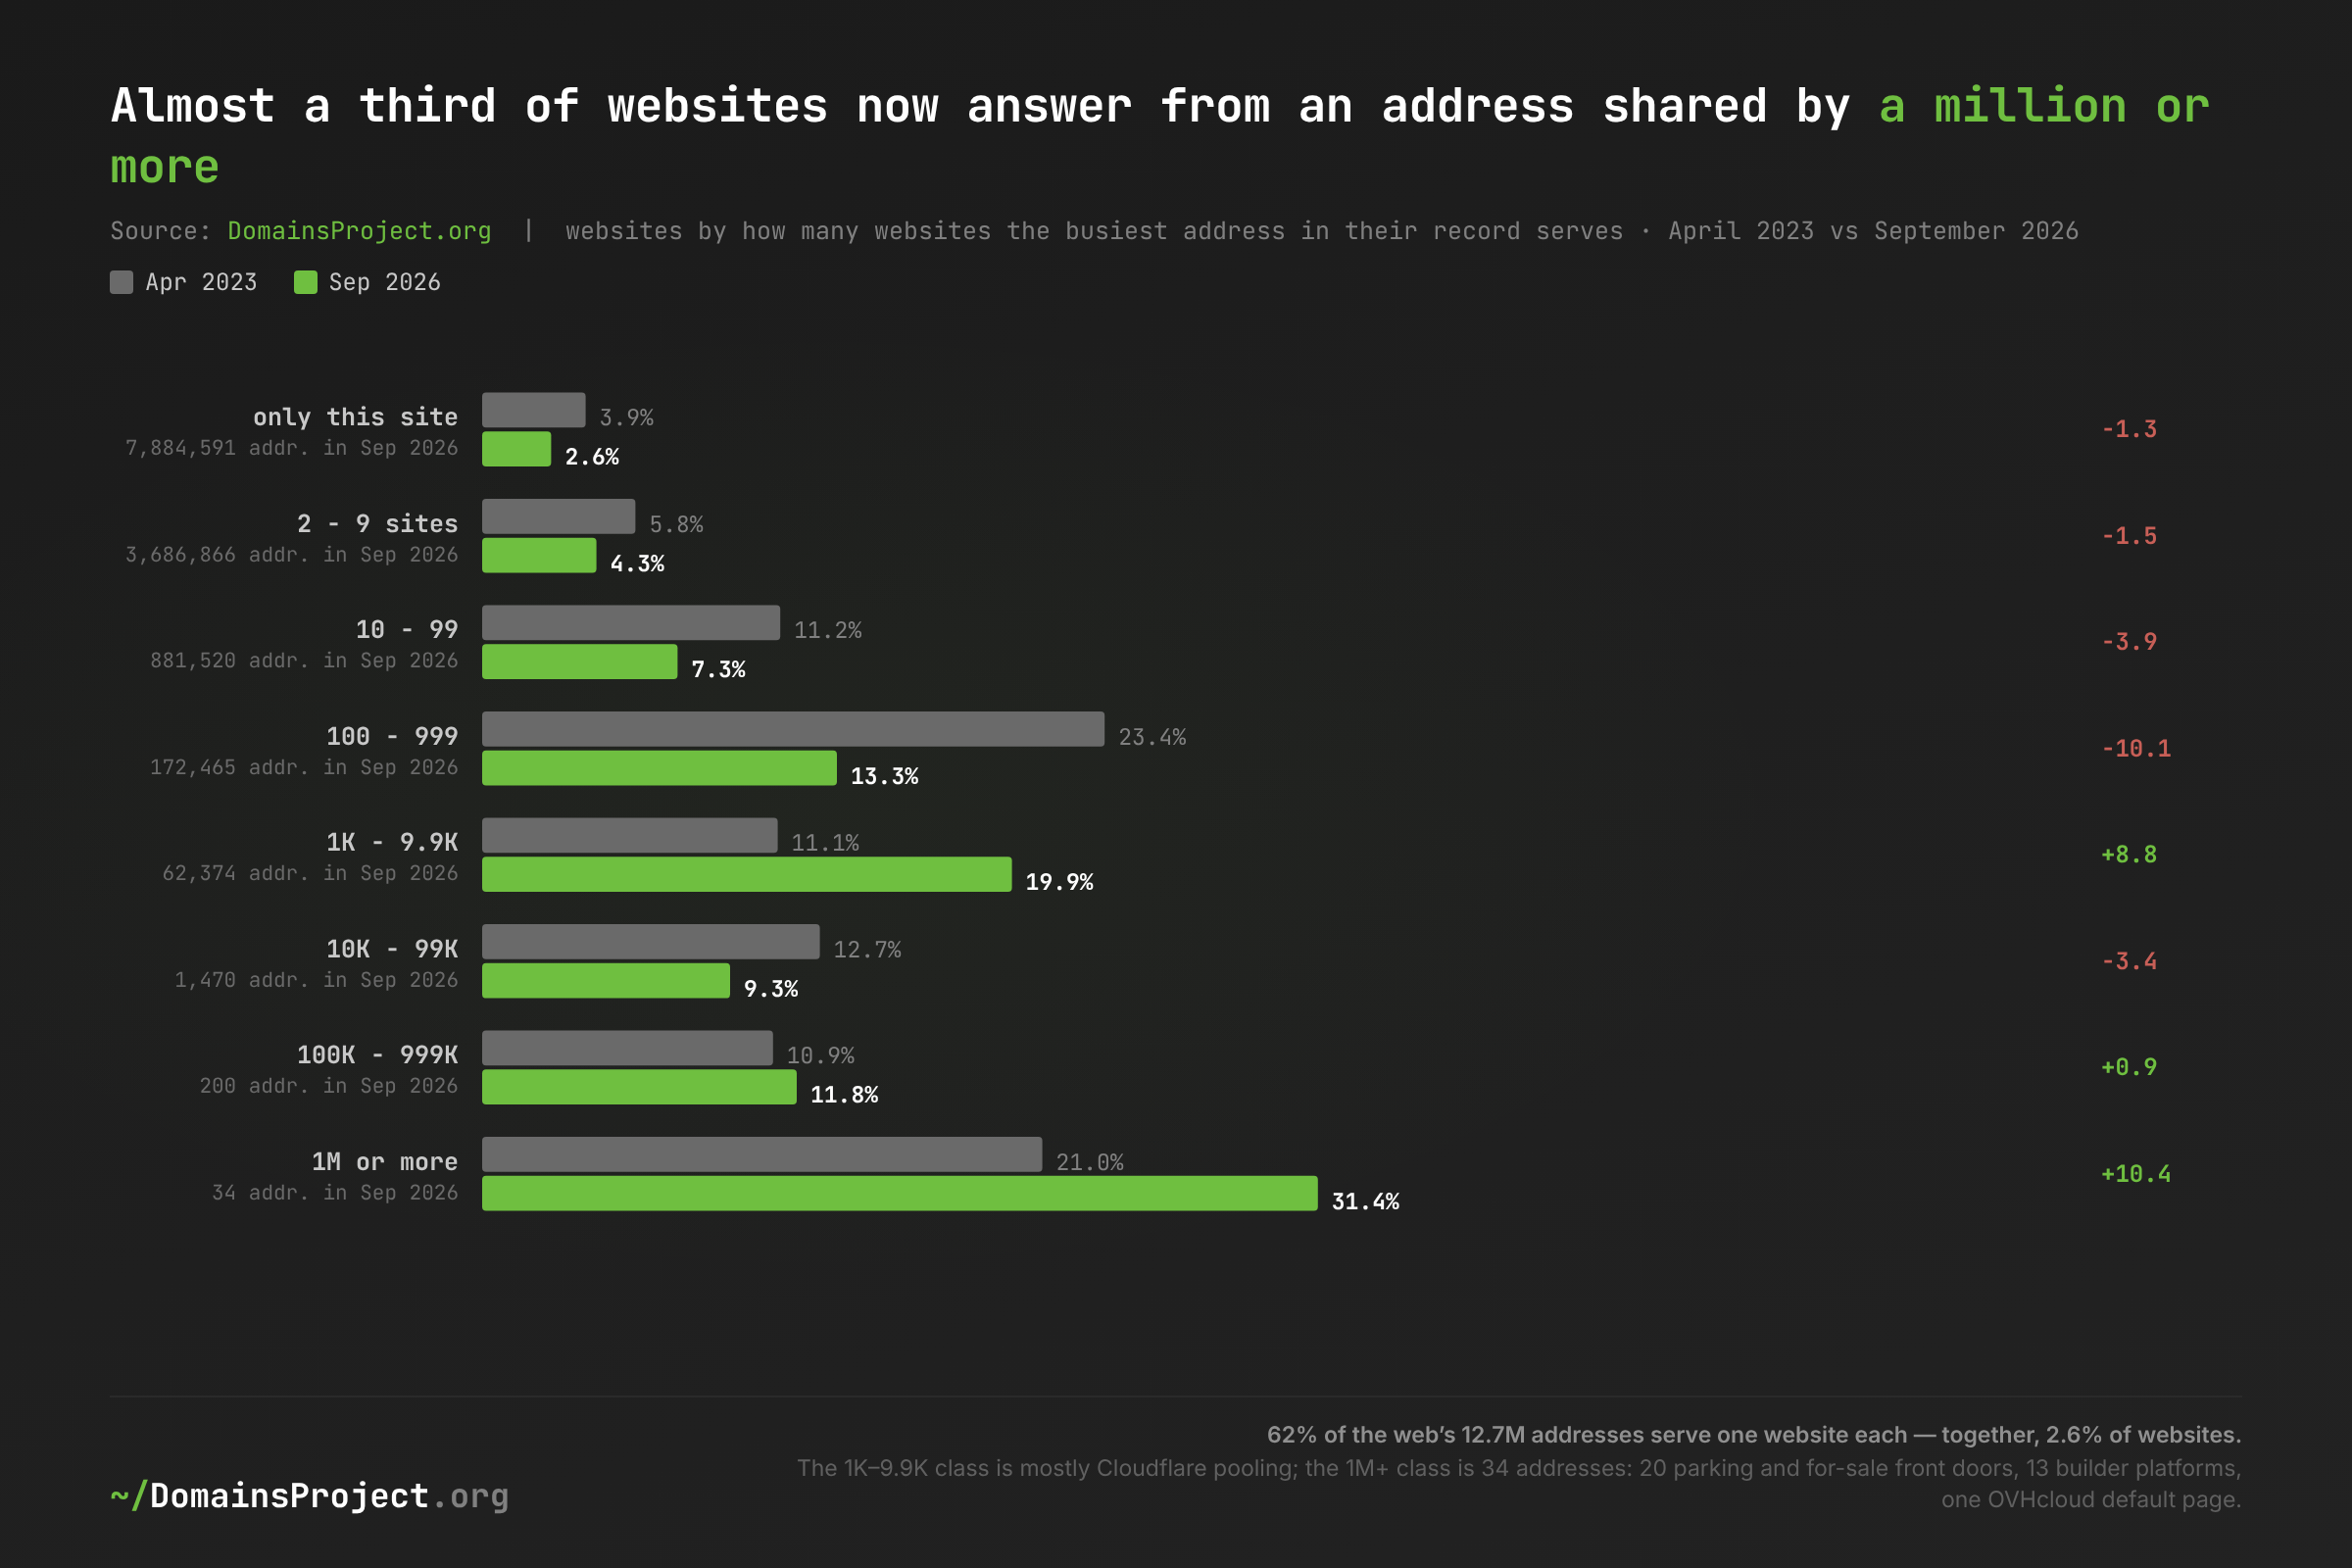
Download: ipdensity-crowding.csv · each website counted once, in the class of the busiest address in its record; address counts are for September 2026.
Every class below a thousand tenants lost share; the thousand-to-ten-thousand class almost doubled; the million-plus class gained ten points. The two gains have different causes. The million-plus class is the parking layer and the big builders. The 1,000–9,999 class is almost entirely Cloudflare: the number of Cloudflare addresses serving at least a thousand websites went from 517 to 49,517. Cloudflare's share of all websites doubled (6.4% → 13.1%) on 7% more addresses (124,004 → 133,207), and its average address went from 88 tenants to 285.
That is the CDN side of consolidation, and it looks deliberate. Cloudflare engineers and academic co-authors showed in 2021 (Fayed et al., SIGCOMM) that the binding between a hostname and an address can be made arbitrary — they served 20 million-plus domains from as few as 256 addresses, and then from one — and argued the result should shape how addresses are allocated. Our data are consistent with the production network moving in that direction: the old pattern, a dedicated pair of anycast addresses per customer zone, is giving way to shared pools where each address serves hundreds or thousands of zones.
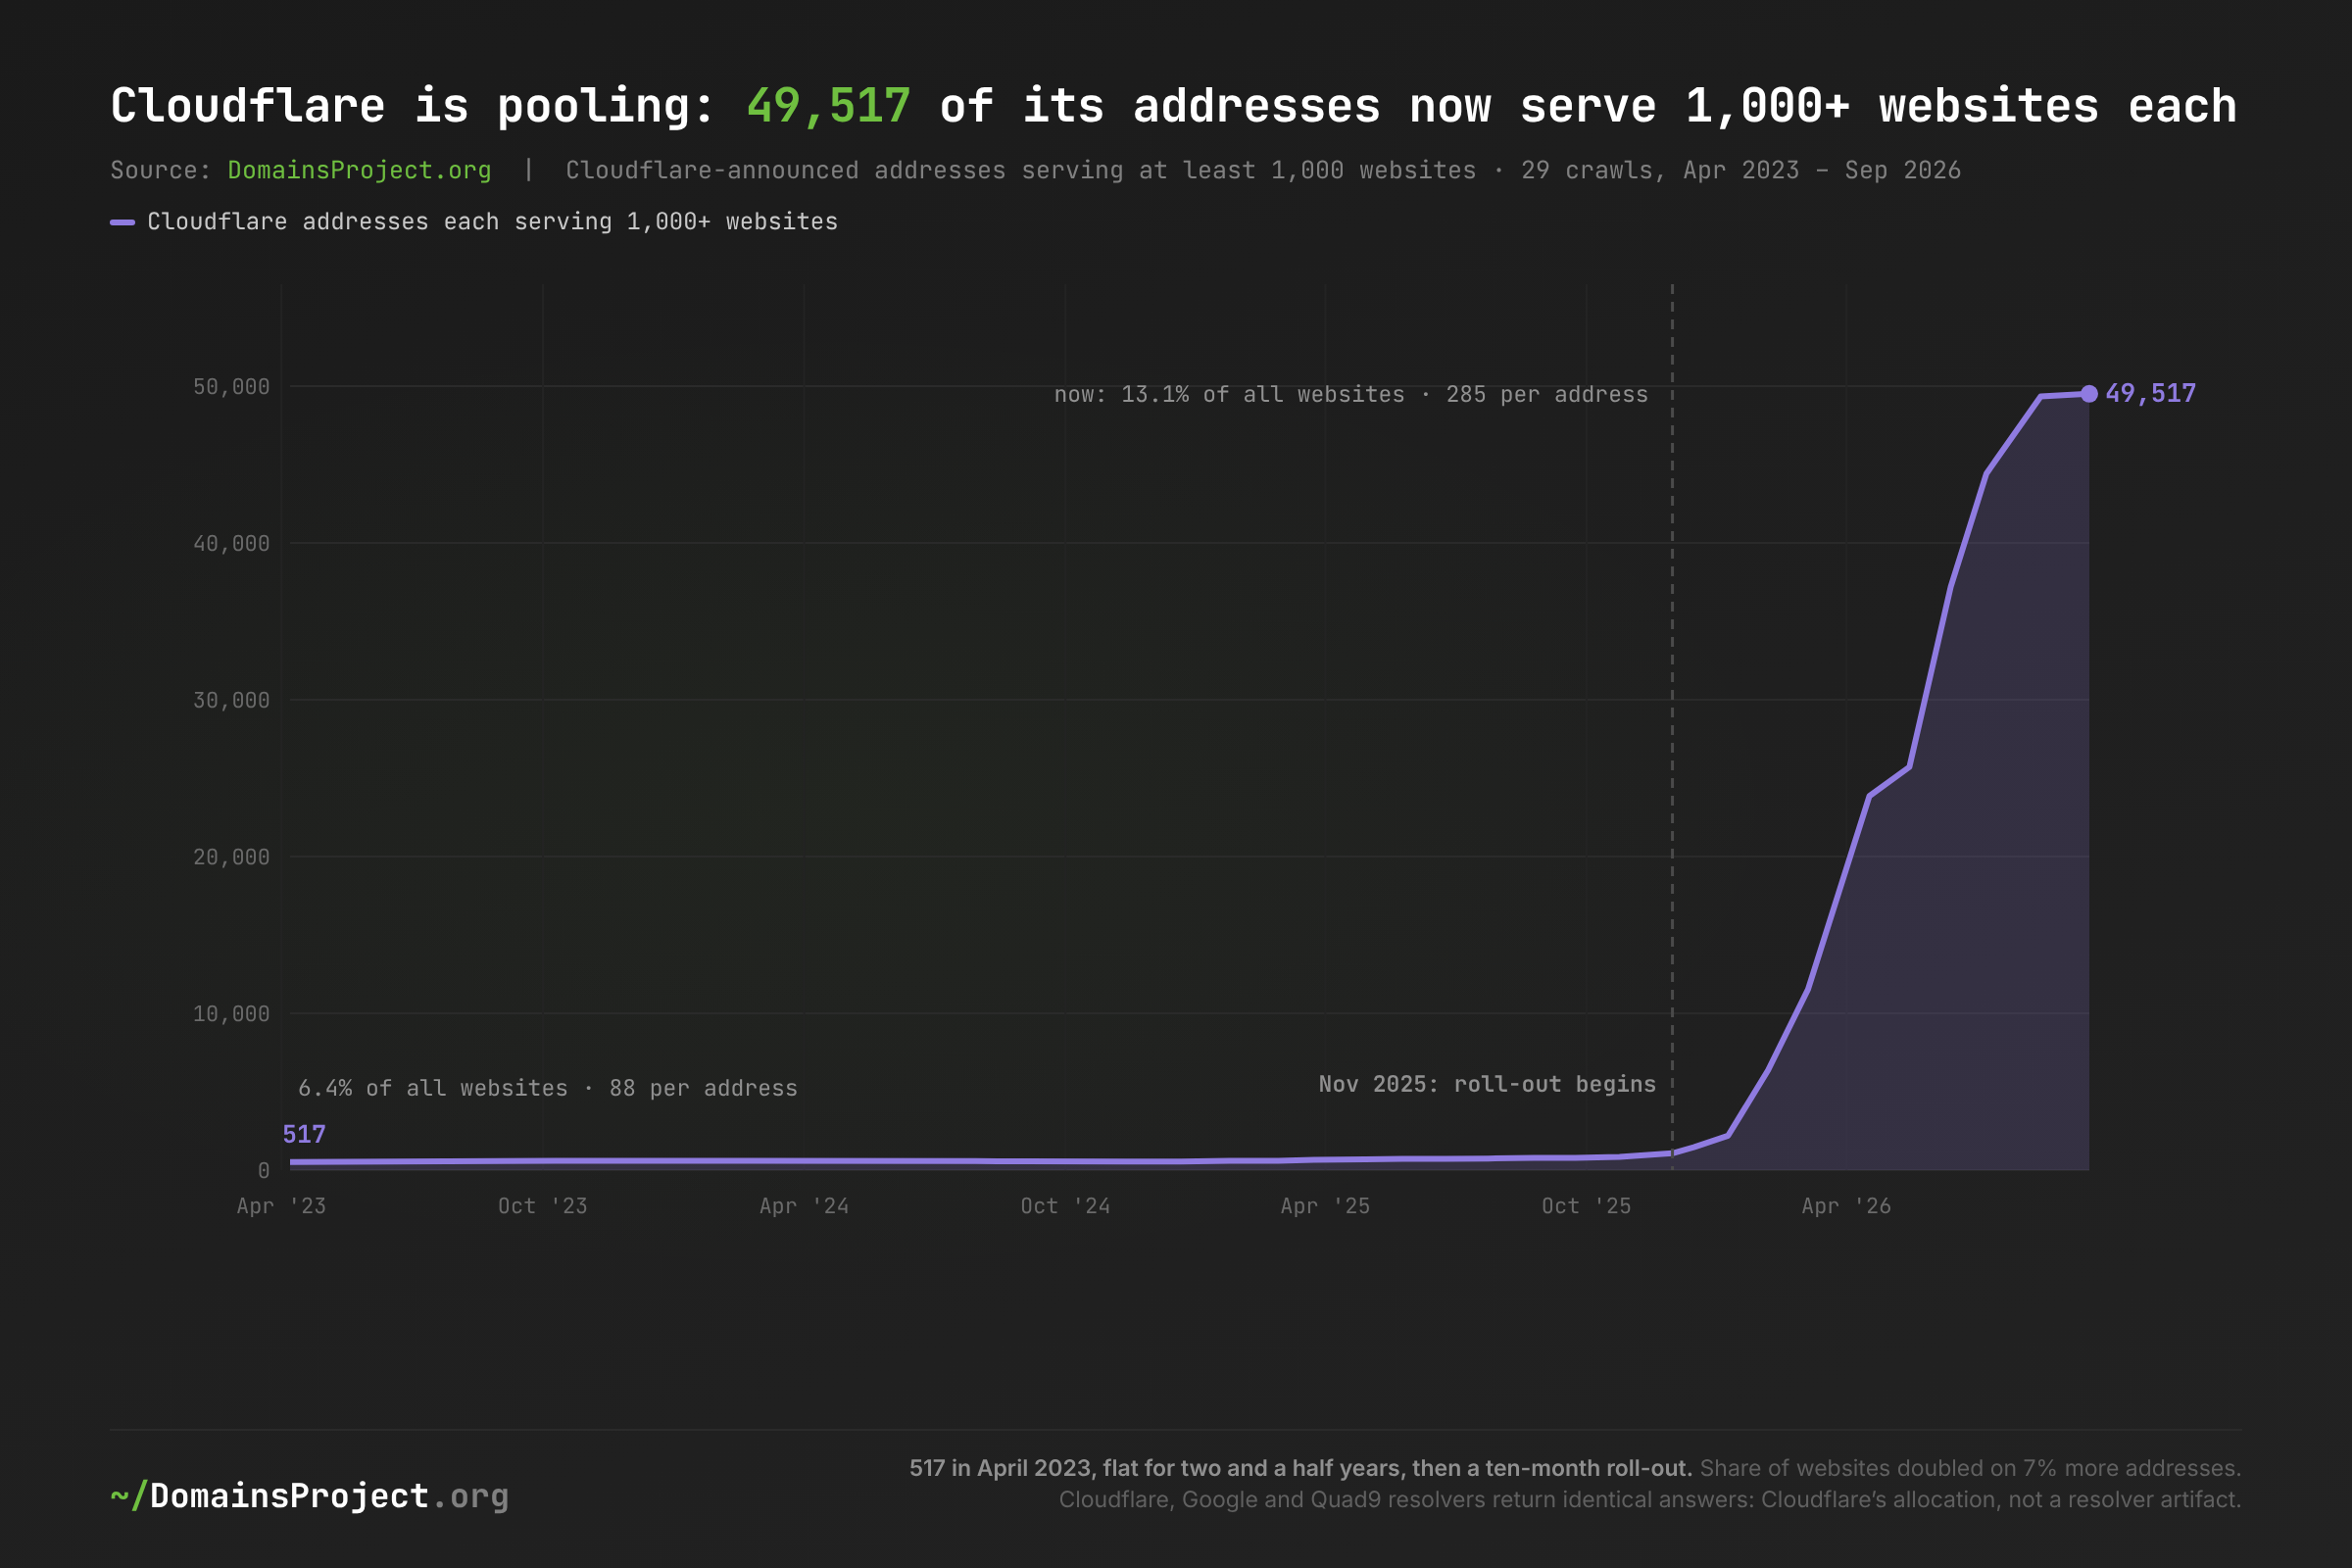
Download: ipdensity-cloudflare.csv · Cloudflare-announced addresses excluding those identified as Shopify, Jimdo, Webflow, Carrd and other platforms' dedicated front doors.
The pooling is recent, fast, and not an artifact of how we asked. For two and a half years the number of Cloudflare addresses serving at least a thousand websites sat between 517 and 845. It passed 1,000 in November 2025, 6,369 in February 2026, 23,857 in April and 49,517 by September. Because the crawl's own mix of recursive resolvers shifted toward Cloudflare's over the same period, we checked: 60 websites sampled from the busiest pooled Cloudflare addresses returned identical answer sets from Cloudflare's, Google's and Quad9's public resolvers on September 23, 2026. The pools are Cloudflare's authoritative allocation, not a resolver's view of it.
The dedicated-address web is shrinking, and it was never large. 3.89% of websites had an address to themselves in April 2023; 2.59% do now. In absolute terms that is 6.6 million websites then and 7.5 million now — the one-server-per-site web is growing, just much more slowly than everything else. It is where the folk model of the web survives: a VPS, a home server, a company machine.
The Density Ladder: Six Orders of Magnitude
| Operator (September 2026) | Addresses | Websites per address | Share of all websites |
|---|---|---|---|
| GoDaddy parking, for-sale & default front doors | 26 | 2,160,839 | 19.4% |
| Hostinger parking | 3 | 699,545 | 0.7% |
| Vercel (published A records) | 6 | 621,714 | 1.3% |
| HugeDomains | 12 | 287,967 | 1.2% |
| Squarespace | 125 | 79,567 | 3.4% |
| Wix | 132 | 58,531 | 2.7% |
| Shopify | 96 | 55,252 | 1.8% |
| Sedo parking | 79 | 46,363 | 1.3% |
| WordPress.com (Automattic) | 1,296 | 1,283 | 0.6% |
| Cloudflare (all other addresses) | 133,207 | 285 | 13.1% |
| Namecheap hosting | 29,559 | 228 | 2.3% |
| IONOS | 184,673 | 40 | 2.5% |
| Hostinger hosting | 360,298 | 17 | 2.1% |
| OVHcloud | 370,045 | 10.4 | 1.3% |
| Hetzner | 410,627 | 9.9 | 1.4% |
| Amazon Web Services | 1,116,524 | 8.4 | 3.2% |
| DigitalOcean | 559,525 | 3.1 | 0.6% |
| Alibaba Cloud | 857,233 | 2.5 | 0.7% |
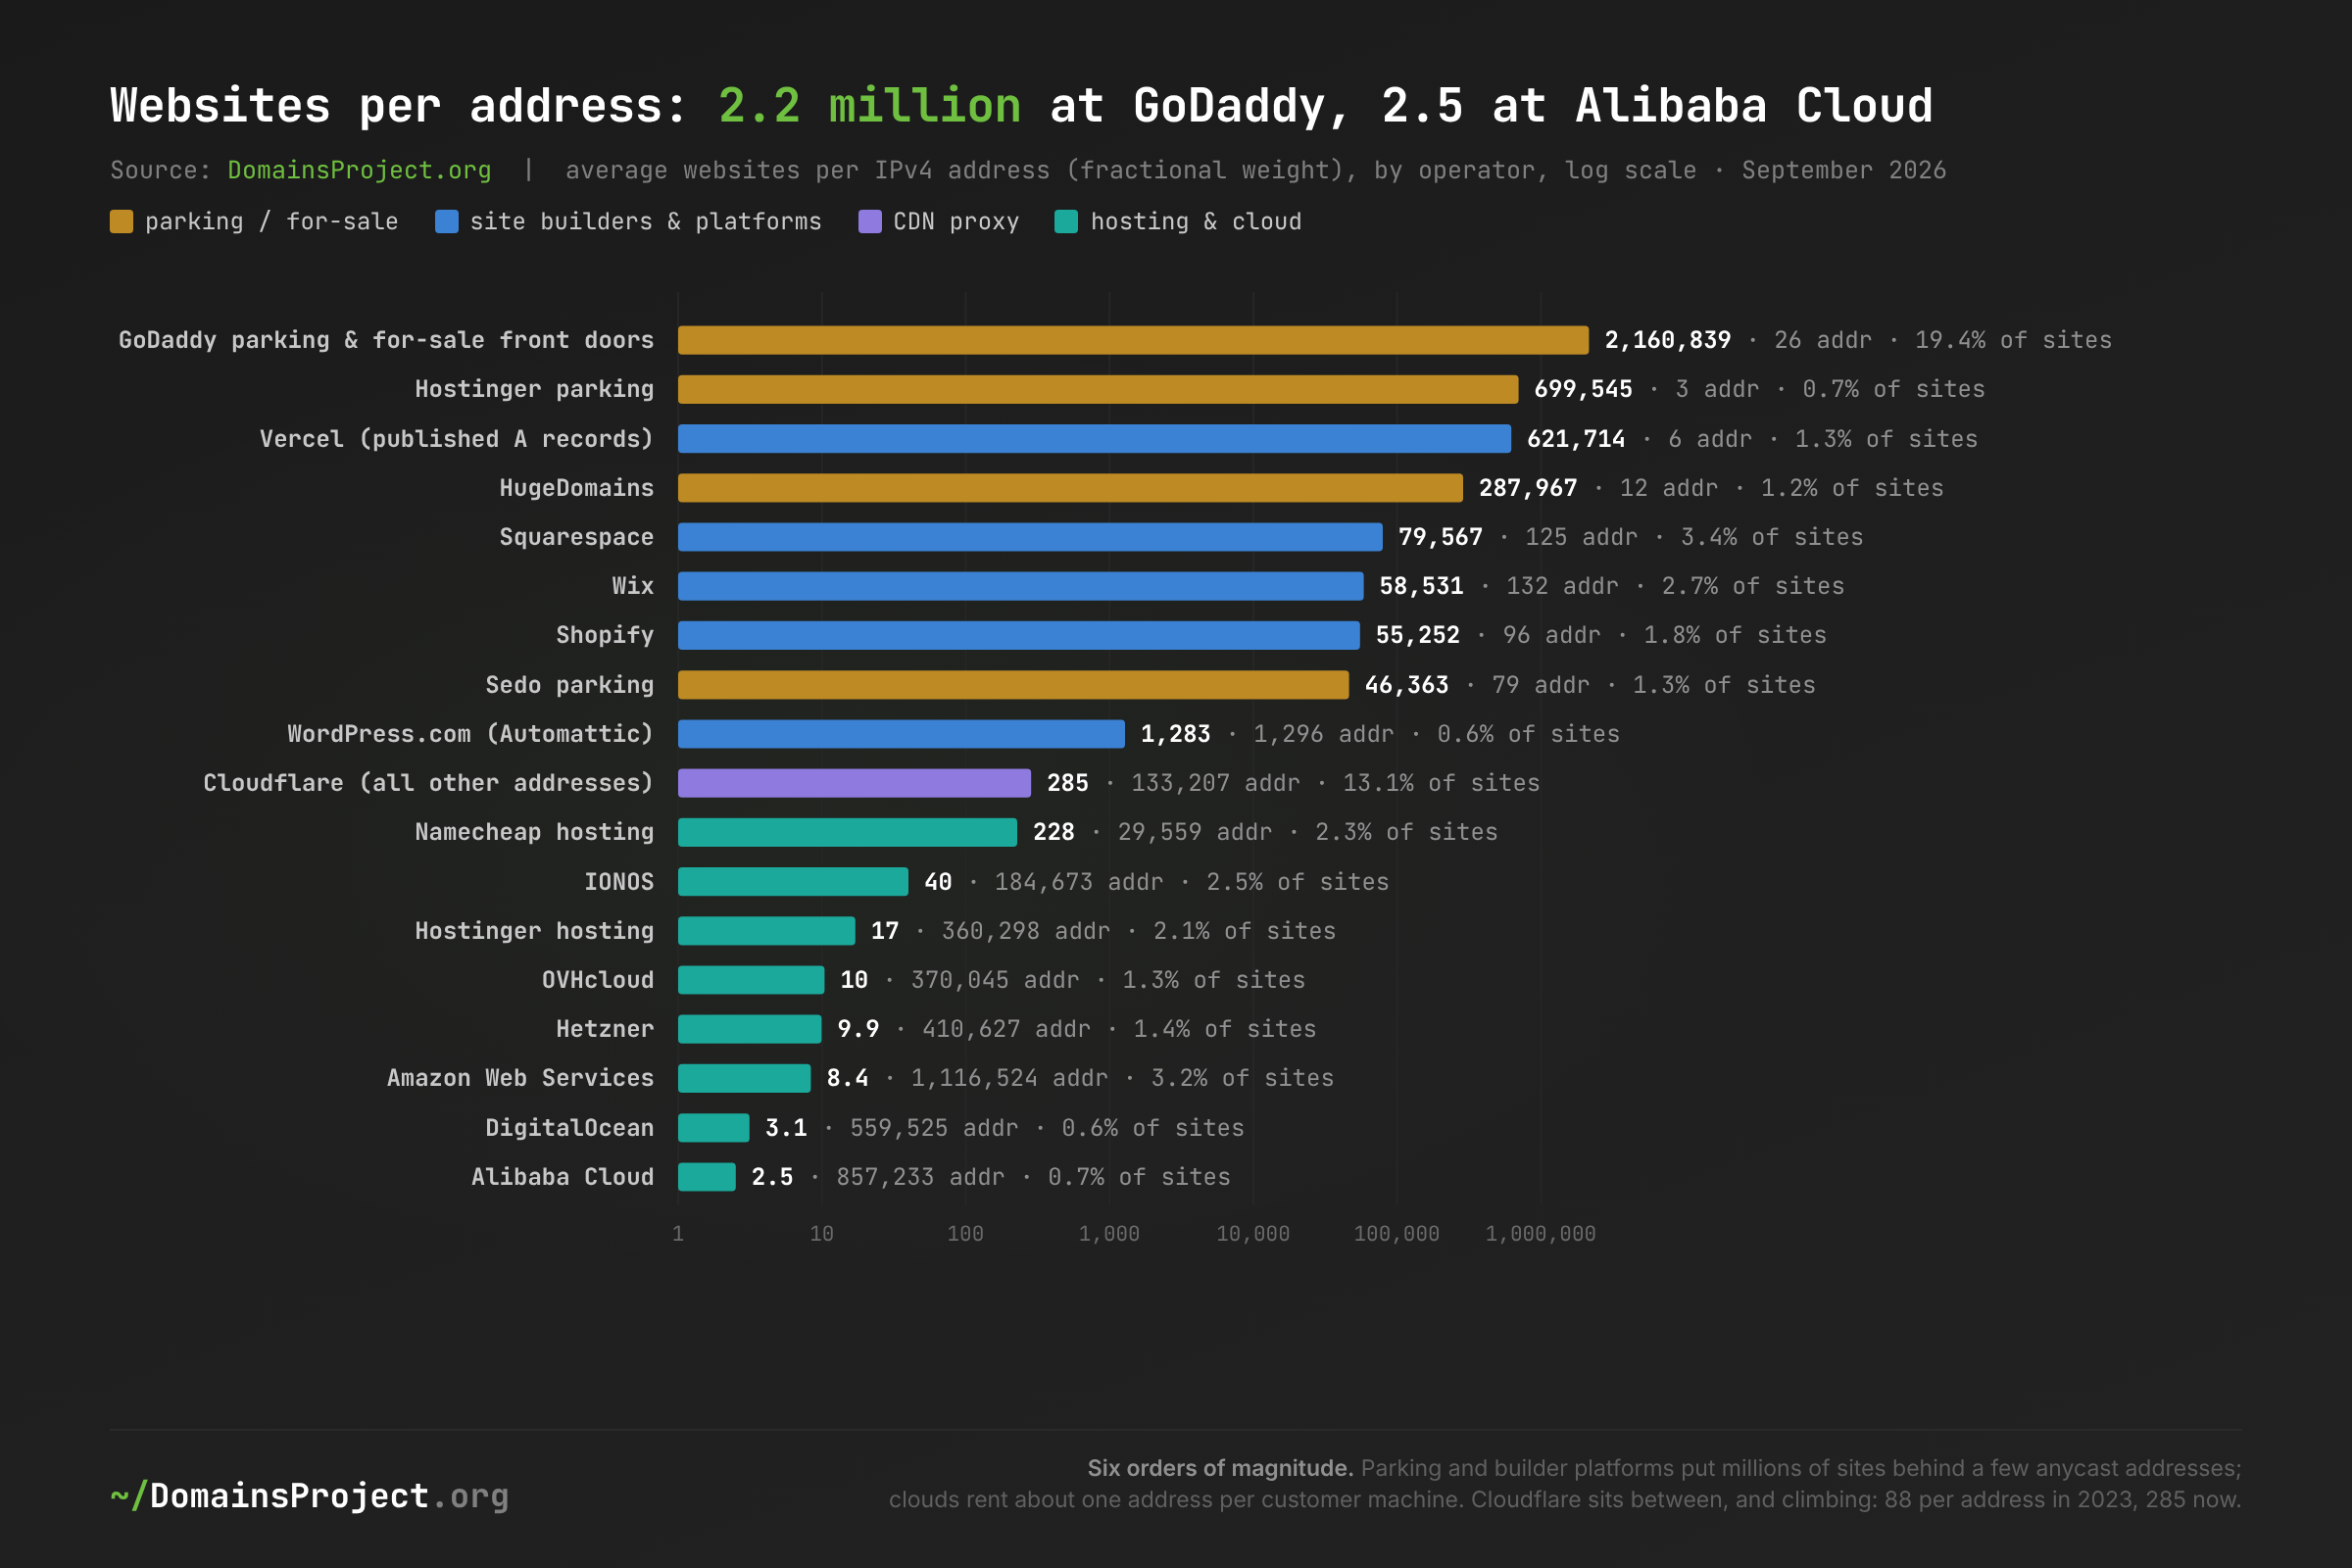
Download: ipdensity-ladder.csv · fractional websites per address; an operator's addresses are those announced by its network or individually verified as its front door.
The ladder is the whole argument in one table. At the top, a few dozen anycast addresses each stand in front of hundreds of thousands to millions of websites: parking estates, then builder platforms that publish their four or six A records in their help pages and ask every customer to use them. At the bottom, the clouds: AWS, DigitalOcean and Alibaba rent roughly one address per customer machine, and 1.1 million AWS addresses carry fewer websites between them (3.2%) than GoDaddy's 26. Traditional shared hosts — IONOS, Namecheap, Hostinger — sit in the middle, at tens to hundreds of sites per server.
Two operators moved on the ladder, in opposite directions. Cloudflare climbed from 88 websites per address to 285 while its share of the web doubled — pooling. Squarespace's addresses each went from 3.8 million websites to 7.4 million while its operator-wide density rose from 48,948 to 79,567. The clouds did not move: AWS went from 6.6 websites per address to 8.4, Hetzner from 11.8 to 9.9, OVH from 10.5 to 10.4. The self-operated web — rented machines answering on their own addresses — has the same shape it had in 2023.
Composition, Not Conversion: Who Actually Consolidated?
A web that adds 120 million websites in three and a half years can concentrate for two reasons: existing websites can move onto shared infrastructure, or the new ones can arrive on it. The two have different implications — one is a change in how the web is built, the other is a change in what the web is made of — and they can be separated.
| April 2023 | September 2026 | |
|---|---|---|
| Fixed panel — the 108.5 million websites present in both crawls | ||
| Distinct addresses they use | 8,023,534 | 7,056,875 (−12.0%) |
| Addresses reaching half of them | 4,751 | 3,200 |
| Share reachable via their top 100 addresses | 28.97% | 31.46% |
| Dedicated-address share | 3.99% | 3.08% |
| Gini (addresses) | 0.904 | 0.912 |
| Newcomers — websites absent in April 2023 | — | 181.2M |
| Addresses reaching half of them | — | 362 |
| Share reachable via the web's top 100 addresses | — | 42.86% |
| Live web — everything not parked | 141.2M | 216.8M |
| Addresses reaching half of it | 16,553 | 17,709 |
| Share reachable via its top 100 addresses | 18.62% | 20.69% |
| Websites per address | 12.9 | 17.1 |
| Dedicated-address share | 4.66% | 3.47% |
| Networks holding half of it | 20 | 11 |
| Gini (addresses) | 0.898 | 0.919 |
The same websites consolidated too — modestly. The 108.5 million websites that exist at both ends of the window use 12% fewer addresses than they did in 2023, and their busiest hundred addresses reach 2.5 points more of them. That is real movement onto shared infrastructure, and it happened without a single new site.
But most of the headline is the new web arriving crowded. The top-100 addresses' reach grew by 9.1 points. Decomposing it exactly: +1.6 points is the fixed panel moving (28.6% → 30.2% on the web-wide ranking), −0.4 points is survivor selection (the 2023 websites that survived were slightly less crowded than those that died), and +7.9 points is composition — 181 million newcomers, half of which answer from 362 addresses and 42.9% of which sit on the web's hundred busiest.
The panel's consolidation is steady, not a step. Its Gini rises in every stretch of the record — 0.904, 0.907 at the end of 2024, 0.908 in 2025, 0.912 now — and the addresses it needs to reach half of itself fall from 4,751 to about 3,200 (the amber line in the chart above). That is the same websites being migrated, one platform decision at a time, onto front doors that serve more sites than the ones they left.
And the parking layer is what makes the newcomers look the way they do. Remove the parked websites and the top end of the live web barely moved: its hundred busiest addresses reach 20.7% of it, against 18.6% in 2023, and it still takes about 17,700 addresses to reach half of it. What the live web did instead is thin out underneath: the live web's dedicated share fell by a quarter (4.66% → 3.47%), the average address serves a third more live websites, and the number of networks needed to hold half of the live web fell from 20 to 11 — the CDN pooling above, seen from the other side.
Where the One-Site Address Survives
| TLD | Websites, Sep 2026 | Websites per address, 2023 → 2026 | Dedicated, 2023 → 2026 | On the web's top 100 addresses, 2023 → 2026 |
|---|---|---|---|---|
.com |
141,453,371 | 11.7 → 20.2 | 4.22% → 2.30% | 34.5% → 45.4% |
.net |
9,928,374 | 6.4 → 7.7 | 4.73% → 3.20% | 38.1% → 40.8% |
.org |
10,158,560 | 8.7 → 10.3 | 2.67% → 2.10% | 44.1% → 44.6% |
.xyz |
7,282,724 | 6.3 → 24.1 | 5.04% → 1.45% | 36.4% → 78.5% |
.top |
3,355,599 | 2.9 → 10.3 | 15.14% → 4.31% | 4.7% → 38.4% |
.ai |
1,100,633 | 2.1 → 5.7 | 7.24% → 3.01% | 36.4% → 61.0% |
.io |
1,025,749 | 2.4 → 4.0 | 8.17% → 4.56% | 37.4% → 46.1% |
.co |
2,577,366 | 6.6 → 9.0 | 2.19% → 1.39% | 43.7% → 54.4% |
.shop |
2,800,253 | 6.0 → 10.6 | 1.72% → 2.41% | 25.9% → 32.7% |
.de |
12,725,101 | 13.4 → 19.0 | 2.36% → 1.69% | 11.5% → 14.0% |
.uk |
7,357,870 | 11.3 → 15.8 | 2.29% → 1.46% | 29.8% → 43.3% |
.nl |
3,994,709 | 13.0 → 13.4 | 1.88% → 1.66% | 8.2% → 14.4% |
.fr |
3,723,237 | 11.1 → 10.9 | 2.57% → 2.47% | 30.2% → 30.6% |
.it |
2,656,679 | 9.7 → 9.9 | 2.21% → 1.96% | 14.3% → 10.4% |
.pl |
2,004,622 | 7.1 → 8.3 | 4.21% → 3.25% | 13.2% → 7.9% |
.cz |
1,162,198 | 10.2 → 9.1 | 1.86% → 1.75% | 2.9% → 6.3% |
.br |
3,554,501 | 9.7 → 10.2 | 2.61% → 3.18% | 13.1% → 20.5% |
.jp |
1,369,704 | 3.4 → 4.2 | 17.20% → 11.53% | 3.9% → 6.2% |
.cn |
4,846,159 | 2.0 → 4.5 | 23.69% → 8.77% | 5.2% → 6.0% |
The new gTLDs are where the web's crowding lives. Nearly four in five resolving .xyz websites now answer from one of the web's hundred busiest addresses (36% → 79%), and so do three in five .ai websites (36% → 61%) and nearly two in five .top (5% → 38%) — the same namespaces The Parking Lot found filling with landers. .com moved from a third to 45%.
The governed European ccTLDs barely moved. .de (12% → 14%), .nl (8% → 14%), .it (14% → 10%), .pl (13% → 8%) and .cz (3% → 6%) are still hosted largely on national hosting markets whose shared servers carry tens to hundreds of sites each, not millions — Strato's and Aruba's shared web servers appear in our top 300 at 100,000–150,000 websites apiece, two orders of magnitude below a parking front door. The UK is the exception, at 43%: .uk looks like .com, not like its continental neighbours.
The one-site address survives in Asia. 11.5% of .jp websites and 8.8% of .cn still have an address to themselves, against 2.3% of .com. Both fell — .cn from 23.7% as its corpus grew fivefold — but the Chinese and Japanese web remains the part of the internet most likely to run on a machine that serves nothing else, which is consistent with local cloud markets that sell per-instance addresses rather than shared front doors. Hosting-country geolocation tells the same story at a level we can trust (CN-geolocated websites are 36% dedicated, US-geolocated 1.5%), but its trend is unusable because anycast blanks the geolocation for a growing share of sites.
Addresses Are Not Forever
An address is a lease, not a place, and the busiest leases turn over. Four moves in the record show how the web's front doors migrate — and one expected move that never showed up.
GoDaddy left Google Cloud in a single season. 34.102.136.180 and 34.98.99.30, the Google Cloud landers that carried 10.4 million websites in April 2023, were the busiest addresses on the web; by October 2023 the estate had moved to Amazon anycast. That re-dates the migration to 2023 exactly as The Parking Lot found, and it is visible here as the first cliff in the half-the-web line.
Jimdo moved its customers from Amazon to Cloudflare in 2023, then doubled them. In April 2023 Jimdo sites answered from a cluster of five AWS Ireland addresses (identified by their tenants' jimdo.com nameservers); by October they answered from 162.159.128.70 and 162.159.129.70 on Cloudflare, about 125,000 websites each. Between October and November 2025 each address went from 195,000 to 387,000 websites — the platform moving more of its estate onto the same two front doors, in the same half-year in which our SaaS Ledger saw one Jimdo DNS-automation marker disappear from 312,000 customer domains. The two observations are consistent with a single re-platforming; DNS alone cannot prove it.
Bodis's addresses went dark with the company. 199.59.243.223 served 1.28 million parked websites in April 2023, and Bodis's lander addresses — rotated roughly monthly inside one /24 — carried 2.4 million by mid-2025. Five days after the January 31, 2026 shutdown they served 373,000; a month later, 10,000; today, 1,601.
A twelve-address fleet disappeared from the top. Twelve Linode addresses that each served about 586,000 websites in April 2023 — every website listing all twelve — fell out of the top 100 in May 2025 and below 6,000 tenants each by October 2025 as their websites lapsed. Where sampled tenants still exist they sit with expiry and aftermarket registrars; we could not attribute the fleet and it remains in the unidentified category.
The AWS public-IPv4 charge left no measurable trace here. Amazon began billing $0.005 per public IPv4 address per hour on February 1, 2024. If customers consolidated their websites onto fewer addresses in response, it would show as a falling AWS share of the web's addresses. We cannot see it. In absolute terms AWS addresses fell from 1.13 million in December 2023 to 0.99 million in November 2024 — but the whole crawl shrank over the same months (192.8 million websites on 11.2 million addresses to 161.0 million on 9.6 million), and AWS's share of all website addresses held at 10.1% and 10.3%. Across the full window AWS went from 1.09 million addresses to 1.12 million. If the charge made customers consolidate, the effect is too small to separate from crawl coverage at this resolution.
What's at Stake
- An IP block is a neighbourhood block, and the neighbourhoods are getting bigger. The Cloudflare address Italy's Piracy Shield blocked on February 24, 2024,
188.114.97.7, was the website record of 123,816 registrable domains in our crawl ten days earlier; it is the record of 191,865 today. The median website in 2026 answers from an address that serves 18,124 websites. Every court or regulator that orders an address blocked is ordering the median website's neighbours blocked with it, and the neighbour count went up 7.5× in three and a half years. - Encrypted Client Hello protects the crowd, not the site. ECH hides the hostname inside the TLS handshake, but not the address the client connects to, and RFC 9849 is explicit that its privacy is the size of the anonymity set of sites behind the same client-facing server. A website whose address serves no one else is identified by the address alone: the 2.6% of websites with a dedicated address — 7.5 million of them — get nothing from it, and the one in seven whose busiest address serves fewer than a hundred get little. The consolidation this post measures is, from a privacy engineer's point of view, good news bought with the blast radius above: the same crowd that hides you is the crowd that goes dark with you.
- Two addresses fail together for one website in twelve. GoDaddy's lander pair answers for 23.9 million websites; its four busiest address pairs for 50.4 million (17.4%). They are anycast, so a single machine failing does not matter, but a routing leak, a misconfigured accelerator or an upstream policy change on those prefixes is a single event that touches between 8% and 17% of the registrable web at once. Most of what they serve is parked, which is why nobody notices — until the same pattern shows up in a builder platform: Squarespace's four published addresses each carry about 7.4 million websites, because every Squarespace site lists all four.
- "Number of servers" statistics are mostly the suburb. 62% of the addresses the web uses serve a single website each; together they carry 2.6% of websites. Any count of hosting infrastructure that treats addresses as equal — "the web runs on 12 million servers" — describes the least important part of the web in the greatest detail. Concentration statistics have to be weighted by what an address serves, or they measure the long tail and call it the web.
- Shared addresses make IP reputation a group sentence. A blocklist entry, a spam listing or a threat-intelligence verdict on an address applies to every tenant. On the busiest addresses that is millions of unrelated registrants; on a Cloudflare pool address, a thousand. As pooling spreads, "this IP hosted something bad" carries less information about any one site on it — and more collateral cost.
What Would Help
1. Courts and regulators: require a tenant count before any IP-blocking order. The information exists and is cheap: a passive-DNS or crawl-based count of how many registrable domains resolve to the address. Italy's 2024 incident and Spain's 2025–26 matchday blocks were, measured this way, orders against six-figure numbers of unrelated websites. An order that states its own collateral count — and a threshold above which it must target a hostname instead of an address — would turn an unmeasured externality into a decision someone has to sign.
2. Parking and platform operators: publish your front-door address lists. GoDaddy's lander, for-sale, default and CashParking front doors are 26 addresses serving a fifth of the web; Squarespace, Wix and Shopify publish theirs in their help documentation, parking operators mostly do not. A maintained, machine-readable list — the equivalent of Cloudflare's ips-v4 file — would let crawlers, security vendors and researchers separate inventory from publication without the fingerprinting this post had to do, and ties directly to the labelling recommendation in The Parking Lot.
3. Security vendors: weight address-based verdicts by crowding. An address that serves one website is evidence about that website; an address that serves 18,000 is evidence about a platform. Reputation systems that score by IP should carry the tenancy count alongside the score and decay the per-site inference as it grows — the per-address incidence in this post's data is exactly that input.
4. Measurement researchers: filter private-suffix pseudo-apexes and wildcard TLDs before counting anything. This corpus gained 14.2 million EC2 hostnames that the Public Suffix List's private wildcard rules turned into "registrable domains", each on its own address; left in, they would have more than doubled the address count in one month and reversed the dedicated-address trend. A .ph wildcard adds another 14.4 million names on one address. Both are one-line filters — keep a name only if it equals its ICANN-only registrable domain, and drop TLDs whose random labels resolve — and both change results.
5. Site owners who need privacy: check your crowd. ECH hides your hostname from the network, not the address your visitors connect to. If yours is one of the 7.5 million websites with an address to itself, ECH, DNS-over-HTTPS and every other name-encryption layer still leave you identifiable by address alone; only a shared front door — a CDN or platform pool whose sites also share one ECH configuration — changes that. If you are on a pool of thousands, know that the same pool is what an IP block takes down.
Methodology: 29 full A-record crawls of the DomainsProject corpus (April 7, 2023 – September 18, 2026), reduced to one website record per ICANN-registrable apex domain — bare-apex A record, else www — using the same merged tables and front-door classifier as Where the Web Moves and The Parking Lot, extended with three new crawls. Registry-wildcard TLDs (ph, ws, tk, ml, ga, cf, gq), private-suffix pseudo-apexes (14.2 million EC2 hostnames by 2026), DNS-filter sinkhole answers and Russian-administered TLDs are excluded from every figure. Crowded addresses were labelled from the published front-door registry plus live fingerprinting of sampled tenants (409 new labels); composition is controlled with a fixed panel of the websites present at both ends and with the #98 parking tier. Full data: series, half-the-web, top-100 composition, crowding, density ladder, Cloudflare pooling. For the ownership view of the same infrastructure see Who Controls the Internet in 2026?; browse the corpus on the TLD statistics pages or get the data on the dataset page.