Correction, September 23, 2026: from the December 2024 crawl onward, the original version of this post counted about 14.8 million EC2 public hostnames (ec2-…compute-1.amazonaws.com) as registrable domains — the Public Suffix List's private wildcard rules make each one look like an apex — and AWS publishes all of them at a one-day TTL. Removing them changes the long end of the story: the share of domains at a day or more did not grow from 3.27% to 6.36%, it slipped to 2.88%, and the December 2024 "step" we attributed to registrar front doors was these hostnames. The short end is stronger than reported — 28.67% of domains, and 36.38% of live sites, now publish five minutes or less (not 27.28% and 34.03%) — and the one-hour TTL grew rather than holding flat. The fixed panels, the DNS-operator analysis and the platform findings are unchanged. The problem was found while building How Many Computers Host the Web?.
On August 13, 2026, a storm knocked out the cooling at a Phoenix data centre and Namecheap shut down more than 5,000 servers. The outage ran 30 hours and 32 minutes, and it took down more than the sites Namecheap hosted: because the company's authoritative nameservers sat in the same building, domains delegated to registrar-servers.com went dark wherever their websites actually lived.
Not immediately, though. For a while those domains kept working, because resolvers around the world still had their addresses in cache. How long that grace period lasted had been decided years earlier by a number almost nobody sets deliberately: the record's time-to-live. On Namecheap's nameservers that number is 1800 seconds for 48.0% of the zones they serve and 1799 — one second short of half an hour — for another 31.1%. Half an hour after its last successful lookup, each of those domains stopped existing for anyone who had not visited recently.
TTL is the Internet's forgetting curve. It decides how much traffic authoritative servers carry, how quickly a failover reaches users, how long a hijacked record outlives its correction, and how much of the web keeps working when its DNS provider does not. It has a research literature — Moura, Heidemann, Schmidt and Hardaker's IMC 2019 study is the standard reference — and a settled recommendation from it: at least one hour, and ideally 4, 8 or 24. What it has not had is a public longitudinal measurement of what the web actually does.
We ran a full A-record census of the DomainsProject corpus at 28 points between April 2023 and August 2026 and kept the exact TTL of every answer: 43,643,919,012 DNS records read, of which 6,908,808,702 are the address record of a registrable apex domain. That is one number per domain per pass, across a 40-month span, and it is the population this post measures.
The headline: the web's memory is not shrinking uniformly — it is being set for it, by a handful of platforms, and the short end is where the movement is. The share of domains whose address expires in five minutes or less went from 21.27% to 28.67%, and among live (non-parked) sites from 23.00% to 36.38% — a rise that is flat until early 2025 and then adds seven points in the seventeen months from March 2025. Underneath that movement almost nothing individual is happening: 60.8% of the domains that survived the whole window publish the same value 40 months later, the one-hour TTL gained ground rather than losing it (25.92% → 27.12%), and two operators — GoDaddy's domaincontrol.com at 600 seconds and Cloudflare at 300 — choose the number for a third of all domains, with Cloudflare alone accounting for 47% of every domain in the five-minute club.
The Data
| Crawls (full A-record passes of the corpus) | 28 |
| Period | 2023-04-07 → 2026-08-15 |
| Result shards read | 67,690 |
| DNS records read | 43,643,919,012 |
| Apex A records (the analysed unit) | 6,908,808,702 |
| Resolving apexes, first pass → last pass | 172,656,455 → 311,533,913 |
| Registry-wildcard apex records removed | 8,797,205 (Apr 2023) → 25,104,262 (Aug 2026) |
| Private-suffix pseudo-apex records removed (EC2 hostnames) | ~1,600 (Apr 2023) → 14,796,264 (Aug 2026) |
| Analysed apex records, first pass → last pass | 165,542,567 → 283,095,103 |
| Distinct DNS operators in the operator join | 45,210 |
Each pass asks the full corpus for A records and keeps the answer for every name that is itself a registrable apex. Crawl windows run 9 to 42 hours (median hour of day 6–19 UTC), which matters because an observed TTL depends on how warm a resolver's cache was; the crawl-window profile shows no drift that tracks the trend. The corpus grew 1.8× over the window, so every number below is a share, and the composition of that growth is controlled explicitly.
Methodology
Unit of analysis. One record per bare registrable apex — example.com, not www.example.com and not mail.example.com — using the ICANN section of the Public Suffix List, the same convention as our hosting, parking and mail censuses. Russian-administered TLDs are excluded throughout, as domains and as operator labels.
What "the TTL" means here. For each answer we record the TTL of the first public A record in the answer section, and separately the smallest TTL anywhere in the chain — the second is what a client can actually cache when an apex is fronted by a CNAME (2.0% of apexes in 2026). Private, loopback and multicast addresses are dropped; a domain with no public A answer is not counted. TTLs above 2³¹−1, which RFC 2181 says a resolver must treat as zero, exist but are vanishing: 135 records in the 2023 pass.
The crawl asks recursive resolvers, so an observed TTL is the remaining TTL. A cached answer arrives short. Three facts bound the effect. First, 93.1% of observations in 2023 and 95.5% in 2026 sit exactly on a value an operator typed — a ladder of 108 "set" values this analysis derives from the data itself, by finding the TTLs that carry a mass spike their neighbours do not (which is how it catches Strato's 150 and the 8640/84600/86000 typo family, and a hand-written list would not). Second, the decayed residue is concentrated one second below its source — 3599 carries 2.6% of 3600's mass, 3598 carries 0.3% — which is consistent with a cache warmed moments earlier rather than a generally hot one; the crawl asks for both a domain and its www label, and a www CNAME onto the apex warms the apex's own A record for the query that follows. Third, the residue shrank over the window, so it biases the short-TTL trend downward, against the direction of the finding. Where it matters we report both the raw distribution (what a client receives) and the same distribution snapped up the ladder (an estimate of the authoritative value). On the headline share the two are identical to the second decimal — 21.27% → 28.67% either way, because a decayed observation cannot cross a threshold that sits exactly on a ladder value — and on the ≥1-day share they differ by at most 0.15 points.
Registry wildcards are removed, and they are not a footnote. Two synthetic estates bracket this record and push in opposite directions:
- In April 2023, Freenom's free TLDs —
.tk,.ml,.ga,.cf,.gq— contributed 6.9 million apexes, 81–96% of each TLD served from Cloudflare's network at TTL 300, with names to match (bracrosmorrdoglisag.tk,alapedthiomcal.tk,sieberbatsdowchesi.tk). That is one monetisation platform, not seven million caching decisions, and it sits on the short end. - In August 2026, the
.phregistry wildcard contributed 13.4 million, 98.7% on a single Linode address, 59.2% at TTL 86400. Verified live on 2026-09-04:zq7x4v9k2m8w.phreturns45.79.222.138with NOERROR, while the same label under.comreturns NXDOMAIN. It sits on the long end, and it entered the corpus between the June and July 2026 passes.
Both are excluded from every number in this post, in every snapshot, by a fixed TLD list (ph, ws, tk, ml, ga, cf, gq). A live probe of 40 major TLDs found only .ph and .ws wildcarding today; the Freenom family qualifies on its 2023 signature — more than 80% of a TLD's resolving apexes on one provider and more than 75% on one TTL. Dropping whole namespaces is the blunt version of the rule; removing only the estate itself, which keeps the real .ph and .tk registrations, moves every headline share here by less than 0.05 points.
Private-suffix pseudo-apexes are removed too — and the original version of this post missed them. The Public Suffix List's private section contains wildcard rules such as *.compute-1.amazonaws.com, under which every EC2 public hostname (ec2-54-144-66-65.compute-1.amazonaws.com) counts as its own "registrable domain". About 1,600 such names sat in each pass until November 2024; the December 2024 expansion of the crawler's name list brought in 14 million, and 14.8 million remain in August 2026. AWS publishes all of them at a one-day TTL (Google's resolver caps them at six hours). They are not domains anyone registered, and they are now excluded by the rule every figure here uses: a name counts only if it equals its ICANN-only registrable domain.
Leaving the wildcards in does not shade the result, it invents a trend. With them included (pseudo-apexes still excluded), the ≤5-minute share rises 3.25 points across the window (24.22% → 27.48%) and the ≥1-day share rises 2.28 points (3.14% → 5.43%). With them excluded, the ≤5-minute share rises 7.40 points and the ≥1-day share falls 0.39. One ccTLD's catch-all was hiding more than half of the real short-TTL movement while manufacturing a long-TTL rise that does not exist — the same thing the EC2 hostnames did to the original version of this post.
The resolver mix is controlled explicitly. Public resolvers distort what a crawl can see, and the crawl's own mix changed: Cloudflare-family resolvers answered 4.2% of analysed apex records in the first pass and 27.5% in the last. Google Public DNS caps cached TTLs at 21600 seconds and floors them at 30 — in our data its answers contain exactly zero records at or above 86400, in all 28 passes, across 3.06 million sampled answers, while OpenDNS's answers over the same window contain 5.2% and then 8.8%. We therefore keep an exact TTL histogram per resolver family and a bucket profile per resolver address. Within each family the trend is the same. Re-running both endpoint passes over the full corpus with the wildcard estates and pseudo-apexes dropped at extraction time gives, for the ≤5-minute share, 21.23% → 28.92% on answers from non-Cloudflare resolvers and 20.16% → 27.93% on Cloudflare-served ones — a 7.69 and a 7.76 point rise measured on two different instruments. Standardising to the 2023 resolver mix moves the short-TTL change by −0.25 points; for the ≥1-day share the mix adds +0.35 to a change of −0.41 points, so at a constant resolver mix the long end would have shrunk by three quarters of a point. (Figures recomputed September 2026.) The per-family series is published.
That same wildcard-excluded re-run is also the check on the 1-in-100 panel: over the whole corpus it puts the ≤5-minute share at 21.18% and 28.64% and the ≥1-day share at 3.29% and 2.89%, against the panel's 21.27%/28.67% and 3.27%/2.88% — agreement to within 0.09 points on 165.5 and 283.1 million apex records.
Composition is controlled with a fixed panel. Every pass also writes a stable 1-in-100 hash sample of apexes — the same names in every pass — which supports both a fixed panel and exact percentiles for any sub-population. On the unfiltered population the sample reproduces the full-corpus median exactly, the sub-300 share within 0.05 points and the ≥86400 share within 0.02 points. Two panels are used: 1,043,329 sampled apexes present at both endpoints (≈104M domains), and 583,563 present in all 28 passes.
Hosting provider ≠ DNS operator. Our provider labels classify the address a domain answers with. The TTL is set by whoever runs the zone. Where this post attributes a TTL to an operator it joins the apex to its nameservers from the July 2026 NS crawl behind Who Moves the World's DNS, matching 2,518,919 of 2,832,545 sampled apexes (88.9%). Operator history begins in April 2025; before that we can only speak about hosting.
Known limitations. The corpus records successful lookups only, so a domain absent from a pass may be dead, failing, or unqueried. TTLs are read from the child zone as a resolver saw it, so delegation-level (parent NS and glue) TTLs are out of scope — a real limitation, because Moura et al. showed that a minority of resolvers use the parent's values. The 1-in-100 panel carries a sampling error of roughly ±0.05 points on shares at this scale. Provider classification is by IP and inherits the accuracy of the published parking and migration series.
The Scorecard
| Statistic | April 2023 | August 2026 | Change (pt) |
|---|---|---|---|
| Share at exactly 300s (5 min) | 13.70% | 18.48% | +4.78 |
| Share at exactly 3600s (1 hour) | 25.92% | 27.12% | +1.20 |
| Share at exactly 14400s (4 hours) | 11.79% | 8.51% | −3.29 |
| 1 minute or less | 5.23% | 7.72% | +2.50 |
| 5 minutes or less | 21.27% | 28.67% | +7.40 |
| 1 hour or less | 74.39% | 81.40% | +7.01 |
| 1 day or more | 3.27% | 2.88% | −0.39 |
| 25th percentile | 600 | 300 | |
| 75th percentile | 7200 | 3600 | |
| 90th percentile | 14400 | 14400 |
The distribution slid toward the short end, and the long end came with it. The middle half of the distribution moved from 600–7200 seconds to 300–3600 — the 75th percentile halved — while the 90th percentile did not move. The one-hour TTL, the single most popular value on the Internet, gained 1.2 points. Every value above an hour lost share — two, three, four and six hours and a full day — with the four-hour default losing most and six hours more than half its mass; ten and fifteen minutes shrank too, while sixty seconds, five minutes, thirty minutes and the hour grew.
A note on the median, because it is the statistic this study cannot use. The web's TTL distribution is not a curve, it is a spike train: 25.9% of domains sat on exactly 3600 in 2023 and 27.1% do now, and the cumulative distribution crosses the halfway mark right at that spike. The median therefore flips between 1800 and 3600 when the share below an hour wobbles around 50% — it did so five times between October 2023 and April 2025 — and has sat at 1800 in every pass since, while the underlying distribution moved smoothly. Every trend claim here is a threshold share for that reason.
The series
| Crawl date | Analysed apexes | ≤ 5 min | ≥ 1 day | Live web ≤ 5 min | Set-value share |
|---|---|---|---|---|---|
| 2023-04-07 | 164,145,300 | 21.27% | 3.27% | 23.00% | 93.1% |
| 2023-10-10 | 180,293,500 | 22.93% | 3.41% | 25.29% | 93.2% |
| 2023-12-27 | 186,597,200 | 22.52% | 3.33% | 25.42% | 93.2% |
| 2024-02-14 | 181,069,100 | 22.45% | 3.40% | 25.41% | 93.2% |
| 2024-07-31 | 163,916,400 | 21.80% | 3.50% | 24.80% | 93.1% |
| 2024-09-02 | 162,924,000 | 21.76% | 3.34% | 24.82% | 93.1% |
| 2024-11-14 | 156,217,400 | 21.32% | 3.57% | 24.45% | 92.9% |
| 2024-12-21 | 188,484,300 | 21.53% | 3.46% | 23.94% | 92.6% |
| 2025-01-24 | 223,342,900 | 22.45% | 3.24% | 25.74% | 92.4% |
| 2025-02-27 | 233,257,700 | 23.25% | 3.17% | 26.87% | 92.6% |
| 2025-03-24 | 236,309,400 | 21.49% | 3.15% | 27.37% | 92.6% |
| 2025-04-29 | 244,300,100 | 21.90% | 3.07% | 27.96% | 92.7% |
| 2025-05-25 | 250,427,200 | 22.26% | 3.00% | 28.49% | 92.8% |
| 2025-06-24 | 253,200,600 | 22.47% | 3.00% | 28.81% | 92.6% |
| 2025-07-24 | 253,084,100 | 23.11% | 3.03% | 29.10% | 92.4% |
| 2025-08-25 | 255,776,100 | 23.11% | 2.96% | 29.52% | 92.7% |
| 2025-09-23 | 258,853,600 | 23.37% | 3.04% | 29.76% | 92.5% |
| 2025-10-24 | 261,180,500 | 24.00% | 3.14% | 30.61% | 92.9% |
| 2025-11-30 | 262,336,000 | 24.32% | 3.21% | 30.71% | 93.0% |
| 2025-12-15 | 263,496,800 | 24.50% | 3.18% | 30.93% | 92.9% |
| 2026-01-08 | 263,662,700 | 24.83% | 3.13% | 31.40% | 93.0% |
| 2026-02-06 | 264,189,900 | 24.99% | 3.06% | 31.58% | 93.1% |
| 2026-03-05 | 266,985,800 | 25.39% | 2.95% | 31.92% | 93.5% |
| 2026-04-17 | 270,621,400 | 25.92% | 3.06% | 32.48% | 95.4% |
| 2026-05-15 | 268,360,200 | 26.47% | 3.02% | 33.16% | 94.2% |
| 2026-06-13 | 274,176,300 | 27.40% | 2.90% | 34.18% | 94.5% |
| 2026-07-08 | 279,720,600 | 27.74% | 2.96% | 35.04% | 95.4% |
| 2026-08-15 | 283,254,500 | 28.67% | 2.88% | 36.38% | 95.5% |
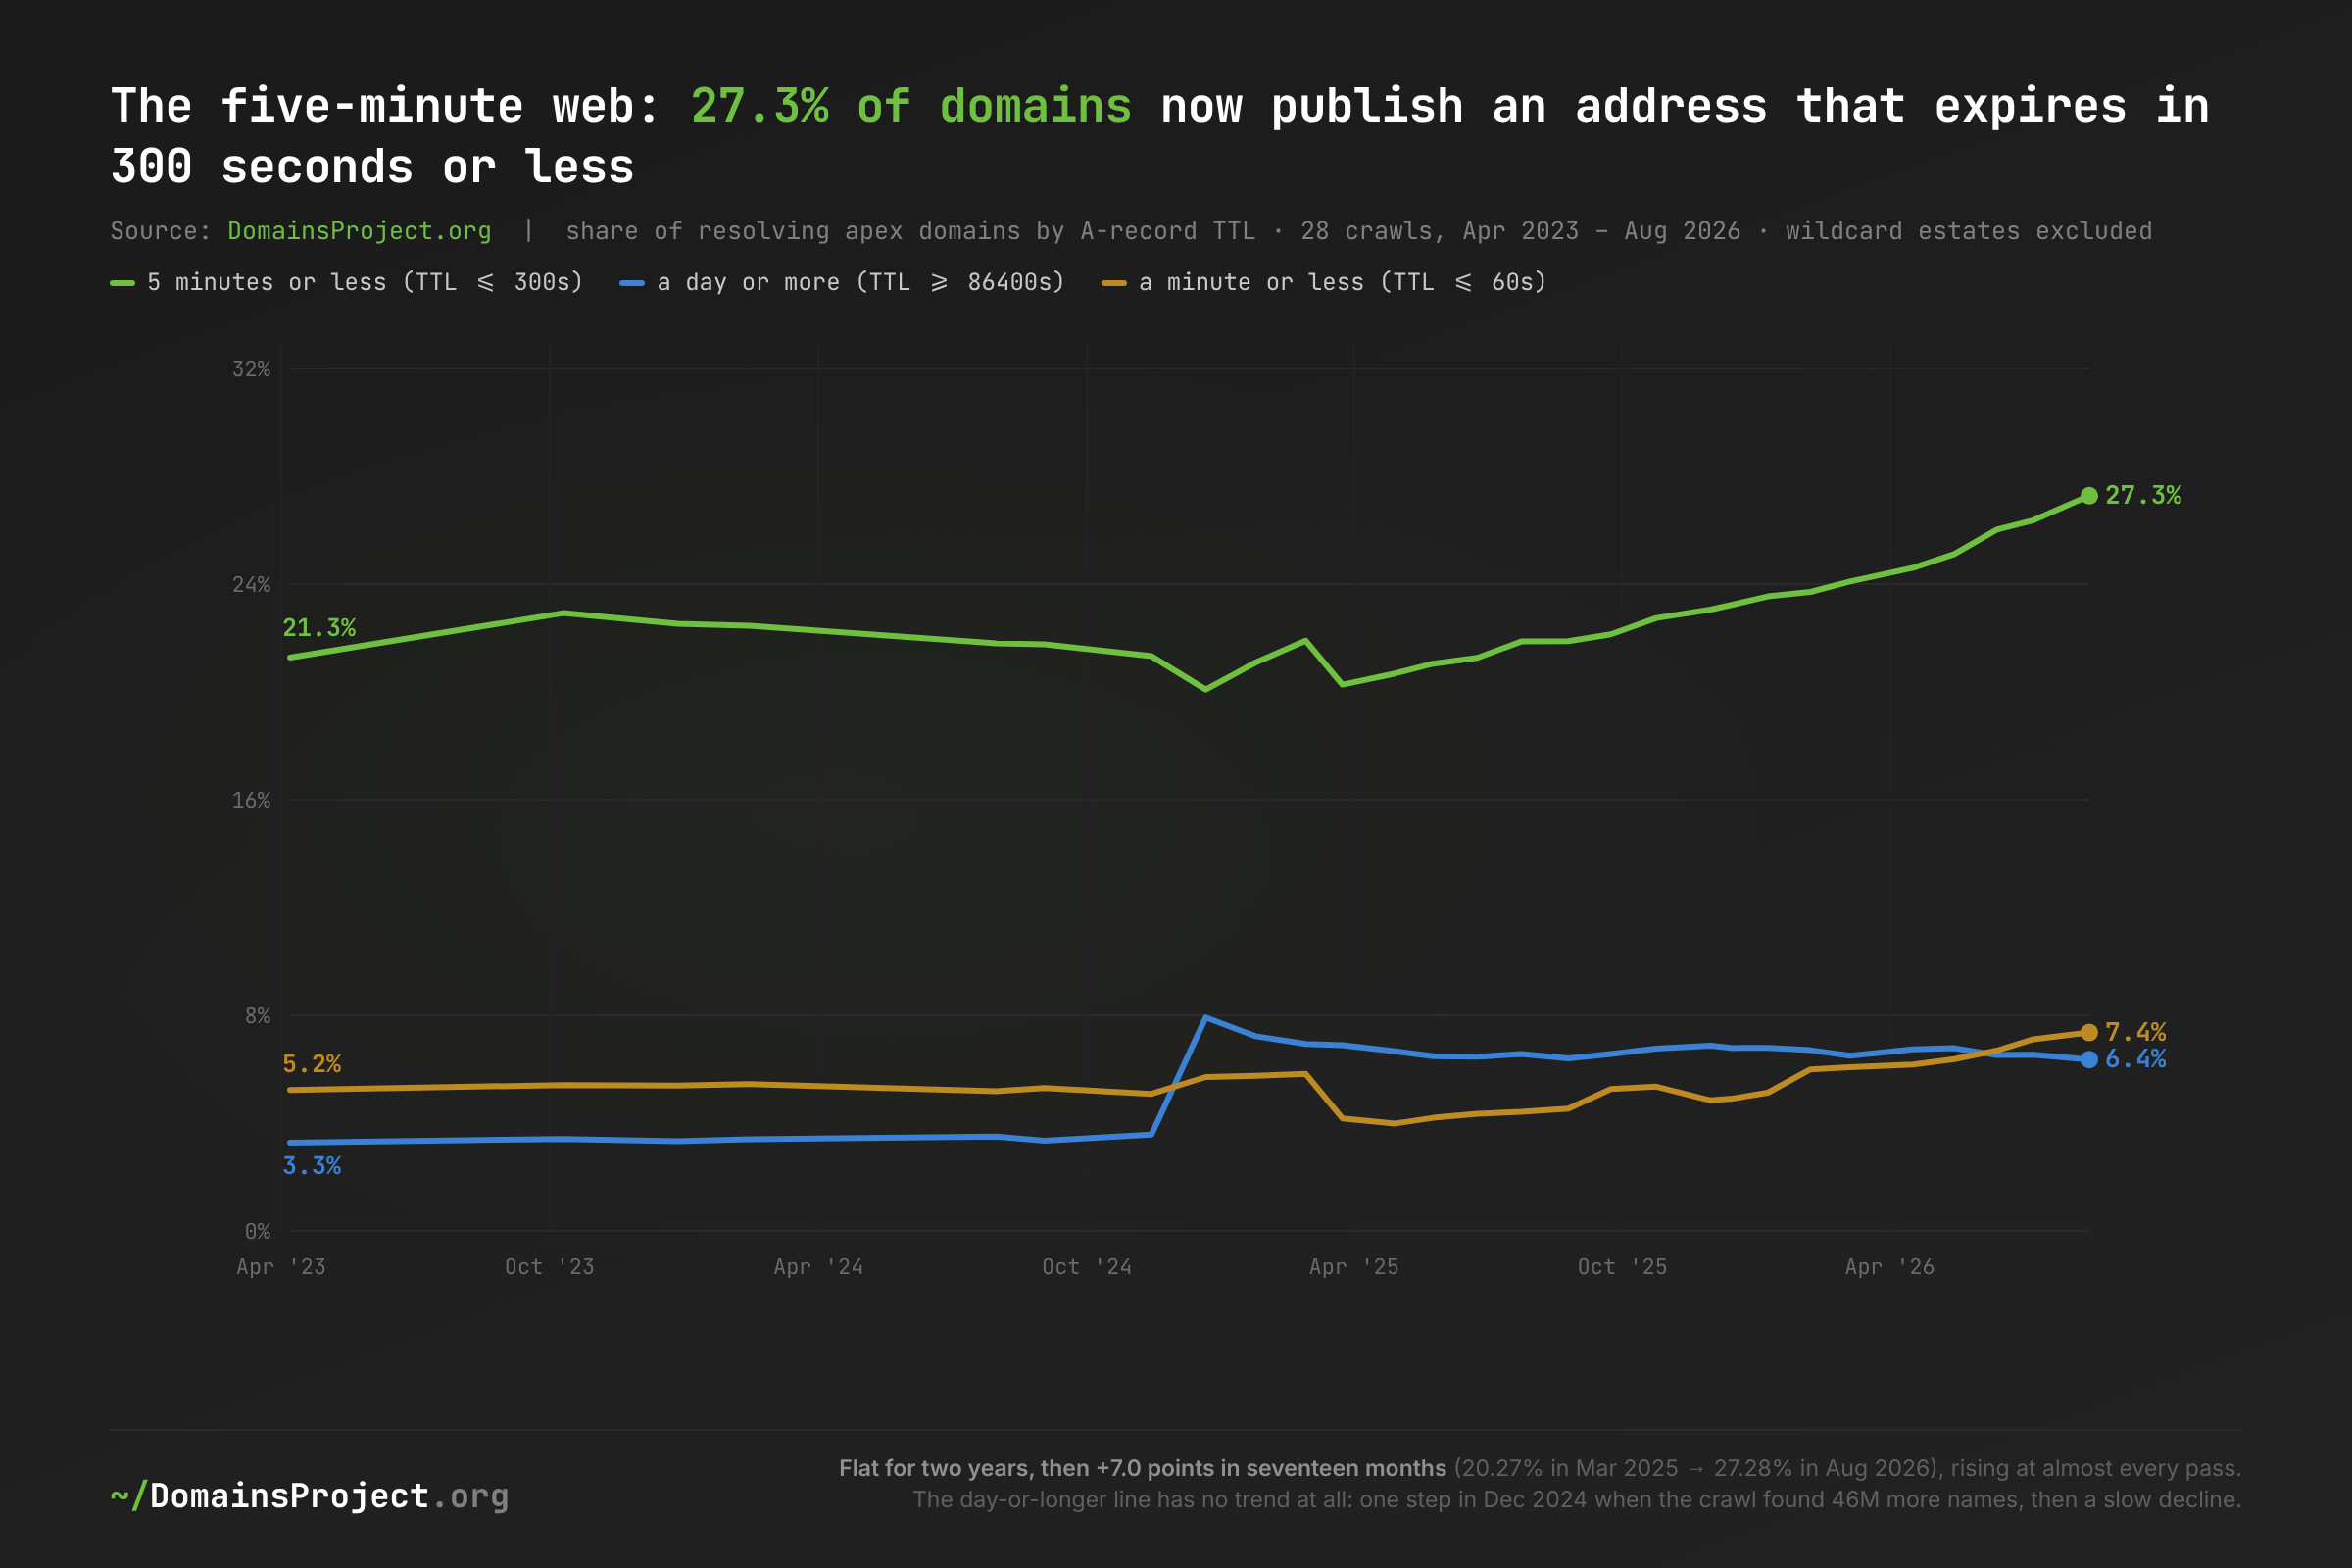
Download: ttl-thresholds.csv · shares are of analysed apexes (registry-wildcard estates and private-suffix pseudo-apexes excluded) in each pass.
The short end has one shape and the long end has another, and only one of them is a trend. The ≤5-minute line is flat within about two points for the first ten passes and then rises in almost every pass from March 2025 (21.49%) to August 2026 (28.67%) — seven points in seventeen months. The ≥1-day line does not rise at all: it sits at 3.3–3.6% from April 2023 to November 2024 and at 2.9–3.5% since, ending the record below where it started. In the original version of this post that line appeared to double in December 2024, and we attributed the step to registrar front doors on AWS Global Accelerator; it was in fact 14 million EC2 public hostnames — each published by AWS at a one-day TTL — entering the crawler's name list (see the correction above). On the fixed panel of surviving domains, the ≥1-day share moves +0.58 points across the whole window.
The Web Sets Four Numbers
| TTL | April 2023 | August 2026 | Change (pt) |
|---|---|---|---|
| 60s | 2.73% | 4.70% | +1.97 |
| 300s (5 min) | 13.70% | 18.48% | +4.78 |
| 600s (10 min) | 18.20% | 17.12% | −1.08 |
| 900s (15 min) | 1.83% | 1.52% | −0.31 |
| 1800s (30 min) | 2.93% | 4.00% | +1.07 |
| 3600s (1 hour) | 25.92% | 27.12% | +1.20 |
| 7200s (2 hours) | 3.13% | 2.05% | −1.08 |
| 10800s (3 hours) | 2.33% | 2.22% | −0.12 |
| 14400s (4 hours) | 11.79% | 8.51% | −3.29 |
| 21600s (6 hours) | 2.57% | 1.11% | −1.46 |
| 86400s (1 day) | 3.22% | 2.84% | −0.38 |
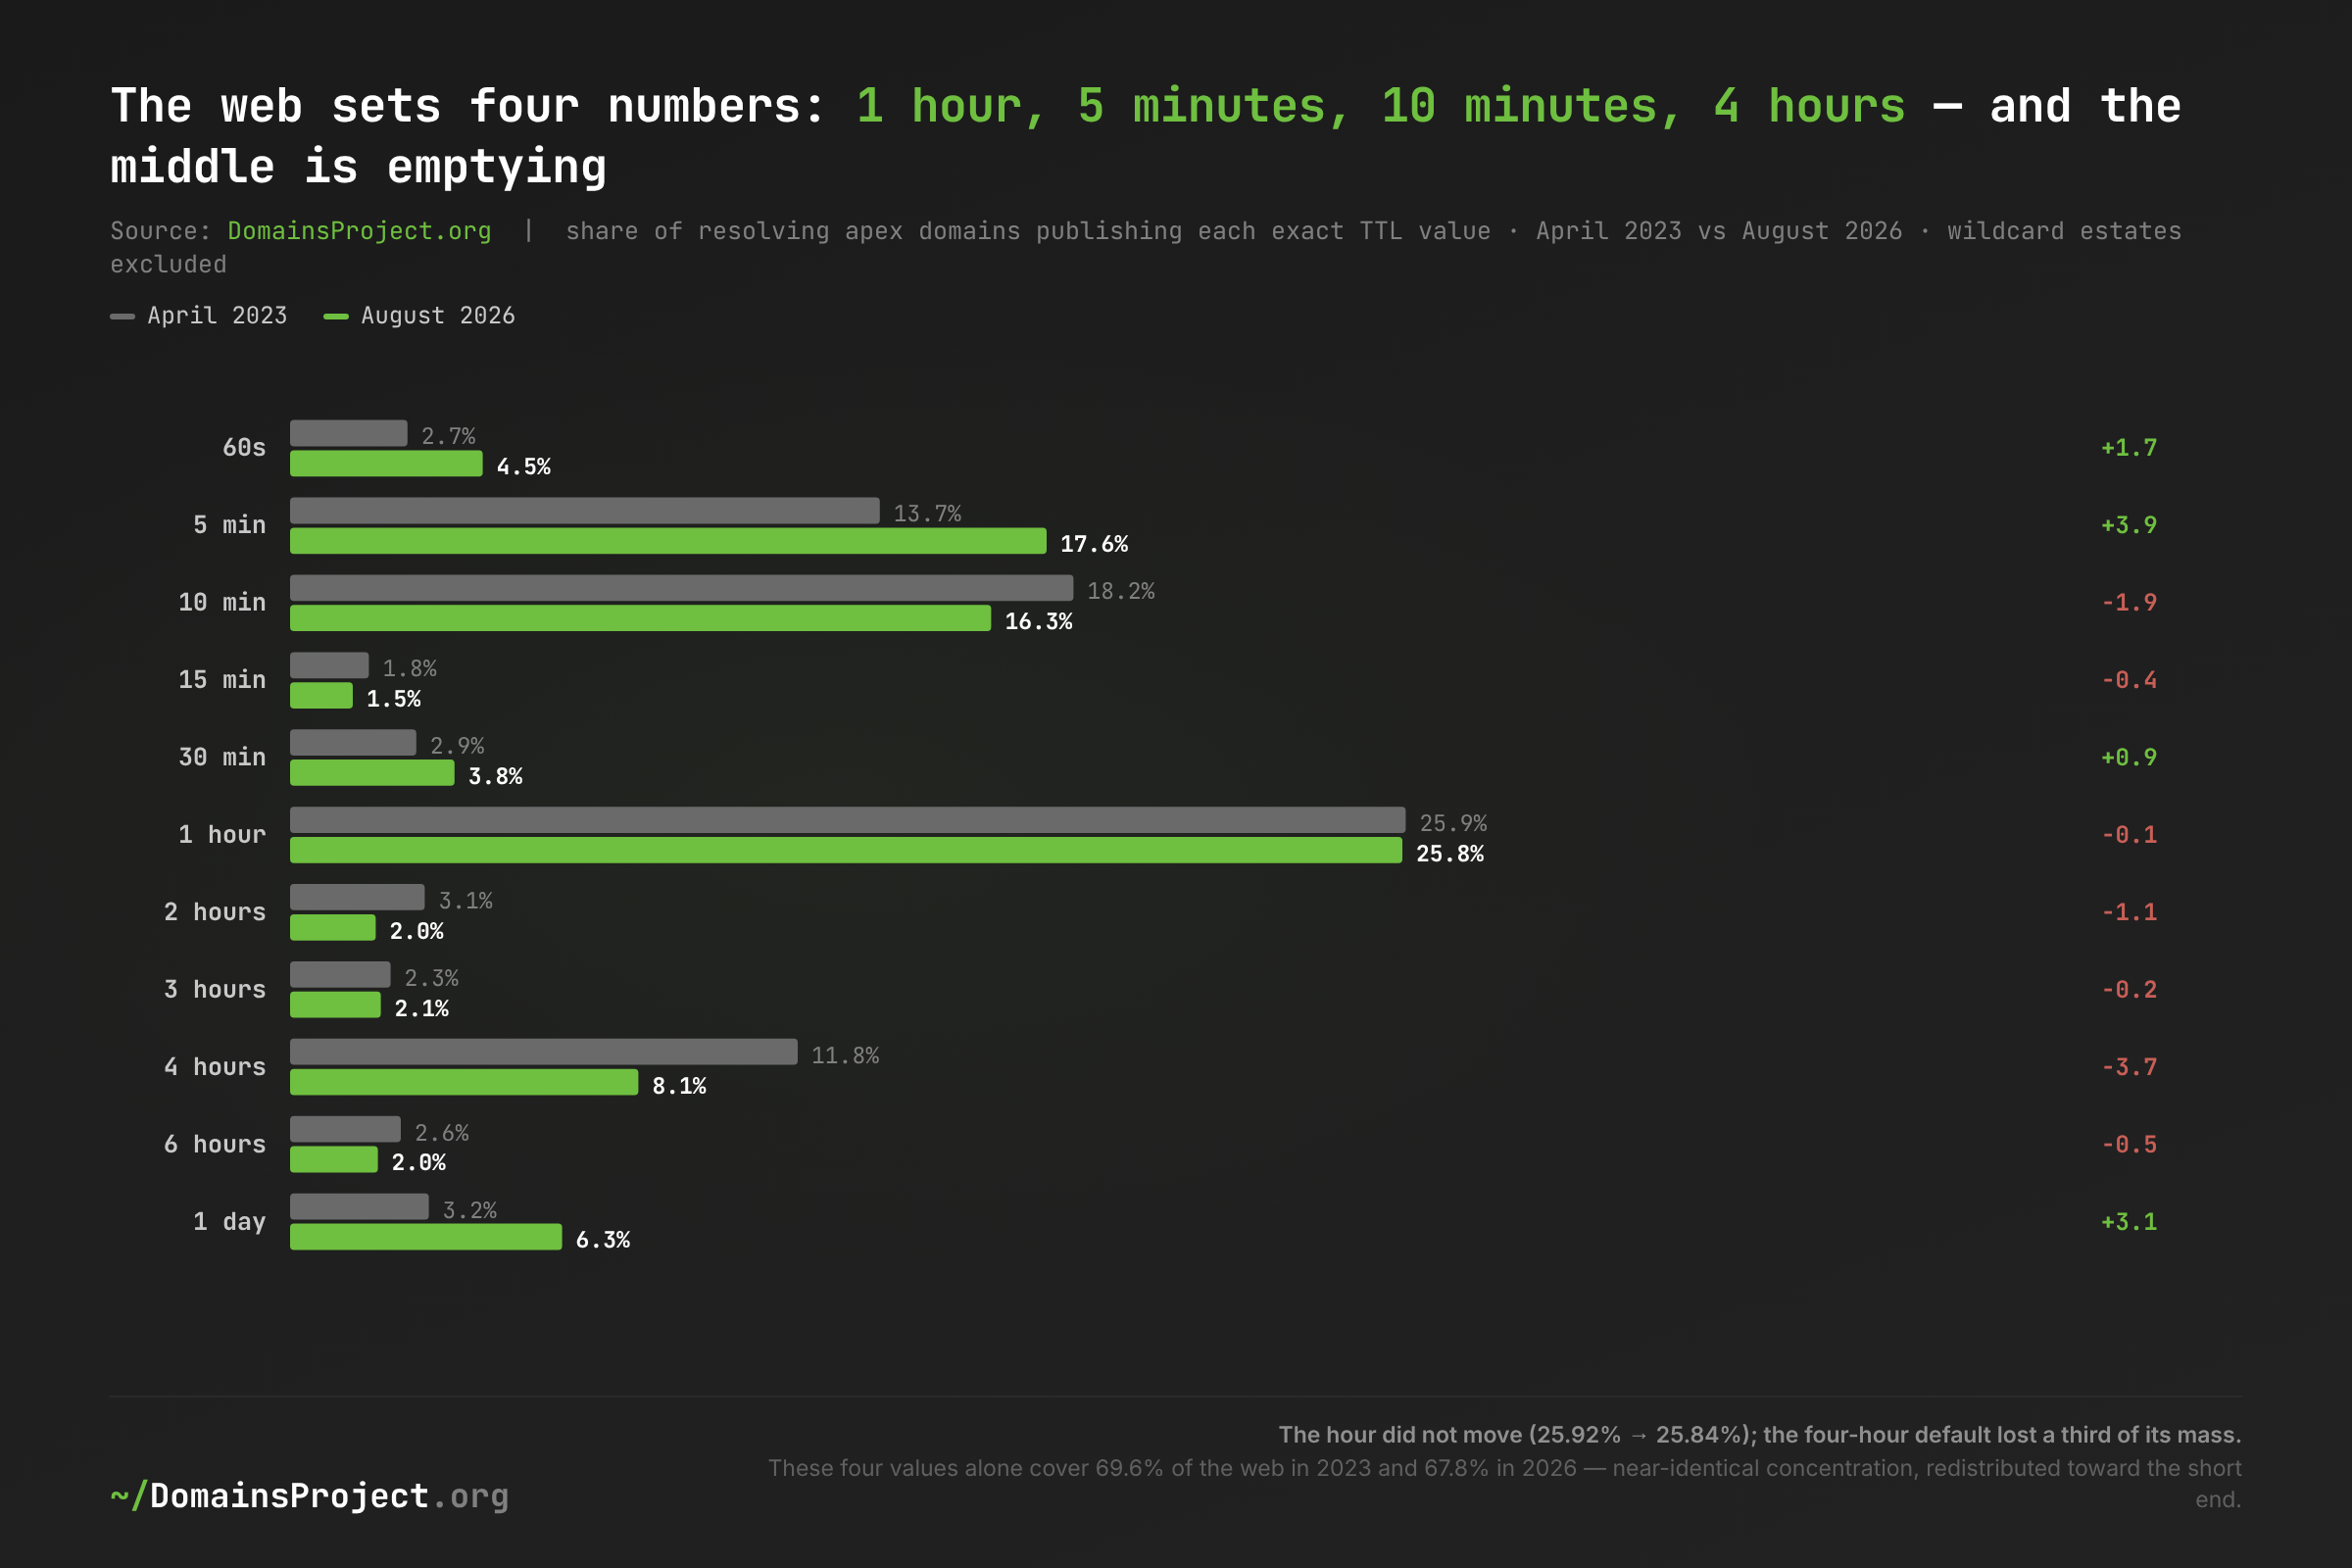
Download: ttl-values.csv · share of analysed apexes publishing each exact value.
Four values — one hour, five minutes, ten minutes, four hours — cover 69.6% of the web in 2023 and 71.2% in 2026. The concentration rose slightly; its composition changed more. Five minutes gained 4.78 points, sixty seconds 1.97 and the hour 1.20, while four hours lost 3.29, six hours 1.46 and ten minutes 1.08. The values that grew are the ones a platform assigns; the values that shrank are the ones a shared-hosting control panel used to ship with. That is the whole mechanism of this post in one table, and the next section names the platforms.
Who Actually Sets the Web's TTLs
A TTL looks like a per-domain decision. It is not. Joining every sampled apex to the operator of its nameservers turns the distribution into a much shorter list:
| DNS operator | Domains (share) | Mode TTL | Share on the mode | ≤ 300s | ≥ 86400s |
|---|---|---|---|---|---|
| domaincontrol.com (GoDaddy) | 20.03% | 600 | 60.3% | 1.3% | 0.3% |
| cloudflare.com | 13.62% | 300 | 89.3% | 96.0% | 0.1% |
| afternic.com (GoDaddy aftermarket) | 3.77% | 3600 | 90.8% | 5.4% | 0.0% |
| dns-parking.com (Hostinger) | 3.32% | 60 | 41.2% | 65.0% | 0.0% |
| googledomains.com (Squarespace) | 3.09% | 14400 | 66.4% | 4.3% | 13.2% |
| registrar-servers.com (Namecheap) | 2.75% | 1800 | 48.0% | 16.9% | 0.0% |
| wixdns.net | 2.58% | 3600 | 93.9% | 1.3% | 0.0% |
| ui-dns.* (IONOS) | 2.48% | 3600 | 90.3% | 5.7% | 0.1% |
| namebrightdns.com (HugeDomains) | 1.25% | 10800 | 91.6% | 1.3% | 0.0% |
| nsone.net (IBM NS1) | 1.17% | 14400 | 72.0% | 20.0% | 0.4% |
| ovh.net | 1.16% | 3600 | 76.7% | 4.9% | 10.0% |
| rzone.de (Strato) | 1.07% | 150 | 95.3% | 99.4% | 0.0% |
| awsdns.* (Route 53) | 0.92% | 60 | 51.9% | 85.5% | 1.5% |
| siteground.net | 0.56% | 86400 | 52.0% | 13.1% | 52.0% |
Shares are of the 2,518,919 sampled apexes with a matched DNS operator (88.9% of the analysed sample); 45,210 distinct operators appear in the join.
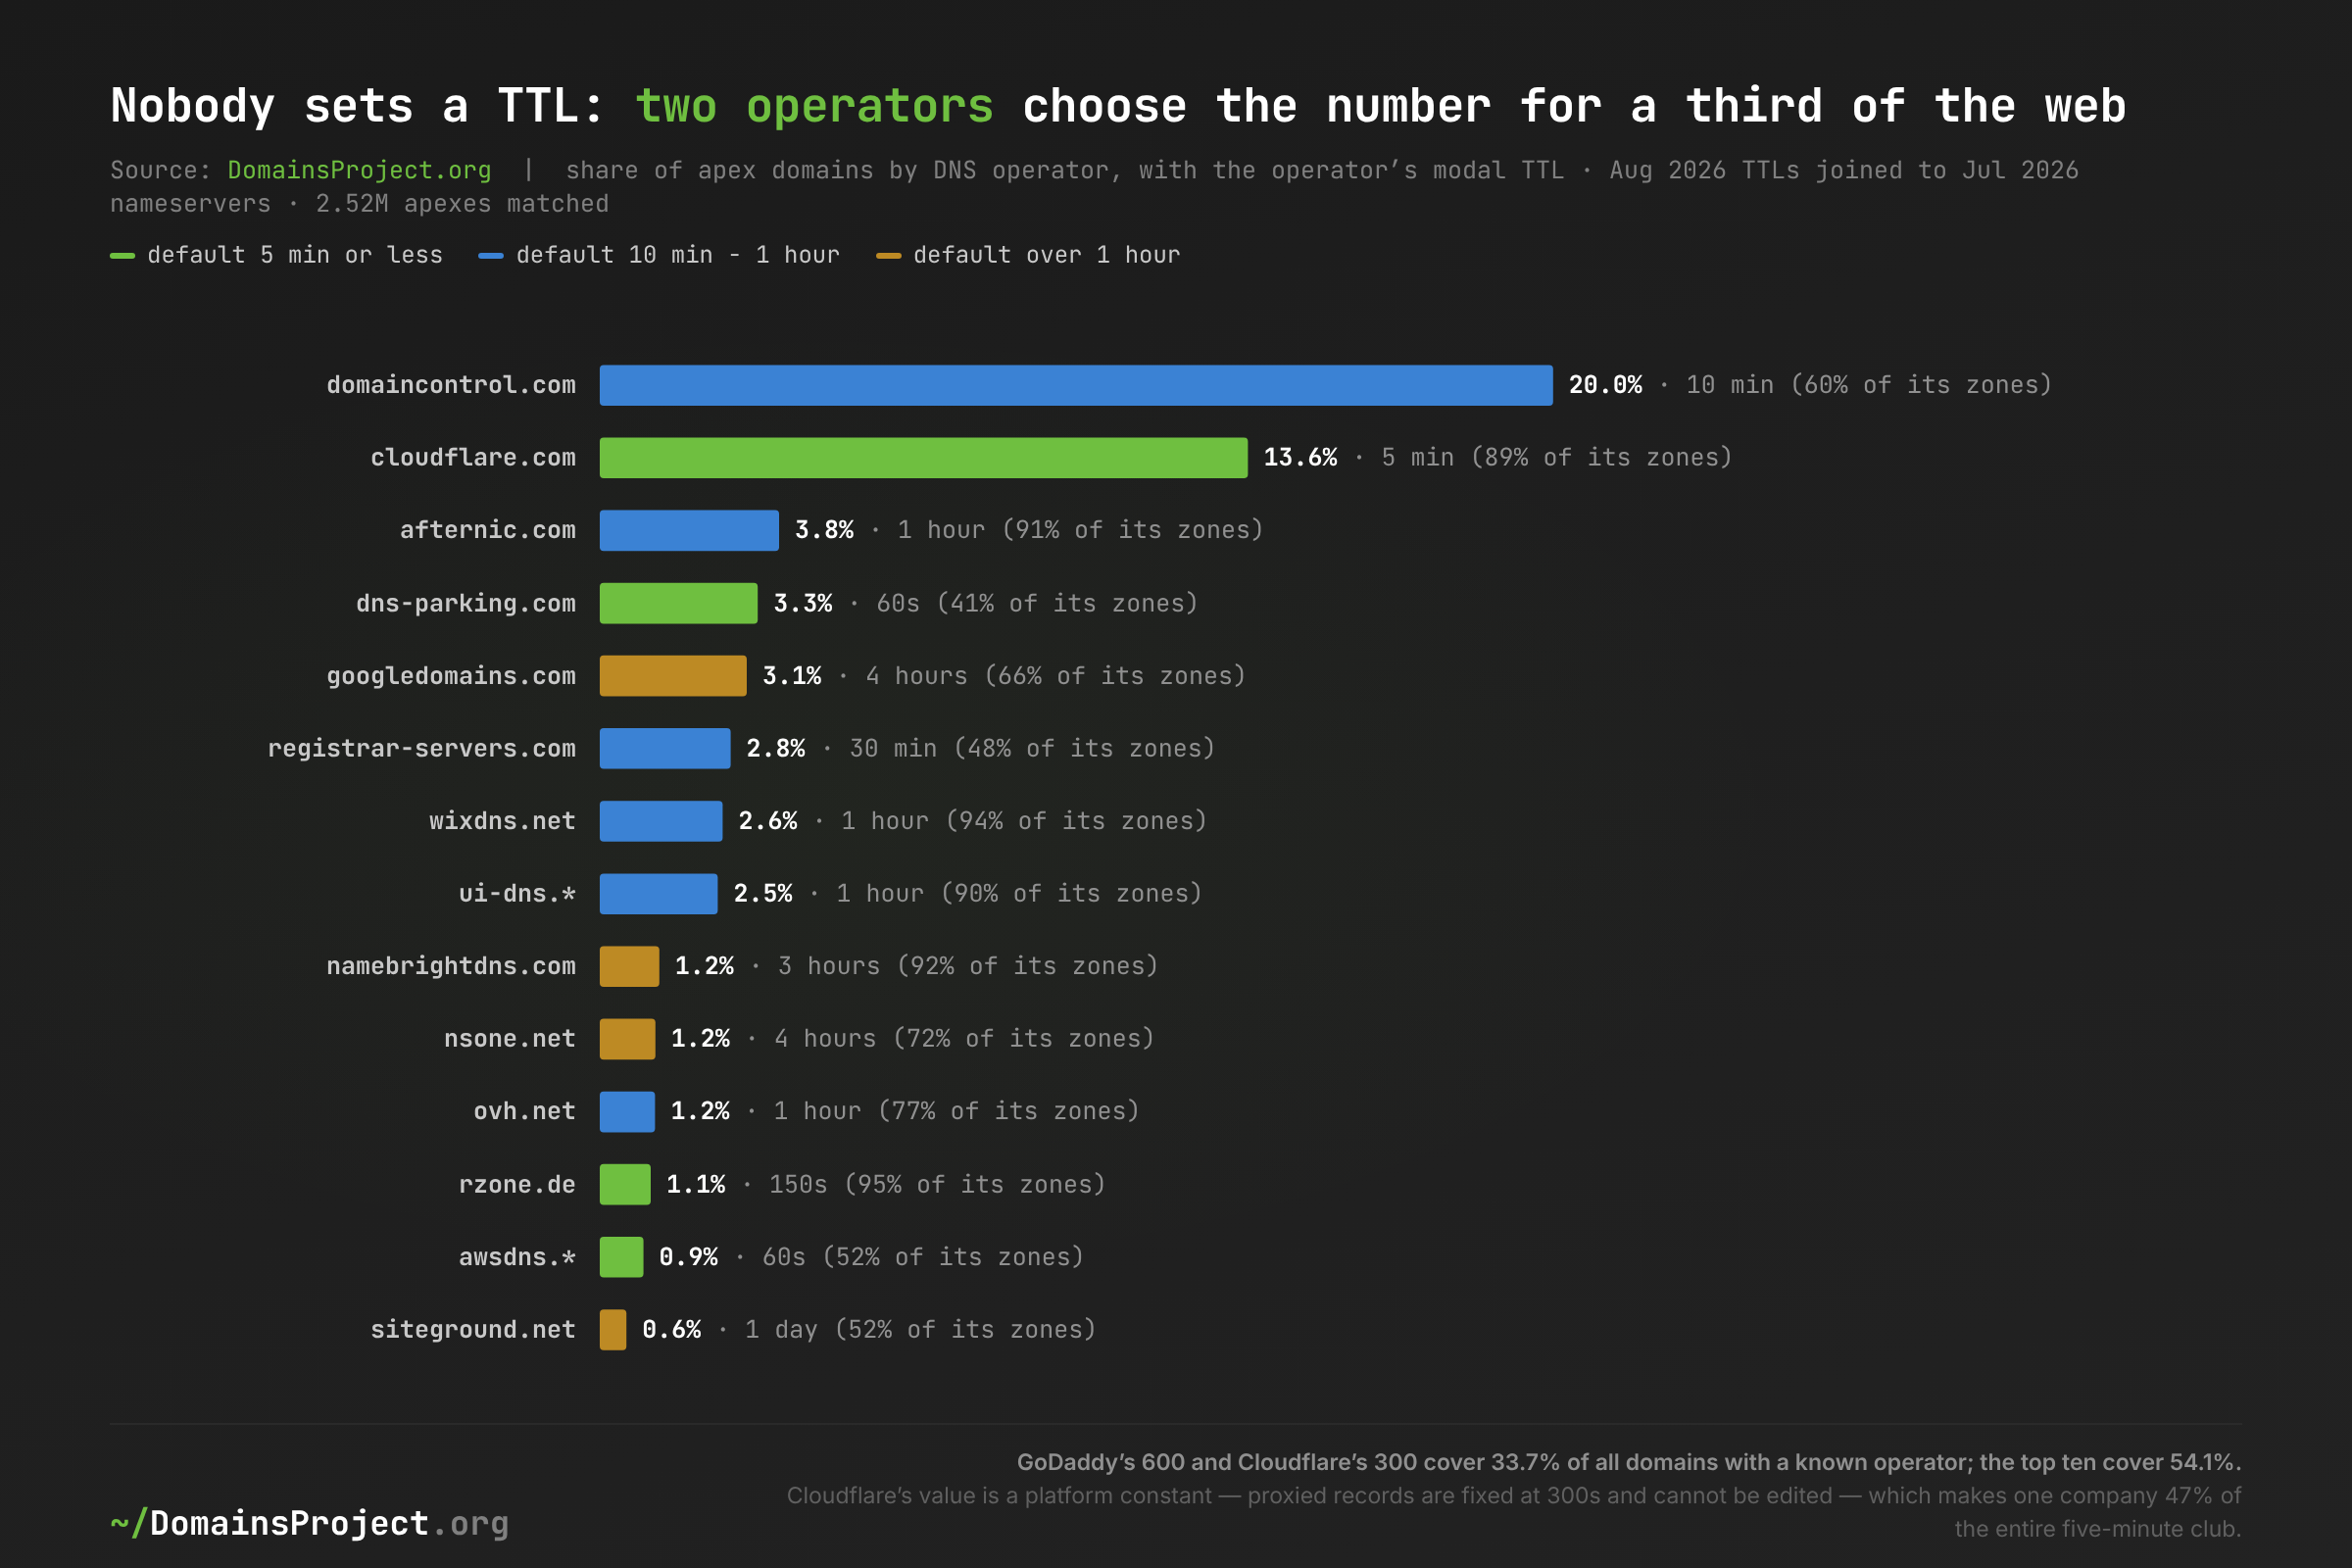
Download: ttl-operators.csv · Aug 2026 TTLs joined to Jul 2026 nameservers.
Two operators set the cache clock for a third of the web. GoDaddy's domaincontrol.com and Cloudflare together carry 33.7% of all domains with a known operator; the top ten carry 54.1%. The concentration is not only in share but in uniformity: 89.3% of Cloudflare-served domains publish exactly 300 and 93.9% of Wix-served domains publish exactly 3600, because in both cases the value is a platform constant rather than a setting. Cloudflare's is documented — proxied records have a fixed TTL of 300 seconds that cannot be edited — and it is, on its own, the single largest cause of short TTLs on the Internet: 47.0% of every domain at five minutes or less is a Cloudflare zone. The value Cloudflare's own migration guidance recommends temporarily, for the 24–48 hours around a cutover, is the value its platform applies permanently to one domain in eight.
GoDaddy's estate shows the same structure with two values instead of one: 60.3% at 600 and 33.1% at 3600 — 93.4% of five hundred thousand sampled zones on two numbers, the first being what a parked or default zone ships with and the second what the control panel writes when a customer creates a record.
The oddities in this table are load-bearing for millions of domains. Namecheap's registrar nameservers publish 1799 for 31.1% of their zones alongside 1800 for 48.0% — we queried both kinds against dns1.registrar-servers.com directly on 2026-09-04 and the authoritative answers really are one second apart, so this is a configured value, not cache decay, and it makes an off-by-one second the 13th most common TTL on the web. Strato's rzone.de publishes 150 for 95.3% of its zones, a value no other operator uses at scale and the reason 150 appears as a spike in the global histogram. Hostinger's dns-parking.com publishes 50 for 17.9% of its zones — verified authoritatively — a value below the floor most operators assume exists. julydns.com publishes 1. SiteGround is the only large operator whose modal setting is a full day.
Composition or Conversion: Who Changed?
Two things can move an aggregate distribution: domains changing their own TTL, or a different population arriving. Both happened, and they separate exactly, because every pass writes the same 1-in-100 sample of names. The panel below is the 1,043,329 sampled apexes present in both April 2023 and August 2026 — the same domains, asked the same question 40 months apart.
| TTL value | Panel 2023 | Panel 2026 | Change | All domains 2023 | All domains 2026 | Change |
|---|---|---|---|---|---|---|
| 60s | 2.58% | 3.67% | +1.09 | 2.73% | 4.70% | +1.97 |
| 300s (5 min) | 12.39% | 15.10% | +2.71 | 13.70% | 18.48% | +4.78 |
| 600s (10 min) | 16.94% | 14.13% | −2.81 | 18.20% | 17.12% | −1.08 |
| 1800s (30 min) | 2.79% | 3.01% | +0.22 | 2.93% | 4.00% | +1.07 |
| 3600s (1 hour) | 27.87% | 31.14% | +3.28 | 25.92% | 27.12% | +1.20 |
| 7200s (2 hours) | 3.41% | 2.66% | −0.75 | 3.13% | 2.05% | −1.08 |
| 14400s (4 hours) | 11.71% | 10.43% | −1.28 | 11.79% | 8.51% | −3.29 |
| 21600s (6 hours) | 2.78% | 1.61% | −1.17 | 2.57% | 1.11% | −1.46 |
| 86400s (1 day) | 3.47% | 4.04% | +0.58 | 3.22% | 2.84% | −0.38 |
Most domains never touch the number: 60.8% of the panel publishes the same set value 40 months later (57.5% publish a byte-identical TTL; the difference is one-second cache decay, snapped back). Among those that did change it, the traffic is close to balanced — 20.4% of the panel shortened, 18.8% lengthened.
But the two movements land in different places. In the panel, mass drains out of 600, 7200, 14400 and 21600 and piles into 300 and 3600: the surviving web is consolidating onto the two values its platforms publish, not spreading out. The population as a whole does something different — newcomers arrive at the short end (32.0% of domains new since 2023 sit at five minutes or less, and only 2.2% at a day or more), which is why the aggregate one-hour share rises less than the panel's (+1.20 against +3.28 points), and why the day-or-more share edges up among survivors (+0.58) while it falls in the population as a whole (−0.38).
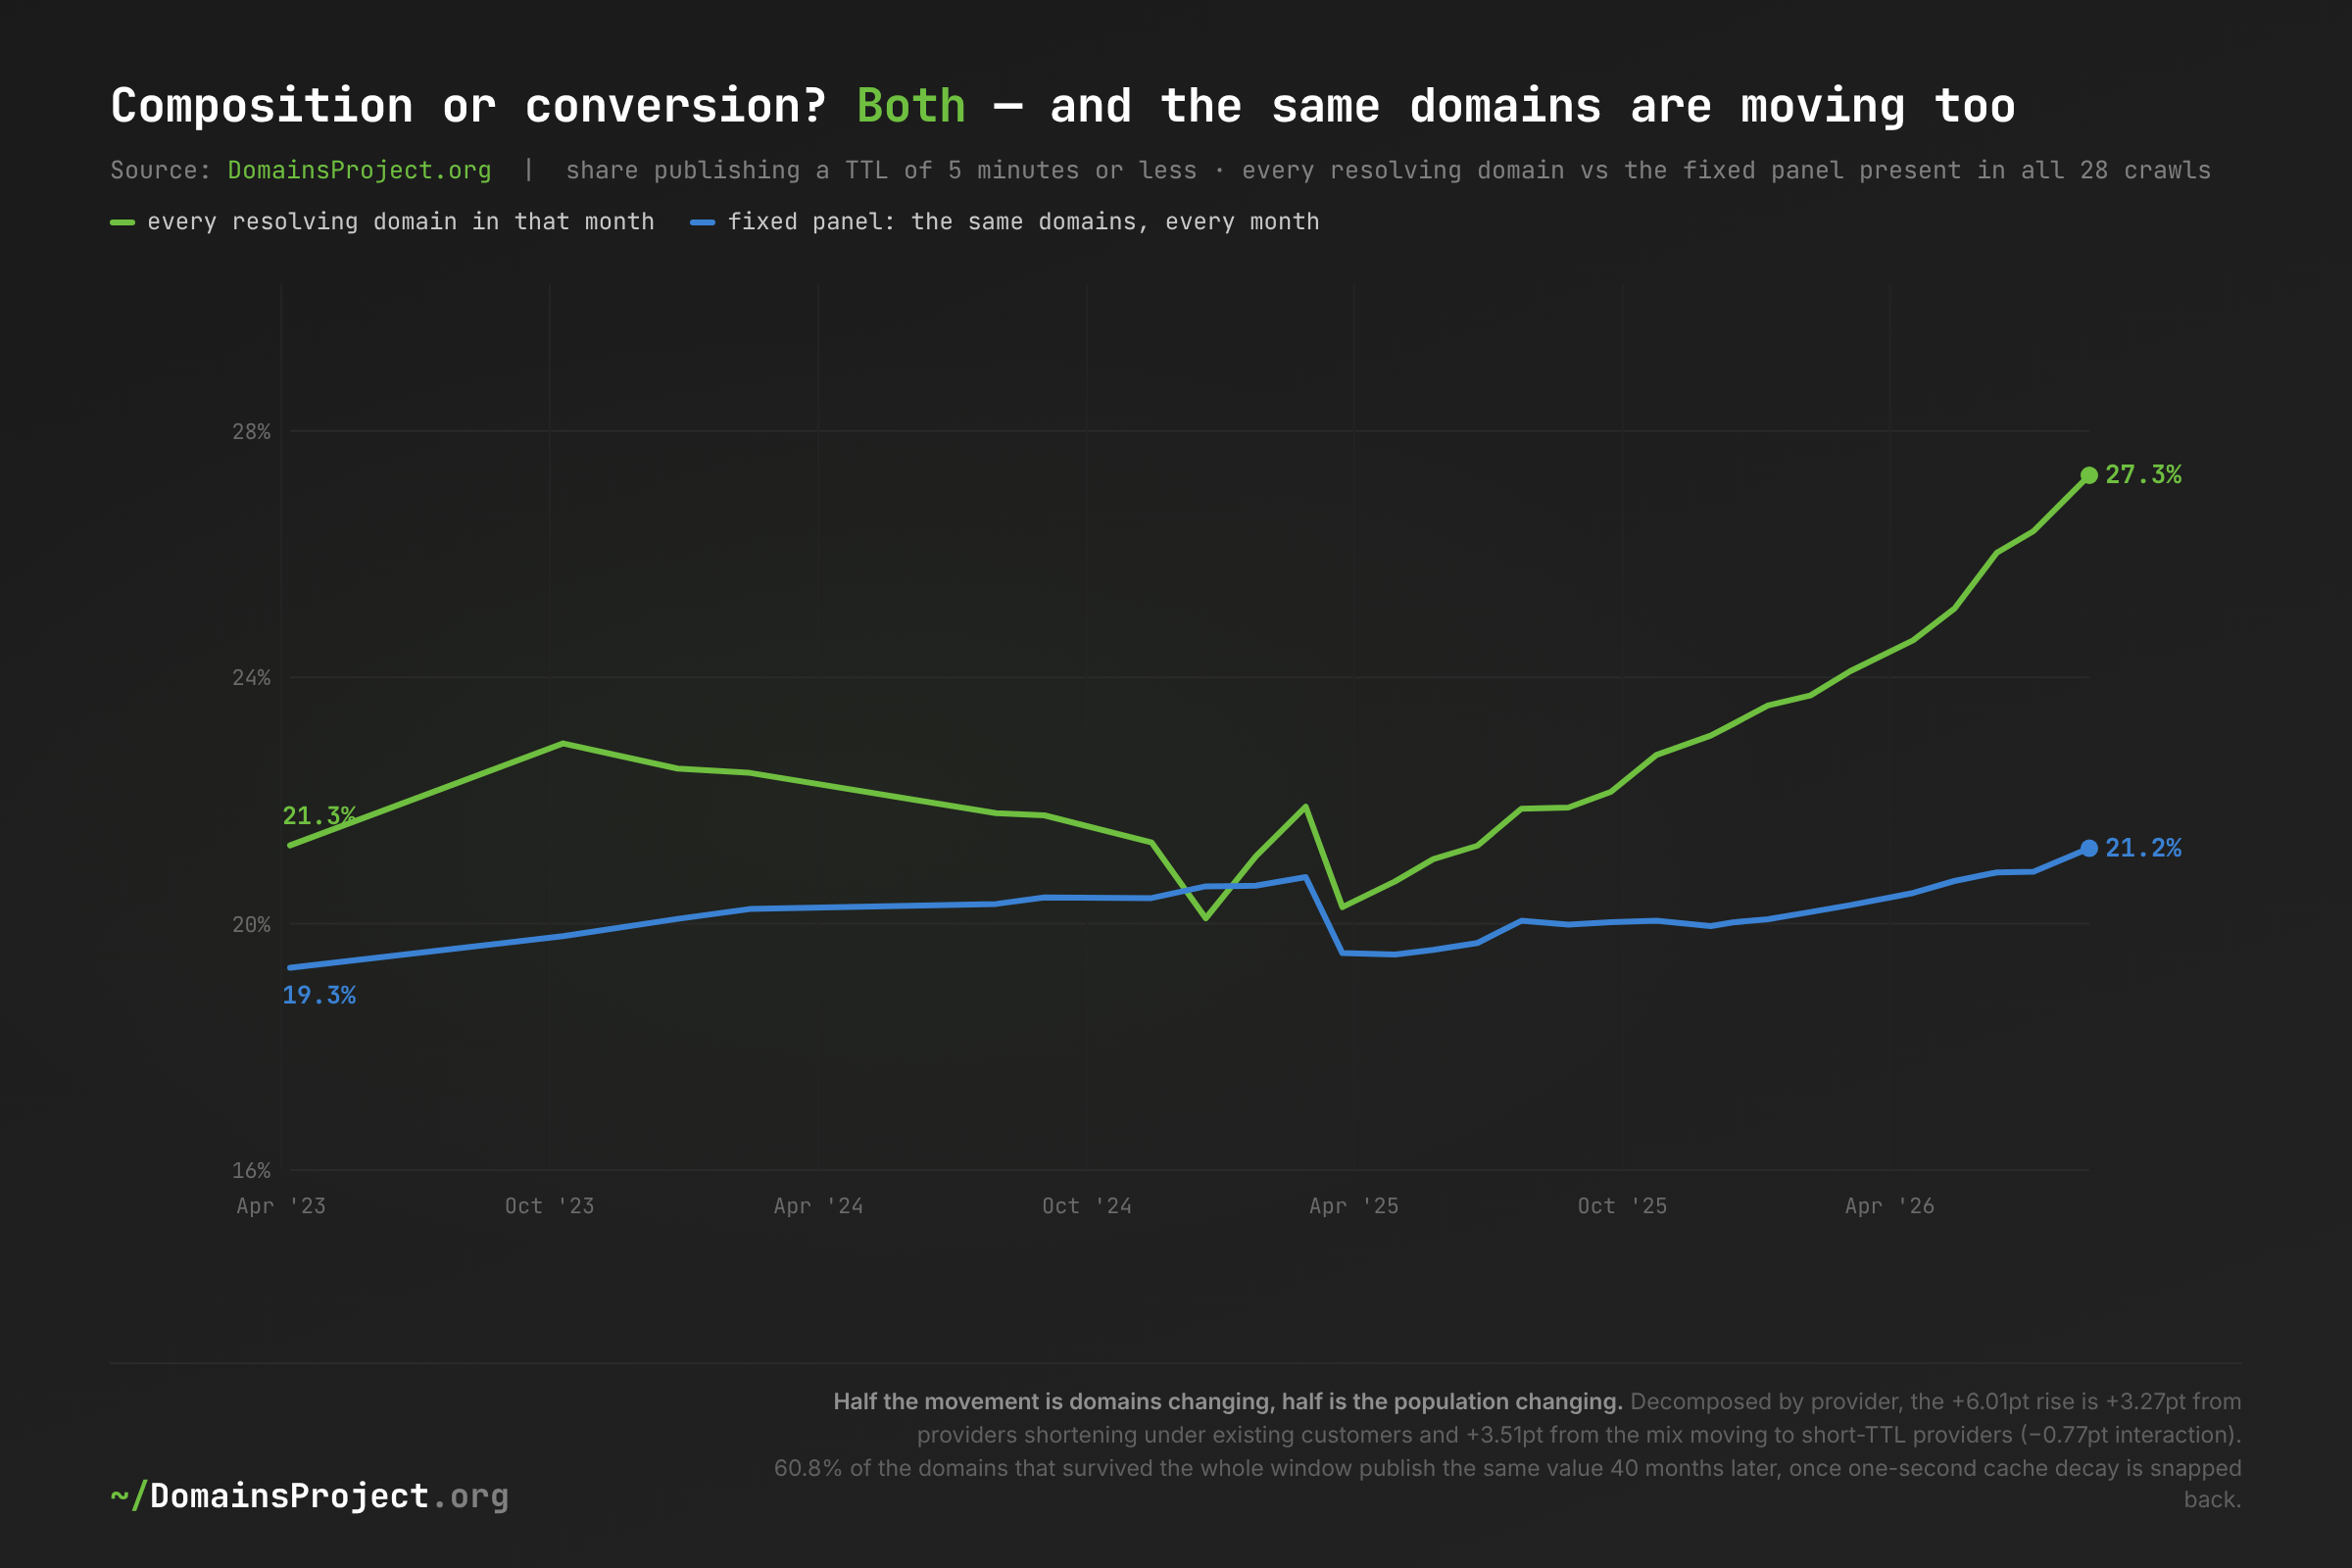
Download: ttl-panel.csv · panel = 583,563 sampled apexes present in all 28 passes.
Decomposing the +7.40-point rise in the ≤5-minute share by hosting provider gives two-thirds of it to the providers themselves: +4.79 points because providers' own populations got shorter (defaults changing under existing customers), +2.33 points because the mix moved toward short-TTL providers, +0.28 points of interaction. The largest single between-provider line is Cloudflare's growth — 8.51% → 15.02% of apexes at a 71–80% ≤300 rate, worth +4.64 points — and its acceleration dates from early 2025, which is when the aggregate line turns. (The original version of this post reported a large counter-movement at Amazon AWS, 47.2% → 20.6% at ≤300s; that was the EC2 hostnames entering the AWS population at a one-day TTL. Without them, AWS-hosted apexes held at 47–49%.)
A second cut, on nameservers rather than hosting, answers the question the provider decomposition cannot. For the 1,623,587 sampled apexes we can place with a DNS operator in both April 2025 and August 2026:
| Operator same | Operator changed | |
|---|---|---|
| TTL unchanged | 69.8% | 3.9% |
| TTL changed | 16.4% | 9.9% |
Of the domains whose TTL changed, 62.5% never left their DNS operator — the number moved while the provider stayed. The largest single flows are domaincontrol.com 600 → 3600 (1.3 million domains, the signature of a parked GoDaddy domain becoming a site) and its reverse at 3600 → 600, dns-parking.com 300 → 60 and 1800 → 60, dreamhost.com 300 → 60, and siteground.net and googledomains.com both moving 21600 → 86400. These are platform lifecycle events and platform policy changes, not administrators tuning caches.
The waiting room pulls the other way
Splitting the population with the tier definition from The Parking Lot shows the aggregate understates what is happening to the live web:
| Share of apexes | ≤ 5 min | ≥ 1 day | |
|---|---|---|---|
| Parked / front-door, Apr 2023 | 16.9% | 12.78% | 0.40% |
| Parked / front-door, Aug 2026 | 25.3% | 5.90% | 0.27% |
| Live web, Apr 2023 | 83.1% | 23.00% | 3.86% |
| Live web, Aug 2026 | 74.7% | 36.38% | 3.76% |
One in three live websites now resolves with a memory of five minutes or less, against fewer than one in four in 2023. Because the parked tier grew more than eight points while moving away from short TTLs, the headline number understates the live web's shift by about six points — +13.4 against +7.4. It also disposes of the obvious guess about the long tail: parked domains are almost never set to a day or more (0.27%), so the day-plus population is not parking operators economising on query volume — and among live sites the day-plus share was flat, 3.86% to 3.76%.
The namespaces move at different speeds
| TLD | Share of apexes | ≤ 5 min 2023 | ≤ 5 min 2026 | Change (pt) | ≥ 1 day 2026 |
|---|---|---|---|---|---|
| .com | 49.15% | 21.06% | 25.39% | +4.33 | 2.31% |
| .de | 4.44% | 30.06% | 24.52% | −5.54 | 11.24% |
| .org | 3.51% | 15.79% | 25.49% | +9.70 | 2.48% |
| .net | 3.45% | 17.79% | 24.48% | +6.69 | 2.79% |
| .uk | 2.54% | 16.27% | 21.38% | +5.11 | 4.11% |
| .xyz | 2.31% | 37.02% | 22.98% | −14.04 | 0.14% |
| .info | 1.21% | 17.24% | 38.18% | +20.94 | 2.40% |
| .br | 1.21% | 16.19% | 31.89% | +15.70 | 1.08% |
| .shop | 0.97% | 40.90% | 50.78% | +9.88 | 2.64% |
Two namespaces move against the tide, and both for structural reasons. .de is the long-TTL outlier of the major namespaces — 11.24% of German domains publish a day or more, against 2.88% of the web — and it is the one large TLD that got longer, because its domains sit disproportionately on German hosters whose defaults are long (rzone.de is the exception at 150; netcup.net, t-online.de and jimdo.com run 63–68% at a day or more). .xyz moved the other way for a different reason: it is the most heavily parked major namespace (67.6% of its domains answer from a GoDaddy front door), and those landers consolidated onto an hour — 64.9% of .xyz domains now publish exactly 3600, against 26.7% publishing 300 in 2023. Cheap generic namespaces where sites actually get built — .info, .br, .shop — show the largest moves toward five minutes.
What a Short TTL Costs — and What a Long One Costs
The only controlled measurement of the trade-off is still Moura, Heidemann, Schmidt and Hardaker's IMC 2019 experiment, which served the same names at different TTLs to RIPE Atlas probes worldwide:
| Effect | TTL 60s | TTL 86400s |
|---|---|---|
| Median RTT, unique query names | 49.28 ms | 9.68 ms |
| Median RTT, shared query names | 35.59 ms | 7.38 ms |
| 75th-percentile RTT, shared names | 106 ms | 24 ms |
Caching beat anycast in their experiment — a 24-hour TTL delivered a 7.38 ms median against 29.95 ms for an anycast service on short TTLs — which is why their recommendation is blunt: for general zone owners, at least one hour, and ideally 4, 8 or 24 hours, with 5–15 minutes reserved for DNS-based load balancing and DDoS mitigation. They measured the other side of the ledger too: when .nl halved the TTL on its nameservers' A records from 7200 to 3600 in 2016, two of its authoritative servers saw query traffic rise 22–30%.
Set our distribution against that recommendation and the gap widens from both directions. The 4-to-24-hour band the paper calls ideal fell from 15.40% to 10.23% of domains, and the share meeting even its one-hour minimum fell from 51.53% to 45.72%, while 28.67% now sit at or below the five-minute mark it reserves for domains that actively need failover agility. The four-hour setting is the single value that lost the most mass in this record.
The counterweight is not theoretical. In the ten months before our last pass, three incidents made the case for both directions at once:
- Namecheap, August 13–14, 2026. Authoritative DNS in the same Phoenix facility as the hosting; 30 hours 32 minutes end to end. Domains on
registrar-servers.comare 2.75% of all domains with a known operator here, and 79.1% of them had a 1799- or 1800-second memory. Longer TTLs would have carried a larger share of those sites through the first hours; nothing else available to the domain owner would have. - DENIC /
.de, May 5, 2026. Invalid RRSIG records made.defail DNSSEC validation and millions of sites became unreachable to validating resolvers until negative trust anchors were deployed..deis precisely the namespace whose domains carry the longest TTLs in our data, so an unusually large share of them stayed in cache while the zone was broken. - AWS
us-east-1, October 20, 2025. A DNS race condition in a DynamoDB endpoint cascaded across 141 services. Short TTLs are what let a control-plane DNS fault propagate at full speed — and what let the fix propagate at full speed once it landed.
That is the honest shape of the trade-off: a short TTL is a bet that you will need to move faster than your provider will fail. The web is placing more of that bet every month, and in most cases the bet is being placed by the registrar.
What's at Stake
- TTL is a platform setting, not a user decision. Two operators carry a third of all domains with a known DNS provider, the top ten carry 54.1%, on several of the largest platforms 89–96% of domains sit on a single value the platform chose, and on the largest of all, GoDaddy, 93.4% sit on just two. On the fixed panel, 60.8% of the domains that survived the whole window publish the same value 40 months later, and of those that changed it, 62.5% never left their operator. Any model of the DNS that assumes operators tune this number per domain — capacity planning, failover playbooks, threat models that expect a defender to "lower the TTL first" — is modelling a decision almost nobody makes.
- Your blast radius is set by your registrar's default. August's Namecheap outage put a number on it: 30 hours of authoritative downtime against a half-hour memory. The same arithmetic gives GoDaddy-served domains ten minutes of grace and Cloudflare-served domains five. Long TTLs are the cheapest outage insurance available, they cost nothing until you need to change something, and the web is moving away from them at the short end.
- Short TTLs are a bill someone else pays. Halving one TTL raised
.nl's authoritative query traffic 22–30%. The five-minute club in this census grew from 34.9 million to 81.2 million domains; the query load that creates lands on the authoritative operators who chose the defaults — the group best placed to absorb it and least likely to notice the externality. - The band the research recommends is the band that is emptying. The IMC 2019 recommendation is one hour minimum, four to twenty-four hours ideally. The 4-to-24-hour band fell from 15.40% to 10.23% of domains, and even the one-hour-or-more share slipped from 51.53% to 45.72%, while the five-minute end grew seven points. Guidance that has not changed in seven years is losing to defaults that changed twice.
- Registry wildcards make DNS censuses lie, and the effect is now large enough to flip results. One ccTLD answering for every possible label added 13.4 million synthetic "domains" to this corpus, all on one address, all at one TTL — enough to make the long end of the distribution appear to grow when it was shrinking. Private-suffix names do the same from the other side of the Public Suffix List: 14.8 million EC2 hostnames, all at a one-day TTL, reversed this post's own long-end finding until the September 2026 correction. Anyone measuring the DNS at scale, ourselves included, needs an explicit wildcard rule and an ICANN-only registrable-domain rule, re-verified per snapshot rather than assumed.
What Would Help
1. DNS operators: publish your default TTL, and announce it when you change it. Two providers in this record silently moved millions of domains: Hostinger's platform went from a four-hour default to one of sixty seconds (4.4% → 54.6% of its hosted domains at ≤300s, median 14400 → 120), and HugeDomains went the other way, from a 60-second default to three hours. Both are legitimate engineering choices; neither was announced, and every affected customer's failover behaviour changed without their knowledge. A dated line in a changelog would cost nothing.
2. Registries: stop wildcarding, or publish the wildcard. .ph answers for every label that could exist, so NXDOMAIN — the signal every abuse pipeline, certificate issuer and measurement study depends on — does not exist in that namespace, and its wildcard address alone accounts for 4.5% of the "resolving apexes" a full-Internet crawl now sees. .ws does the same at smaller scale. If a registry must monetise typos, publishing the wildcard address set would at least let everyone else subtract it.
3. Site owners: find out what your TTL is before you need it. For most domains it is whatever the registrar's control panel shipped with. Check it against the use you actually have: a site that never changes address wants an hour or more and gets faster resolution for it (49 ms → 10 ms median in the controlled experiment); a service that fails over between regions wants five minutes and should know it is paying for that agility in latency and in authoritative query volume. The one answer that is always wrong is "I don't know".
4. Public resolver operators: document your caps and floors. Google Public DNS's six-hour cap and 30-second floor are unmistakable in our data — its answers contain exactly zero records at or above a day, in all 28 passes — but neither its performance nor its ISP documentation states them, and a researcher who does not know will read a resolver policy as a property of the web. The same applies to every large recursive service; one line stating the cache bounds would remove a whole class of measurement error.
5. Researchers: control for wildcards, private-suffix names, resolver mix and cache decay, or expect to publish an artifact. Each of the four controls in this post moved a headline number, and two of them reversed a sign — one of them, the private-suffix rule, only in the corrected version of this post. The tooling is not exotic: a per-snapshot wildcard probe, a filter that keeps a name only if it equals its ICANN-only registrable domain, per-resolver-family histograms, and a data-derived ladder of "set" values that separates configured TTLs from decayed ones. The ladder, the wildcard rule, the per-family series and the full per-pass distributions are published below so the next measurement can start from them.
Methodology: 28 full A-record crawls of the DomainsProject corpus (April 7, 2023 – August 15, 2026; 67,690 result shards; 43,643,919,012 DNS records), reduced to one record per ICANN-registrable apex domain carrying the exact TTL of its first public A answer, the smallest TTL in its answer chain, its hosting classification under the published parking/migration classifier, and the resolver that served it — 6,908,808,702 apex A records in total. Registry-wildcard estates (ph, ws, tk, ml, ga, cf, gq), private-suffix pseudo-apexes (EC2 public hostnames; removed in the September 2026 correction) and Russian-administered TLDs are excluded from every figure. Changes in points are computed from unrounded shares, so they can differ by 0.01 from the difference of the rounded figures shown. Composition is controlled with a stable 1-in-100 apex hash panel; cache decay with a data-derived 108-value "set TTL" ladder; resolver policy with per-family exact histograms. DNS operator attribution joins the July 2026 NS crawl. Full data: series, threshold shares, exact values, DNS operators, hosting providers, TLD panel, parked vs live, resolver families, fixed panel, crawl windows. Explore the dataset at domainsproject.org/dataset and the live numbers at /stats.