Every story about where the Internet is hosted is a story about movement. The web is said to be de-Americanizing as Europe builds sovereign clouds; consolidating into a handful of hyperscalers; tilting toward anycast edges that make geography obsolete. These narratives are usually drawn from a single snapshot and a directional guess. We have something better: 26 monthly censuses of where the world's domains actually resolve, A-record and geoIP, stretching from April 2023 to June 2026 — the longest apex-level hosting time series we know of at three-billion-name scale, and the first genuinely longitudinal post in this series, every prior one having been a single point in time.
The conventional measurements all weight by traffic. W3Techs, BuiltWith and the CDN market-share trackers answer "what do the busy sites use," which is the right question for a marketer and the wrong one for a census. They tell you Cloudflare fronts a quarter of the web and the big three clouds own the market. They cannot tell you where the other web lives — the hundred-million-domain long tail of small businesses, parked names, side projects and abandoned blogs that never appear in a top-ten-million ranking but make up the overwhelming majority of registered reality. That web gets exactly one vote per domain here, the same vote a Fortune 500 homepage gets, and it turns out to behave very differently from the one in the rankings.
We measured it the way a census should be measured: each registrable apex counts once, regardless of how many subdomains or addresses it answers with, classified by the geoIP country of its primary A record and by the published IP ranges of the major hosting providers. We ran the identical pass over all 26 snapshots, normalized for a corpus that grew 2.6× over the period, and excluded Russian-administered TLDs throughout. The full method, and the two passes we had to drop for missing geoIP, are in the Methodology.
The headline is an absence of motion. The United States hosted 45.9% of the world's resolving apex domains in April 2023 and 45.2% in June 2026 — flat across 38 months, never leaving a 44–51% band. Germany, Canada, France and the rest of the geographic distribution are equally stable. The de-Americanization of hosting, measured one domain at a time rather than one answer at a time, did not happen. Two things did move, and neither is the one the narratives predict: the share of domains whose location is un-geolocatable — anycast networks, principally Cloudflare — more than doubled from 3.8% to 9.3%, and a single provider, Amazon, tripled its footprint from 5.3% to 15.9% of all resolving apexes even as its share of cloud revenue slipped. Where the web lives barely changed; what changed is how much of it now answers from an address that refuses to say where it is.
The Data
The series is built from DomainsProject's monthly A-record-plus-geoIP crawls of the full hostname corpus. Each snapshot resolves the master name list and records, per answer, the IPv4 address and its geoIP country. We reduce every snapshot to the registrable apex under ICANN public-suffix rules and count each apex once.
| Property | Value |
|---|---|
| Snapshots | 26 monthly passes, Apr 2023 → Jun 2026 |
| With usable geoIP | 24 (two 2024 passes lacked geoIP enrichment; excluded from geography) |
| Resolving apexes per snapshot | 29M – 74M (a 1-in-12 shard sample; see Methodology) |
| Corpus growth over period | 1,206 → 3,170 archive shards (~2.6×) |
| Dimensions measured | geoIP country · hosting provider (by IP range) · TLD |
| Granularity | registrable apex, one domain one vote |
| Excluded | Russian-administered TLDs, per project policy |
The denominator is the resolving apex: a registered domain that, somewhere under its name, returned at least one IPv4 address with a NOERROR status in that month's crawl. A domain that does not resolve has no location to record and is not counted. Because the corpus itself grew over the three years, every figure in this post is a share, never an absolute count — comparing raw apex totals across years would measure our crawler's reach, not the web's.
Methodology
A study that claims the map didn't move needs its measurement pinned down even more carefully than one claiming it did, because stability is exactly what a sloppy metric manufactures or destroys by accident. Three decisions do all the work.
One domain, one vote. Each registrable apex contributes a single observation: the IP and geoIP country of the first A record we observe for it in that snapshot, deduplicated so that a domain with a thousand subdomains counts the same as a domain with one. This is the pivotal choice, and the next section shows what happens without it. The alternative — counting every A answer — lets a single domain with tens of thousands of resolving subdomains stuff the ballot box, and the ballot box it stuffs is whichever country and provider that one domain happens to sit in.
Anycast is its own category, not a missing value. A large and growing share of apexes resolve to an IP whose geoIP country is empty. This is not a data gap; it is a finding. Anycast networks — Cloudflare above all, with some Fastly and AWS Global Accelerator — announce the same address block simultaneously from dozens of cities, so "which country" has no answer by construction. We report this un-geolocated / anycast bucket as a first-class series rather than dropping it, because its growth is one of the two real movements in the data.
Provider by published IP range. We classify each apex's primary A-record IP against the published address ranges of the major hosts: authoritative range files for Cloudflare, AWS, Google and Fastly, and curated aggregates for Microsoft/Azure, Hetzner, OVH, DigitalOcean, Akamai and Linode. Anything unmatched falls into a long-tail bucket — the regional ISPs, shared-hosting resellers and registrar default farms too small or too numerous to enumerate. We define Big-6 cloud & CDN as AWS + Cloudflare + Google + Microsoft + Akamai + Fastly.
Known limitations. Stated plainly:
- Sampling. Each snapshot is processed at a uniform 1-in-12 shard stride. The shards are content-ordered (gTLDs first, ccTLDs alphabetically last), so we sample by stride across the whole range, never a contiguous slice; at 29–74 million apexes per snapshot, country and provider shares are stable to well under a tenth of a point, though the smallest TLD tails are noisier.
- Fixed provider ranges. We classify all 26 snapshots with provider IP ranges as of June 2026. Because providers' ranges only grow, a 2023 IP that belongs to AWS today was almost certainly AWS then; the risk is reassigned blocks, which is small. The practical effect is that historical cloud footprints are a floor — unpublished or since-reassigned ranges land in the long tail — and the trend is measured with one constant rule, so it is internally consistent even where the absolute level is conservative.
- geoIP drift. The geoIP database itself is updated over time, so a sliver of country attribution moves for reasons unrelated to hosting. The anycast-bucket growth is corroborated independently by the CIDR-based Cloudflare series, which rises in step, so it is not a geoIP artifact.
- Two passes without geoIP. The September and November 2024 crawls returned empty country fields for every record; they are excluded from all geography figures and retained only for provider and TLD series, which are IP- and name-based.
- Sparse early years; dense recent ones. The 2023–2024 passes are fewer and reflect a smaller, evolving corpus. Geography is stable enough to read across the whole span, but per-TLD trend claims are confined to the dense monthly window, Jan 2025 → Jun 2026, and the 2023 points are treated as directional anchors, not precise levels.
- First hop, and resolution is not life. We see the address a name resolves to, not the origin behind a proxy — Cloudflare's CNAME flattening hides true origins — and "resolves" is not "serves a live site." Both caveats are explored in companion posts.
Dataset vs. external counts. Our one-vote lens deliberately disagrees with the traffic-weighted trackers, and the disagreements are the point, so we label every denominator. Our US share is ~45% of resolving apexes; external hosting-market and data-center tallies put the US near half of global web-hosting capacity and the largest national data-center footprint by a wide margin — the same order of magnitude, a different unit. Our Cloudflare is ~8% of apexes by visible IPv4; W3Techs measures it at 23.3% of all sites and our own IPv6 census found it supplying 44.7% of IPv6-bearing domains. Three numbers, three denominators, none wrong. Where our figures and a tracker's diverge, it is because we are counting domains and they are counting traffic.
Reproducibility. A Go per-apex emitter (stride-sampled xz reader, ICANN public-suffix reduction, IP-range classifier) writes per-snapshot country/provider/TLD histograms; a Python pass assembles the series and shares. It is the same two-stage design as the published MX, TXT and DNS censuses. Benchmark your own apexes against the dataset.
The Scorecard: A Geography That Holds Still
Here is the geographic distribution at the two ends of the series and across its middle. Every value is the share of that month's resolving apexes — the second row excepted, which restates the US figure as a share of geo-located apexes only (anycast removed from the denominator).
| Region | Apr 2023 | Dec 2024 | Dec 2025 | Jun 2026 | Net |
|---|---|---|---|---|---|
| United States | 45.9% | 46.2% | 44.9% | 45.2% | −0.7 |
| United States (of geo-located only) | 47.7% | 48.8% | 48.6% | 49.8% | +2.1 |
| Germany | 10.5% | 10.5% | 14.0% | 12.5% | +2.0 |
| Canada | 4.6% | 3.0% | 5.9% | 5.4% | +0.8 |
| France | 2.5% | 3.3% | 2.7% | 2.4% | −0.1 |
| United Kingdom | 3.5% | 2.9% | 1.8% | 2.0% | −1.5 |
| Netherlands | 3.7% | 2.9% | 2.2% | 2.1% | −1.6 |
| Anycast / un-geolocated | 3.8% | 5.4% | 7.7% | 9.3% | +5.5 |
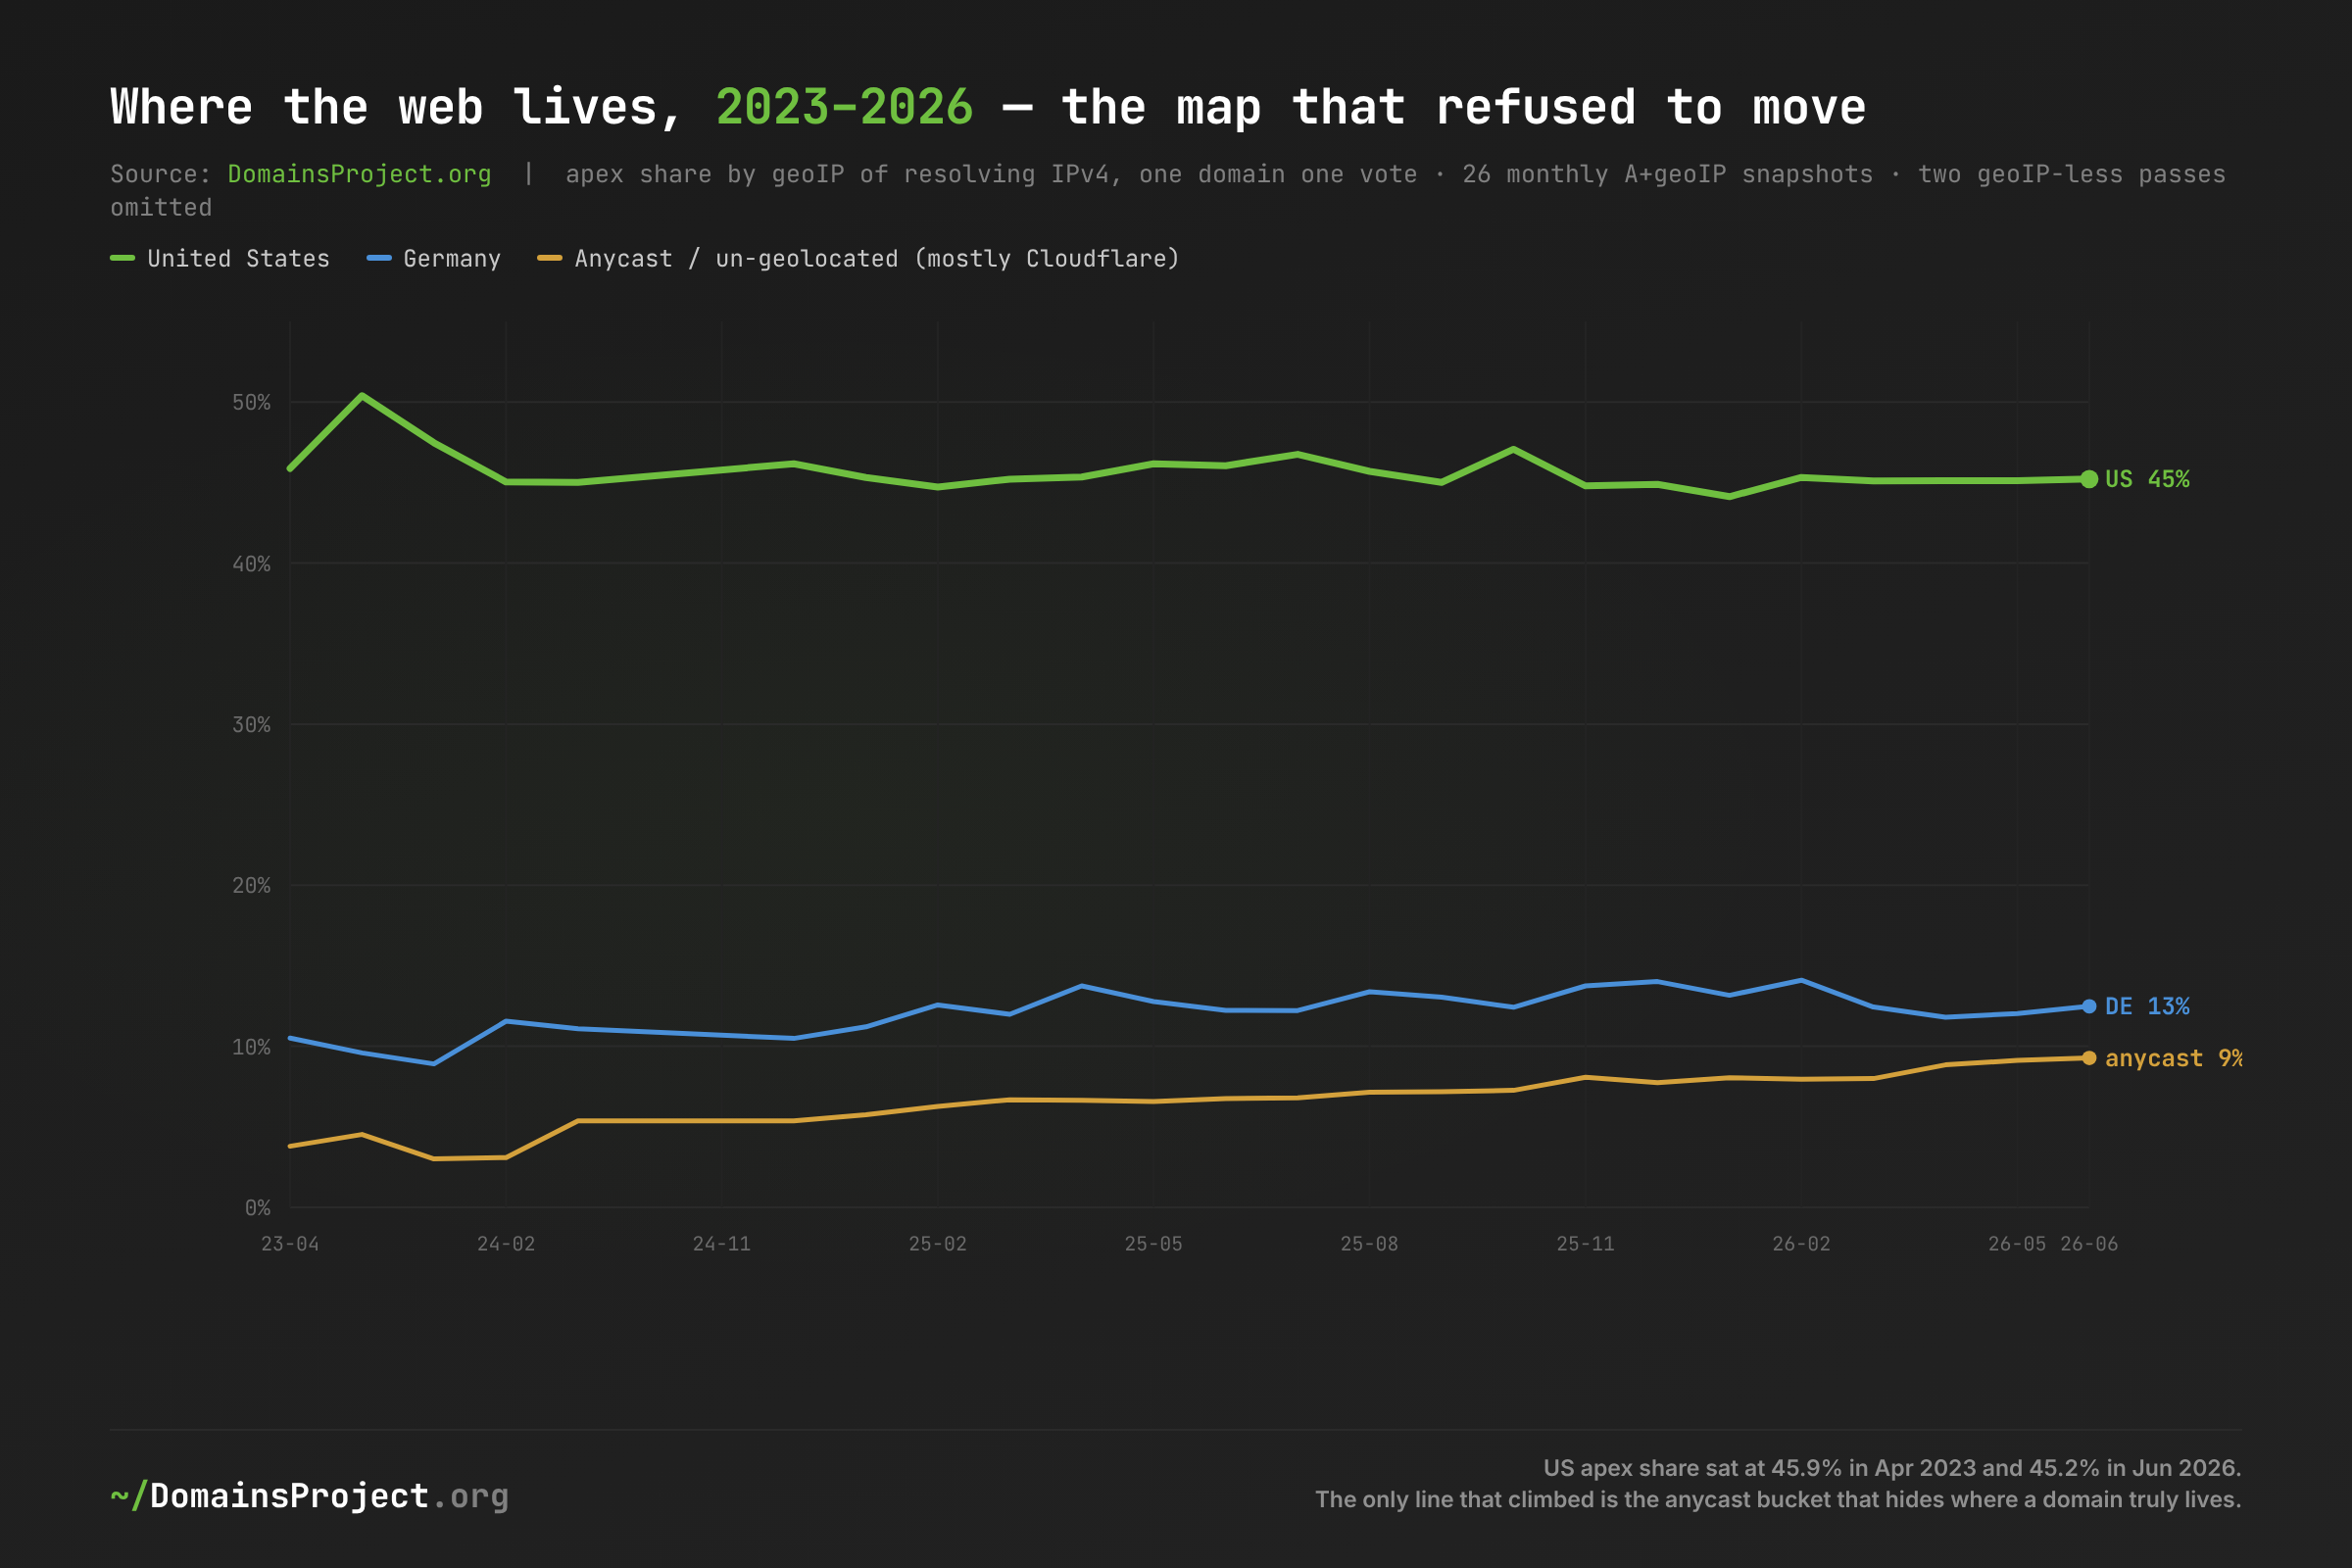
The United States line is the flattest thing in the dataset. Across 24 monthly snapshots it never leaves the 44.1–50.4% band and averages 45.7%, beginning at 45.9% and ending at 45.2%. Measured against only the domains that can be geo-located — stripping out the anycast bucket — the US share even edges up, from 47.7% to 49.8%. There is no de-Americanization here in any sense the data can support; if anything, among domains that report a country, the US is marginally more dominant in 2026 than in 2023. Data → inference: the share of registered domains resolving to US soil did not fall. Implication: narratives of a hosting power shift are describing either the traffic-weighted top of the market, where cloud-region choices do move, or a movement that exists in cloud-revenue league tables but not in the per-domain map of the Internet.
The only geographic line that climbs is the one that has no geography. The un-geolocated bucket — anycast addresses that cannot be assigned a country — rose from 3.8% to 9.3%, a 2.4× increase and the single largest geographic change in the series. This is not a country gaining share; it is the concept of a hosting country eroding at the edges as more domains hide behind anycast front-ends. Germany (+2.0 points, consistent with its dense Hetzner/IONOS base) and Canada (+0.8) drifted up modestly; the UK and Netherlands drifted down by similar amounts. Against the anycast bucket's +5.5, all of these are noise. The web did not move from America to Europe. A slice of it moved from somewhere to nowhere.
The Subdomain Mirage: Why "Share of Answers" Lies
Before going further, it is worth showing why the one-domain-one-vote rule is not a stylistic preference but the difference between a true reading and a false one — because the obvious shortcut produces a completely different, and wrong, story.
The shortcut is to count every resolving answer — every A record, across every subdomain — and tally the countries. It is faster, it needs no deduplication, and it is what a quick probe of this very dataset reported before the full pass was run. Here is what it claims, next to the apex truth.
| US share, by measurement unit | Apr 2023 | May 2026 |
|---|---|---|
| Apex-level (one domain one vote) | 45.9% | 45.1% |
| Answer-level (every A record counts) | 38.3% | 48.6% |
The answer-level metric invents a ten-point US surge that did not happen, and its 2023 reading is pure artifact. In the April 2023 answer-level tally, the United States comes second at 38.3%, behind a phantom field led by the United Kingdom at 9.1%, France at 8.4%, Taiwan at 6.1% and Italy at 5.1% — none of which command anything close to those shares at the apex level. The cause is mechanical: a small number of domains with enormous subdomain fan-out — a blog platform, a dynamic-DNS host, a CDN customer wildcarding tens of thousands of names — each cast tens of thousands of "votes" in whatever country they happened to sit. By 2026 the corpus had widened enough to dilute those few ballot-stuffers, and the answer-level number drifted up toward the apex truth. Data → inference: the apparent "US rising from 38% to 49%" is not the web moving to America; it is a measurement artifact decaying. Implication: any hosting-geography figure that does not state its unit — domains or answers — is unfalsifiable, and the widely-repeated shape of a US hosting share "declining from the low 60s toward 50" appears nowhere in a properly deduplicated count. It was an answer-level shadow all along.
The Cloud That Grew
If geography held still, infrastructure did not — but the motion is concentrated almost entirely in one company. These are the shares of resolving apexes whose primary A record falls inside each provider's published ranges.
| Provider | Apr 2023 | Jun 2025 | Jun 2026 | Net |
|---|---|---|---|---|
| Amazon AWS | 5.3% | 16.2% | 15.9% | +10.6 |
| Cloudflare (visible IPv4) | 6.9% | 6.3% | 8.3% | +1.4 |
| 8.1% | 3.6% | 3.9% | −4.2 | |
| Hetzner | 2.3% | 2.2% | 2.6% | +0.3 |
| OVH | 1.9% | 1.6% | 1.3% | −0.6 |
| Microsoft / Azure | 0.5% | 0.6% | 0.6% | +0.1 |
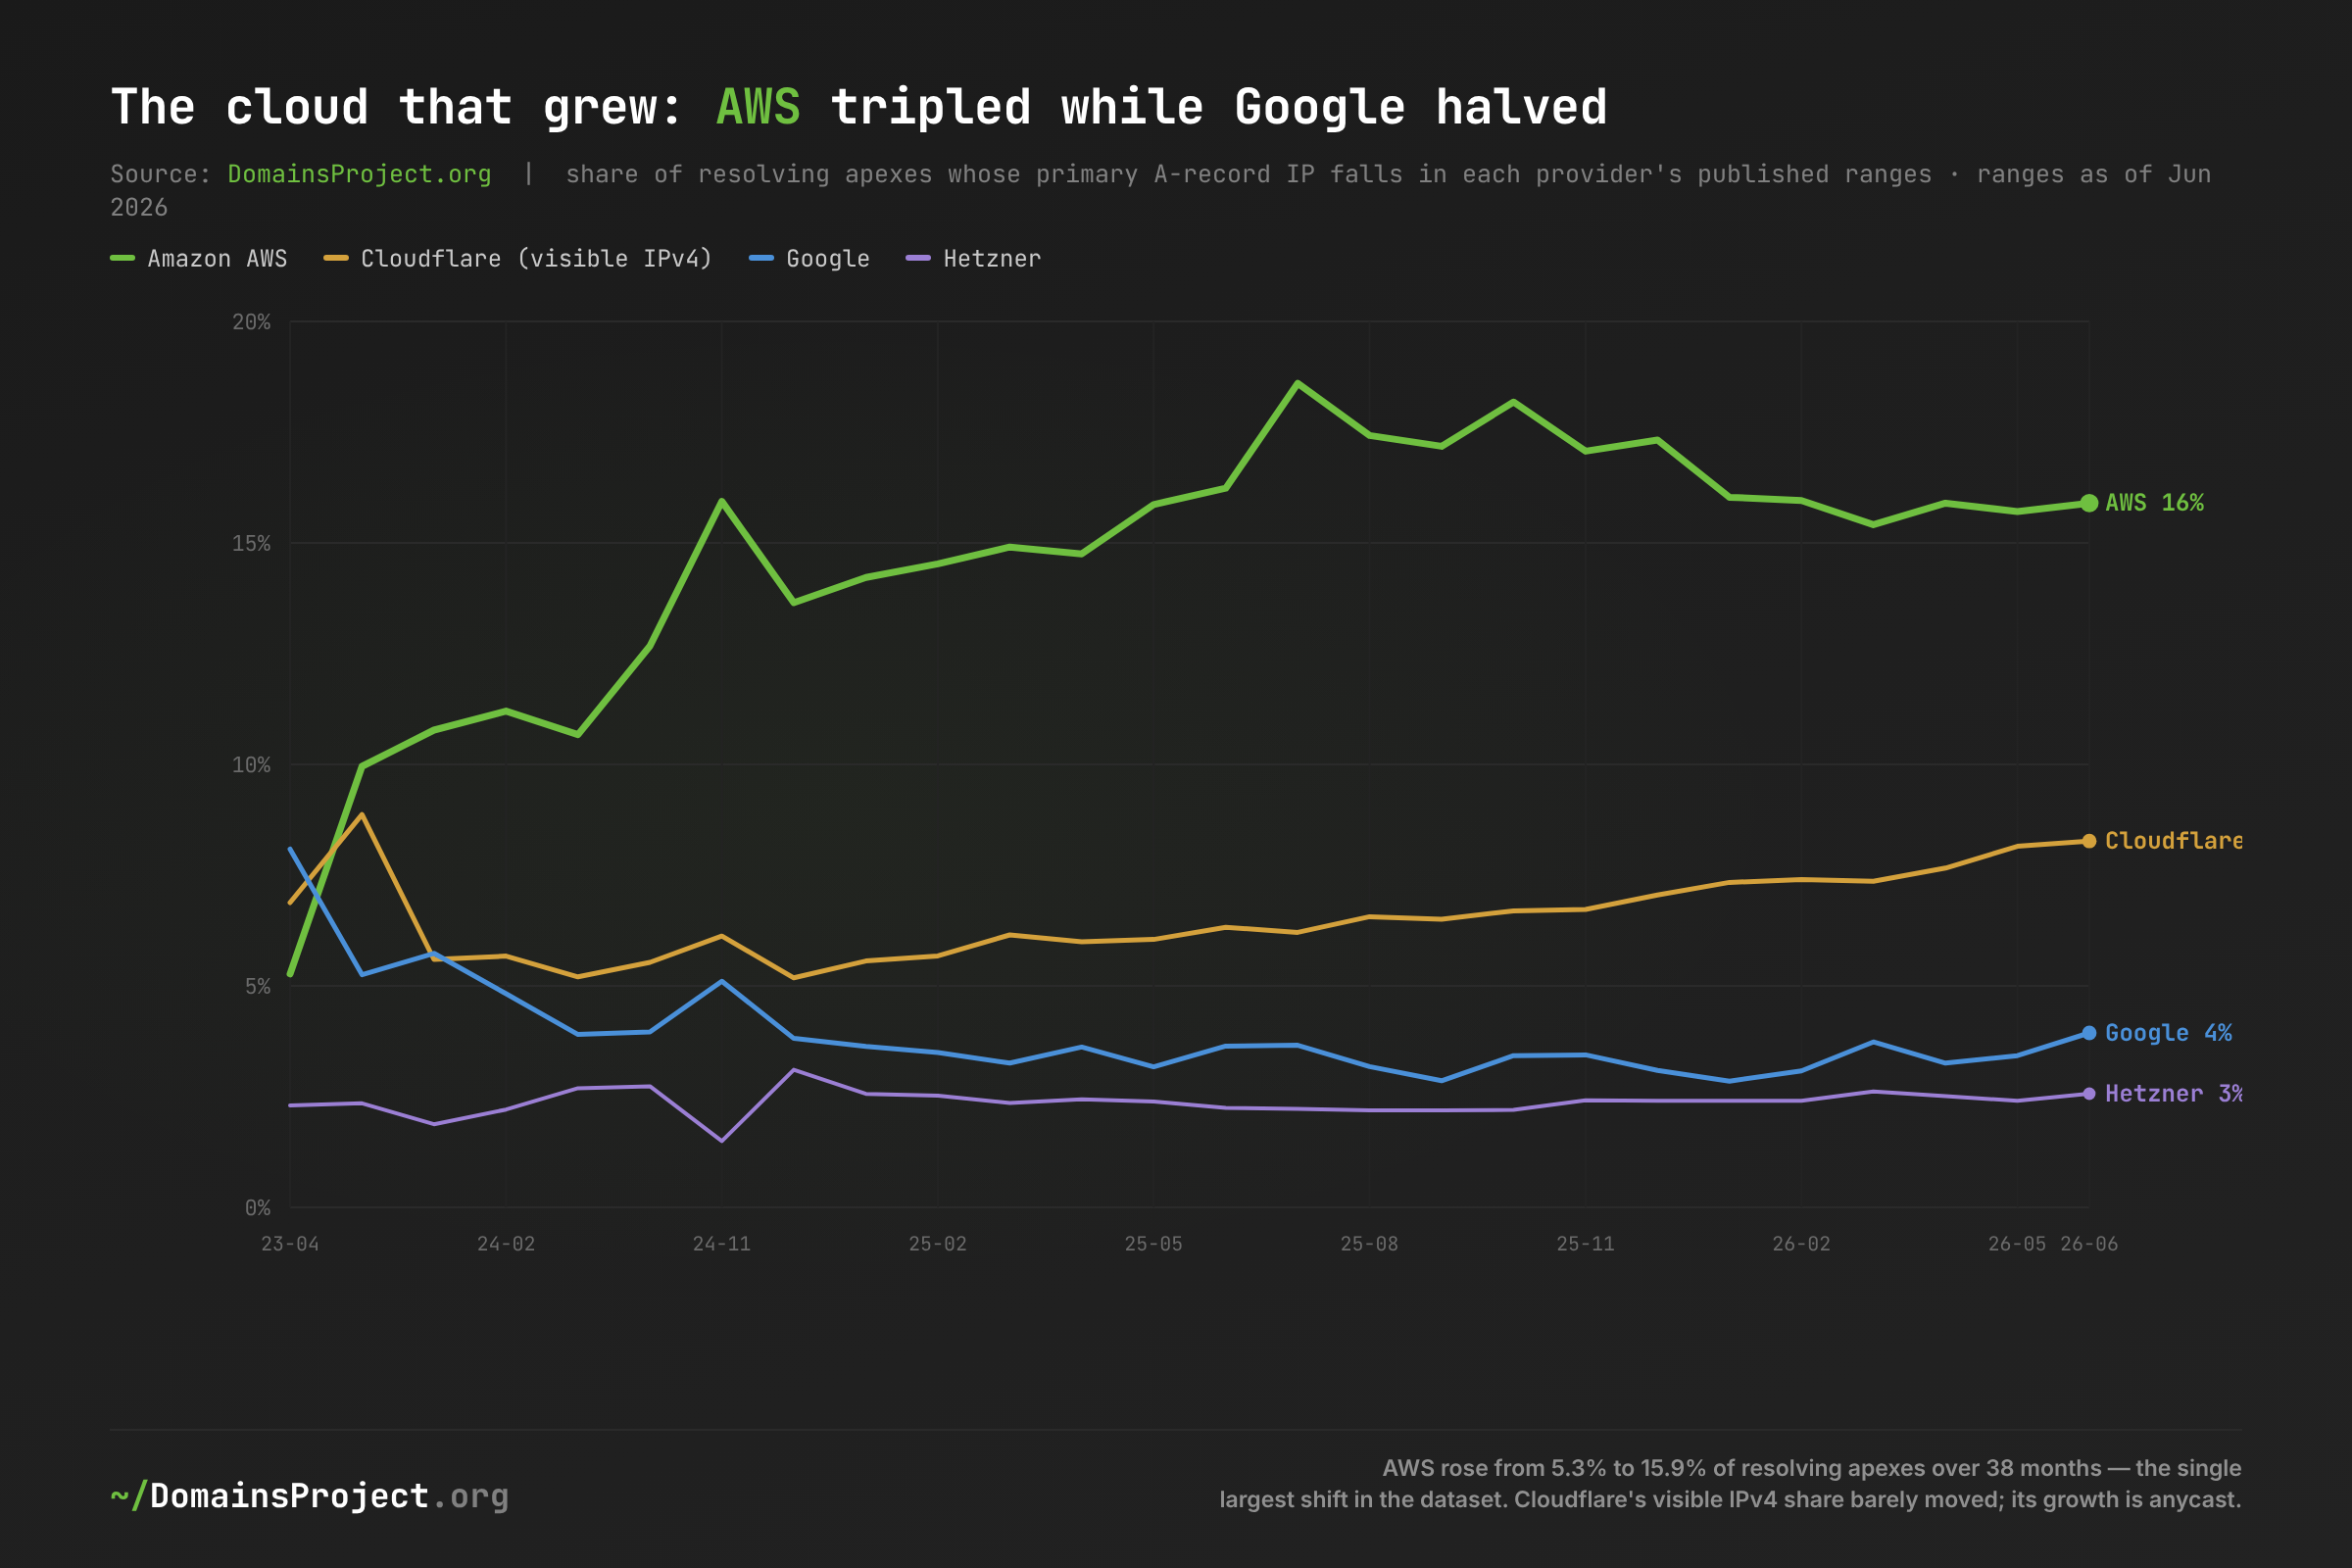
Amazon roughly tripled its footprint, from 5.3% of resolving apexes to a mid-2025 peak of 18.6% before settling near 16% — the single largest shift in the entire dataset. No other provider comes close. This is the per-domain shadow of a decade of migration: shared-hosting platforms, site builders, SaaS back-ends, serverless functions and registrar infrastructure that all quietly run on AWS, each dragging its hosted domains' A records into Amazon's ranges. Crucially, this is not the same number as AWS's market share, and the gap is the finding. Synergy Research puts AWS at roughly 30–31% of cloud-infrastructure revenue in 2024, slipping to 28% by early 2026 as Azure gains. So by the money, AWS is flat-to-declining; by the count of ordinary domains that physically resolve to it, AWS tripled. Data → inference: Amazon's share of spending and its share of the long tail of registered names are diverging. Implication: AWS increasingly underpins the web's quiet majority — the small and automated sites that generate little revenue per domain — even as the high-margin enterprise spend it competes for with Microsoft grows more contested. The one-vote lens sees a different Amazon than the earnings call does.
Google's visible share roughly halved, from around 8% to 3.9%, the mirror image of Amazon and consistent with the long decline of Google's domain-hosting surfaces — Blogger, Sites and the googleusercontent estate — relative to a corpus increasingly dominated by AWS-backed platforms. Cloudflare's visible IPv4 share barely moved, 6.9% to 8.3%, and that near-flatness is itself the story. Cloudflare's real growth is not in the address census at all; it is in the anycast bucket that grew from 3.8% to 9.3%, and in the IPv6 and CNAME layers where it dominates. Ask for an A record and Cloudflare looks like a mid-size host holding steady; the company's expansion is happening precisely in the dimension that an A-record-and-country census is built to miss, which is the same flattening blind spot we have measured from the other side twice before.
Consolidation, Counted One Domain at a Time
So the big clouds are growing — but how much of the web have they actually absorbed? Stacking the providers into tiers answers it, and the answer is a useful corrective to the consolidation narrative.
| Hosting tier | Apr 2023 | Jun 2026 | Net |
|---|---|---|---|
| Big-6 cloud & CDN | 21.2% | 28.9% | +7.7 |
| Named self-host (Hetzner, OVH, DigitalOcean, Linode) | 6.0% | 5.3% | −0.7 |
| Long tail (too small to name) | 72.9% | 65.9% | −7.0 |
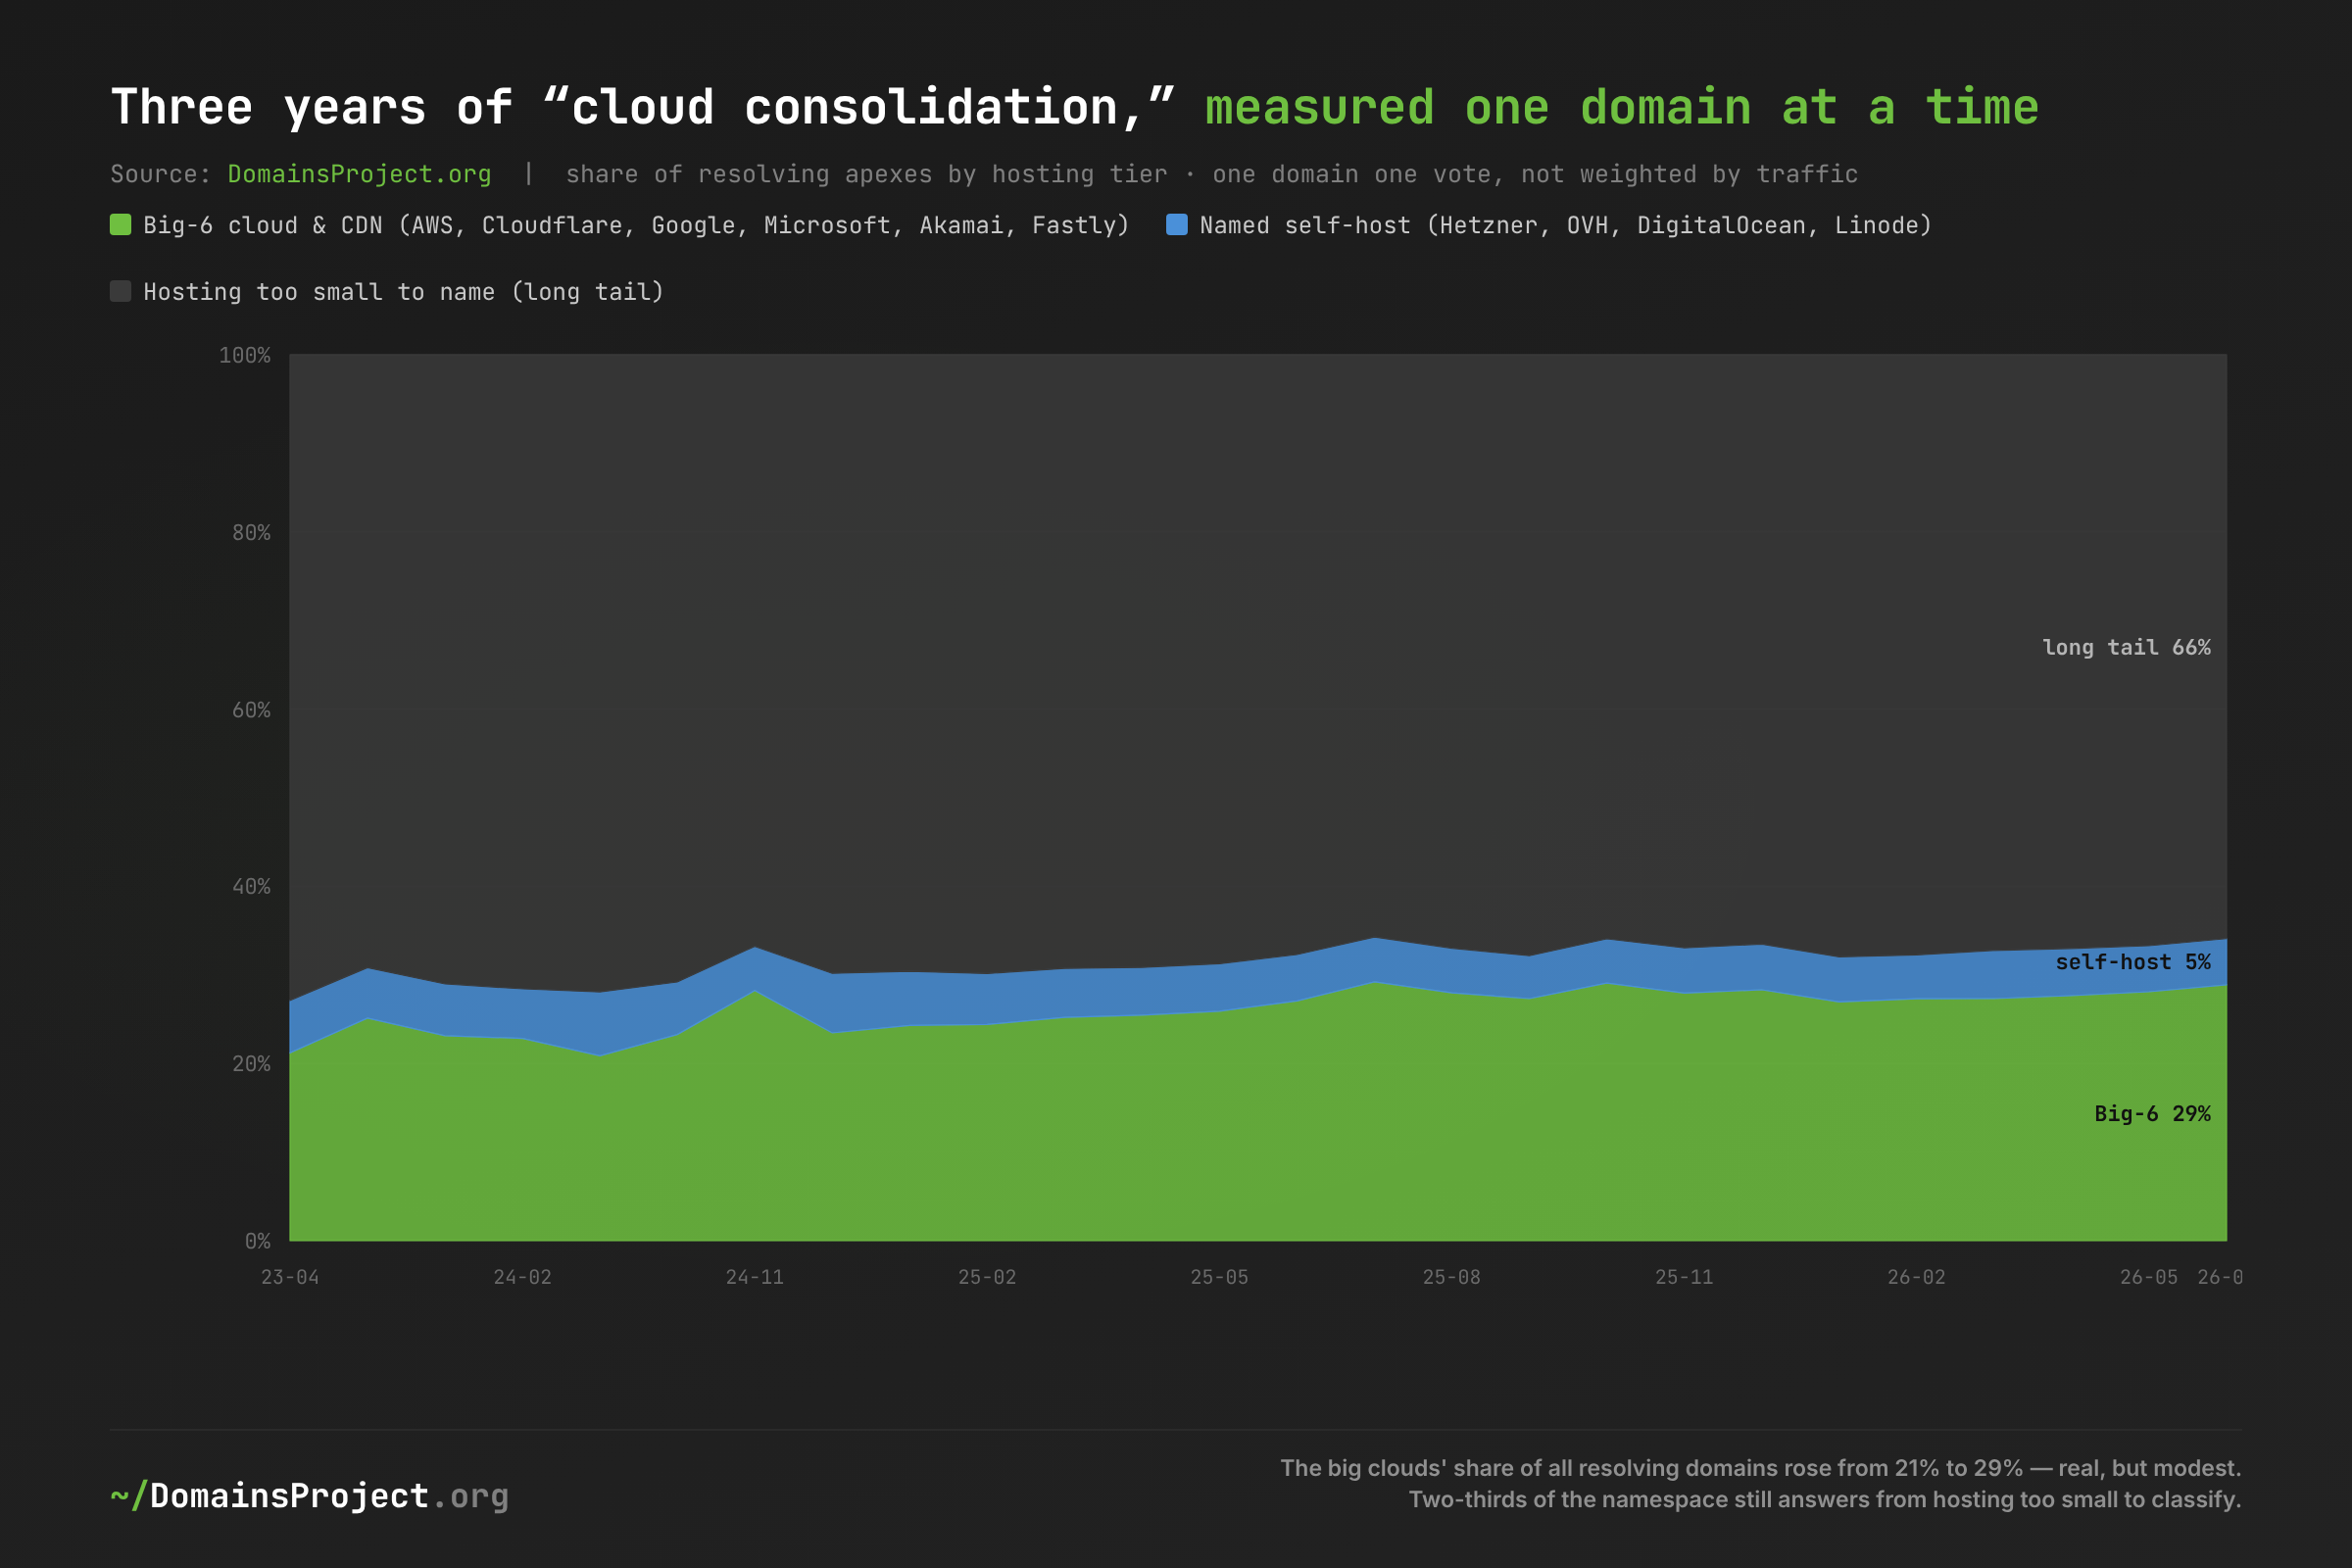
After three years of relentless cloud consolidation, two-thirds of the world's resolving domains still answer from hosting too small to name. The Big-6's combined share rose by a real but modest 7.7 points, to 28.9% — and almost all of that gain came directly out of the long tail, which fell from 72.9% to 65.9%. The named self-hosters held flat. Data → inference: consolidation into the hyperscalers is genuine but slow, and it is nowhere near the saturation that top-site rankings imply. Implication: the gap between the traffic-weighted picture (where a few clouds and CDNs front most of the visits) and the per-domain picture (where most names still sit on regional ISPs, shared resellers and registrar farms) is enormous and persistent. The Internet of busy sites is consolidated; the Internet of registered names is not, and at this rate the long tail will still be the majority well into the 2030s. The web most people experience runs on six companies; the web that actually exists, domain for domain, mostly does not.
.com Is Immovable; the New gTLDs Are Climbing
The last dimension is the namespace itself. Within the dense monthly window where per-TLD counts are stable, we index each TLD's share of resolving apexes to its January 2025 value to compare trajectories on one scale despite vastly different sizes.
| TLD | Share, Jan 2025 | Share, Jun 2026 | Index (Jan 2025 = 100) |
|---|---|---|---|
| .ai | 0.12% | 0.33% | 262 |
| .top | 0.35% | 0.87% | 247 |
| .app | 0.19% | 0.33% | 176 |
| .xyz | 1.21% | 1.93% | 160 |
| .dev | 0.16% | 0.23% | 147 |
| .online | 0.47% | 0.63% | 136 |
| .de | 4.82% | 5.70% | 118 |
| .com | 49.3% | 48.5% | 98 |
| .net | 3.92% | 3.65% | 93 |
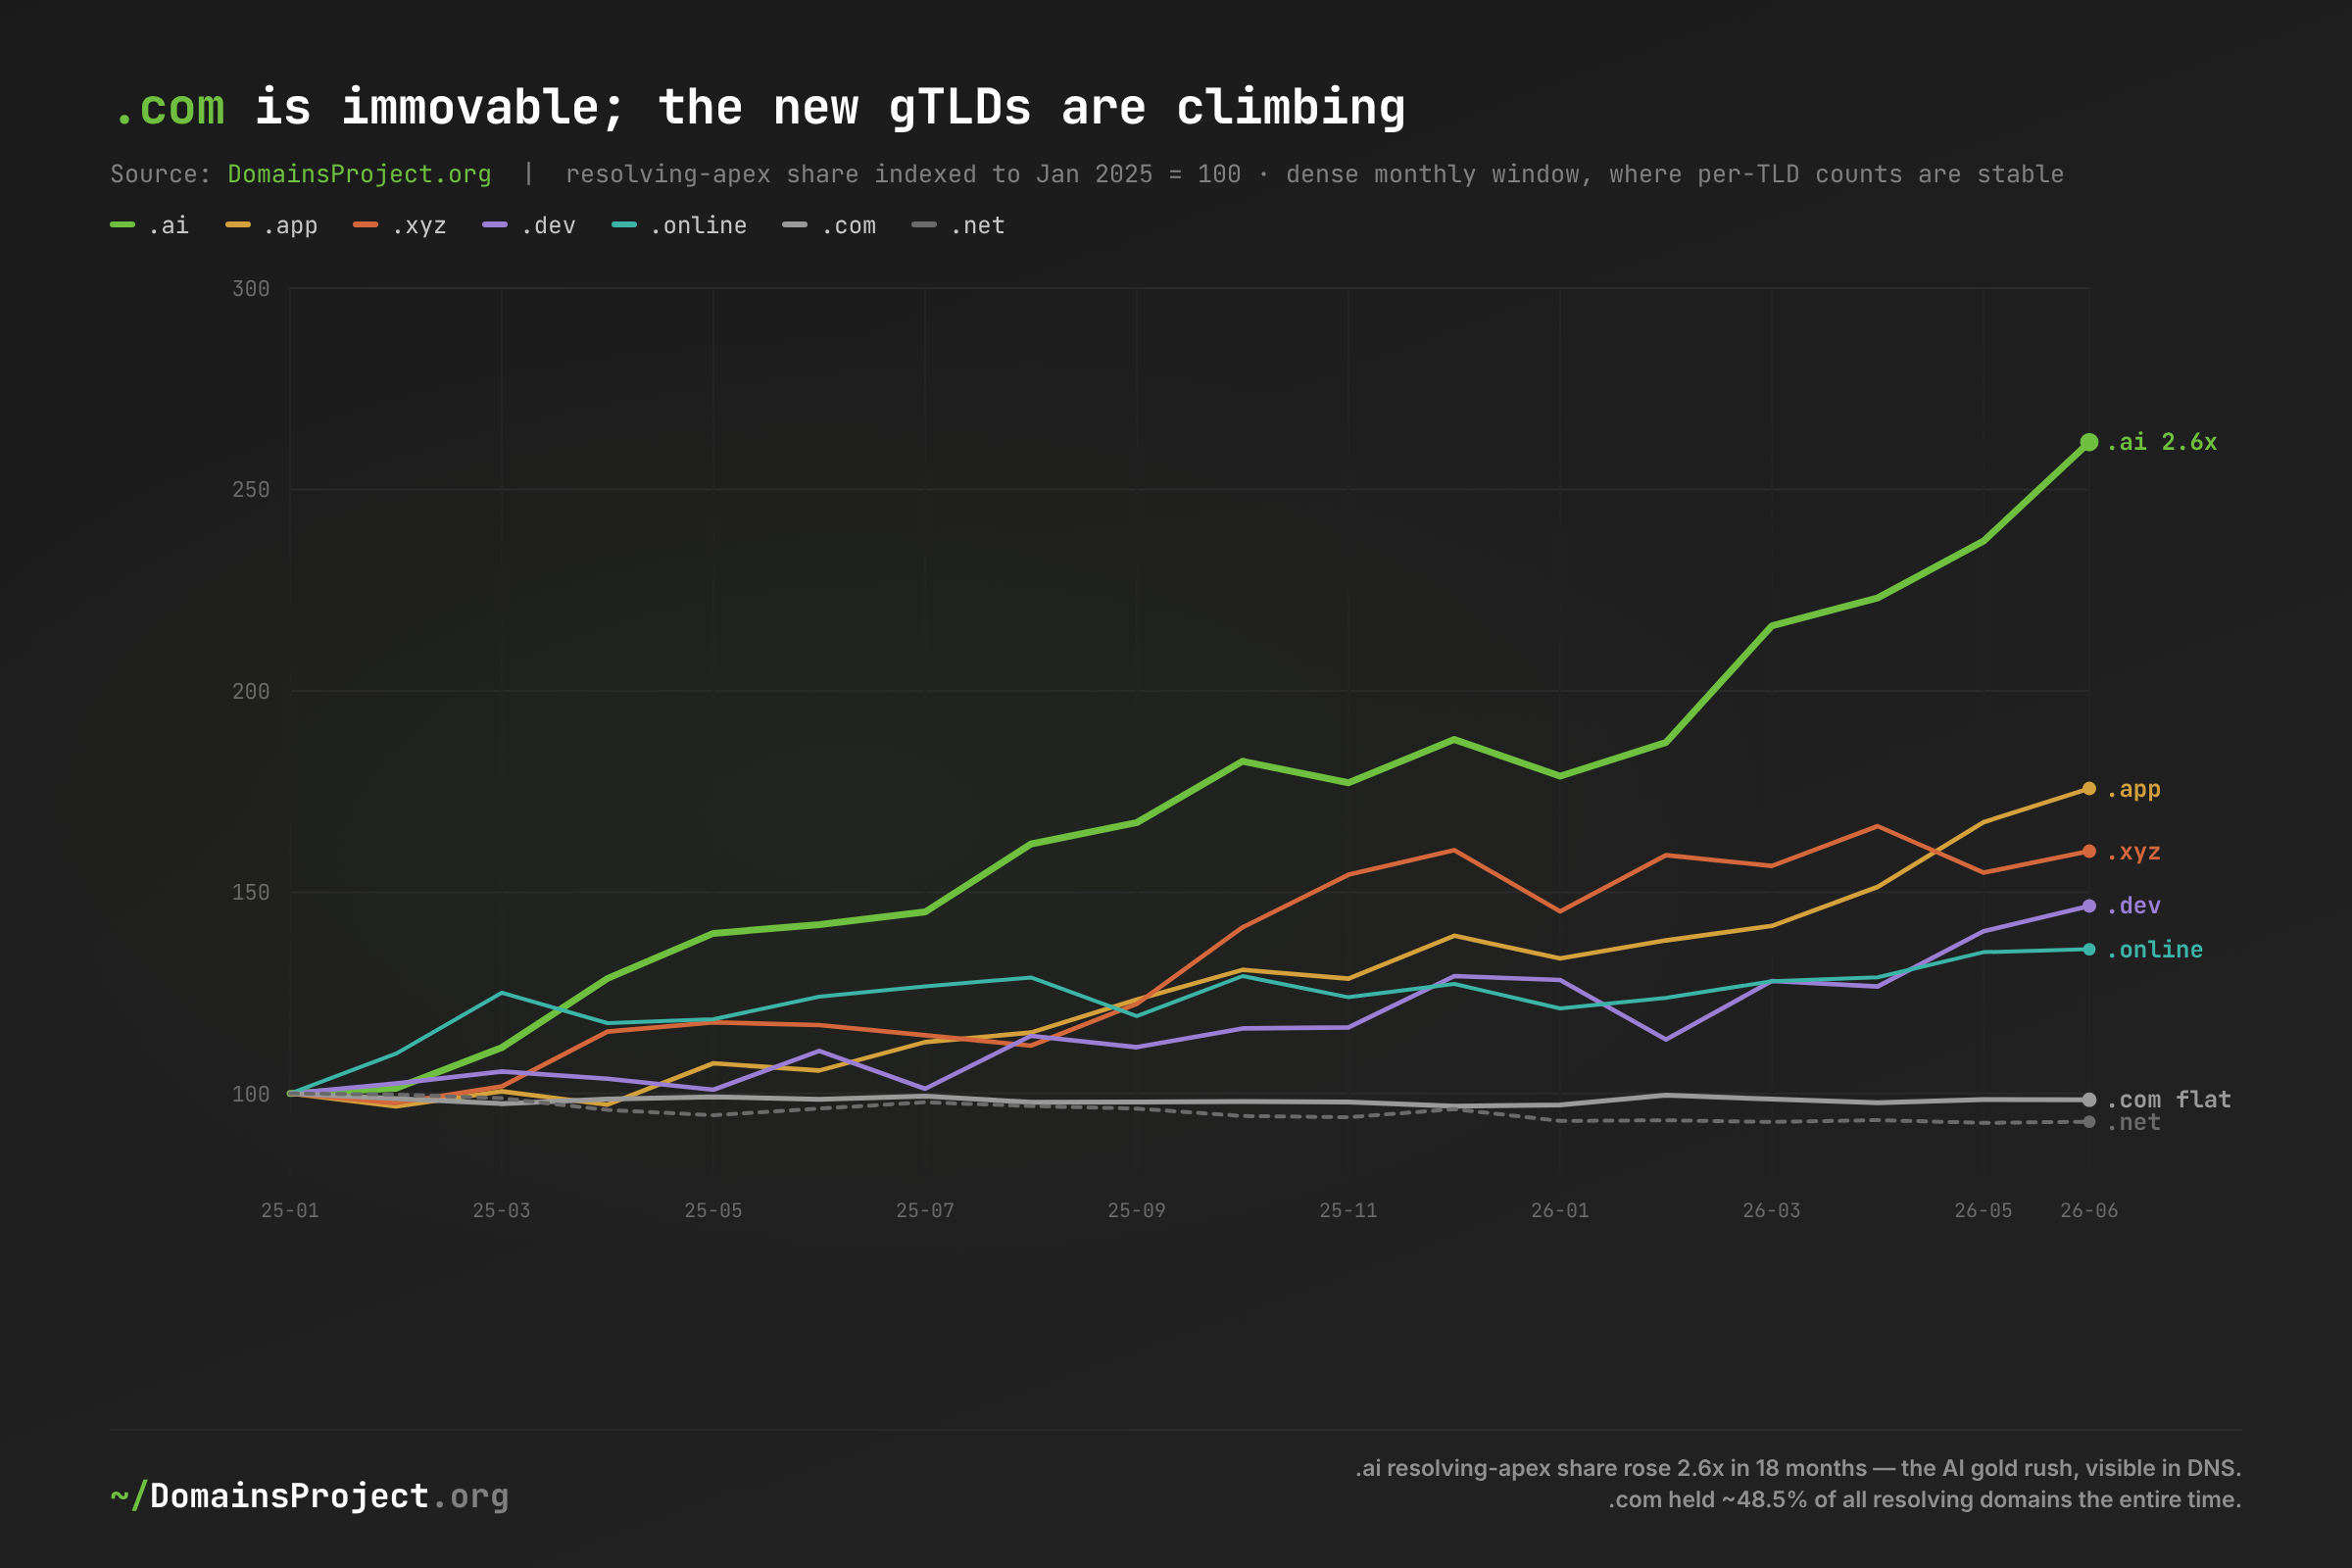
.com is the immovable object of the resolving web, holding between 47.7% and 49.3% of all resolving apexes for eighteen straight months — essentially half the functional Internet, exactly as the .com monopoly census found at a single point in time, now confirmed as durable rather than a snapshot accident. Around that stationary giant, the new gTLDs are the only fast-moving names in the namespace. .ai resolving-apex share rose 2.6× in eighteen months — the clearest imprint of the AI build-out anywhere in DNS, and a direct longitudinal confirmation of the AI gold rush and its follow-up on utilization, which argued the registrations were turning into real resolving sites rather than pure speculation. .top more than doubled on the strength of cheap bulk registration, .app, .xyz, .dev and .online all climbed roughly 35–75%, and the legacy survivors .com and .net sat flat-to-down near the baseline. Data → inference: the growth in the namespace is real but confined to a low base — every riser combined is still a rounding error against .com's half. Implication: the AI-era TLD surge is unmistakable in rate and marginal in level; .ai growing 2.6× moved it from 0.12% to 0.33% of resolving domains, a jump that leaves .com's dominance entirely intact. Momentum and mass are two different stories, and most coverage of the new TLDs reports the first as if it were the second.
What's at Stake
- Hosting-geography claims are unfalsifiable without a stated unit and denominator. "US hosting share fell from the 60s to 50" is an answer-level shadow; "US hosting is flat at 45%" is the apex truth; "the US has half the world's data-center capacity" is a third, traffic-and-capital measure. All three circulate as if interchangeable. Any figure that does not say domains or answers, and weighted by what should be treated as decorative.
- The de-Americanization narrative is, at the per-domain level, not yet visible. Sovereign-cloud policy and enterprise region choices may be reshaping the traffic-weighted top of the market, but the census of registered names shows the US holding 45% for three years running. Policymakers and analysts citing a hosting power shift should be explicit that it is, so far, a story about the busy web, not the whole web.
- Anycast is quietly erasing the hosting map. The fastest-growing geographic category is the absence of geography. As more domains hide behind Cloudflare and other anycast front-ends, country-of-hosting becomes progressively less measurable — a problem for jurisdiction, lawful-access regimes, sanctions enforcement and anyone who assumes an IP implies a place.
- AWS's footprint and AWS's revenue are diverging, and the footprint is the strategic moat. Amazon tripled its share of the domain long tail while its cloud-revenue share plateaued. The platforms and resellers that default millions of small domains onto AWS are a quieter, stickier form of lock-in than the enterprise contracts the market trackers count.
- Consolidation is real, slow, and decades from completion. Six companies front most of the web's traffic but only 29% of its domains. The long tail is shrinking at roughly two points a year; betting on a fully hyperscaler-owned Internet is, on this trajectory, a very long bet.
What Would Help
- Researchers and journalists: report hosting geography per apex, and name your unit. Counting answers lets a handful of subdomain-heavy domains dictate the result, as the 2023 answer-level tally's phantom UK/France/Taiwan lead shows. Deduplicate to the registrable apex, state "domains, one vote," and your trend lines will stop inventing movements that are not there. Cross-check against the dataset.
- Cloud and CDN analysts: separate footprint from spend. AWS at ~16% of resolving domains and ~30% of cloud revenue are both true and mean different things. Track the per-domain footprint alongside the revenue league table; the divergence between them is where the long-tail lock-in story lives.
- Standards and policy bodies: treat the anycast bucket as a measurement frontier. A growing, now-9% slice of domains has no determinable hosting country. Jurisdictional and enforcement frameworks that assume IP-implies-location need an explicit answer for anycast, because the un-geolocatable share is rising about a point a year and will not stop.
- Registries marketing new gTLDs: lead with rate, but disclose level. .ai genuinely tripled and .top genuinely doubled — real momentum worth selling. They are also still fractions of a percent of resolving domains. Pairing the growth multiple with the absolute share is the honest pitch, and the durable one when the comparison to .com inevitably comes.
- Everyone tracking the Internet's structure: build the time series, then re-ask the snapshot questions. Almost every confident claim about hosting trends rests on one measurement. This is the first longitudinal pass in our series precisely because the single-snapshot posts that preceded it could not, by construction, tell motion from stillness. Watch the monthly series evolve on the statistics dashboard and benchmark against the per-TLD pages at /stats/.
Methodology: 26 monthly A-record-plus-geoIP crawls of a DomainsProject full-corpus name list, April 2023 through June 2026, reduced to the registrable apex via ICANN public-suffix rules and counted one domain one vote — 29 to 74 million resolving apexes per snapshot at a uniform 1-in-12 shard sample. Geography is the geoIP country of each apex's primary A record, with anycast/un-geolocated reported as a first-class category; two 2024 passes that lacked geoIP enrichment are excluded from geography. Providers are classified against published IP ranges as of June 2026 — authoritative files for Cloudflare, AWS, Google and Fastly; curated aggregates for Microsoft/Azure, Hetzner, OVH, DigitalOcean, Akamai and Linode — applied uniformly to all snapshots, so historical cloud footprints are conservative floors and the trend is measured with one constant rule. Because the corpus grew ~2.6× over the period, all figures are shares, never absolute counts, and per-TLD trend claims are confined to the dense January 2025 – June 2026 window. External triangulation from Synergy Research / Statista (AWS cloud-revenue share), W3Techs (Cloudflare site share), and public web-hosting and data-center capacity tallies; internal cross-checks against The .com Monopoly, The IPv6 Mirage, The Landlords of the Web, and the AI gold rush and its utilization follow-up. The answer-level versus apex-level comparison was run on the same crawls to demonstrate the deduplication effect. Russian-administered TLDs excluded throughout. This is the first longitudinal post in the series; the monthly passes that make it possible will extend it. Explore the full dataset at /dataset and per-TLD statistics at /stats/.