In March we mapped the .ai gold rush: how a Caribbean island of 14,000 people came to collect roughly half its government revenue from two letters, how registrations went from 48,000 in 2018 to more than a million by January 2026, and how the aftermarket for short .ai names exploded. That post answered how many .ai domains exist and what they cost. It is the question every registry press release answers.
It is also the wrong question. A registration is a receipt, not a website. The number that actually describes a namespace is not how many domains were sold but how many are doing anything — resolving, serving a site, carrying mail, taking payments, running a product. The original post took a first step toward this with an A-record resolution pass. This follow-up finishes the job: we resolved every signal we can read from DNS — A, MX, NS, and TXT — for the entire .ai root population, and used them to separate the operating namespace from the speculative one.
We analyzed 1,013,951 registrable .ai roots in our typed-DNS crawl of June 2026, cross-referencing four record types per domain, and triangulated the result against external cohort data (Identity Digital, Smart Branding) and abuse telemetry (Spamhaus, Interisle, abuse.ch, Netcraft, WIPO). Where our earlier post leaned on a third-party content audit to estimate how many .ai sites are placeholders, this one measures activity directly from each domain's own DNS configuration — a parked domain does not publish a Stripe verification record or a custom MX.
The headline: 94.3% of registered .ai domains resolve to an IP, but resolution is the floor, not the finding. Only 48.5% publish any real-use signal — mail, SPF, or a third-party SaaS verification token — and just 20.4% carry a verification token at all. Of the domains that resolve, 51% show no mail, no SPF, and no verification: they point at something, but nothing about that something looks operated. Meanwhile ~9% sit on domain-marketplace nameservers — openly for sale — and the functional .ai namespace is on the order of 480,000 domains, roughly half the million-registration headline. The gold rush was real. So is the holding pattern that followed it.
The Data
DomainsProject continuously crawls and indexes hostnames across every delegated TLD in the IANA root zone (Russian-administered TLDs excluded). For .ai we observe both the full hostname footprint and, in the typed crawl, the live DNS configuration of each registrable root.
| Measure | Value | Source |
|---|---|---|
| Observed .ai hostnames (FQDNs) | 4,132,471 | Dataset snapshot, 2026-06-20 |
| Unique registrable apexes (cumulative) | 1,172,822 | Dataset snapshot, 2026-06-20 |
| Registrable roots queried in typed crawl | 1,013,951 | Typed-DNS crawl, June 2026 |
| Record types resolved per domain | A, MX, NS, TXT | Typed-DNS crawl, June 2026 |
| Apexes observed, late 2023 (for growth) | 87,678 | Historical mirror, Nov 2023 |
| Registry registrations (point-in-time) | ~1,000,000 | Domain Name Wire / registry, Jan 2026 |
The observed apex footprint grew 13.4× in roughly 31 months — from 87,678 distinct roots in late 2023 to 1,172,822 by mid-2026 — tracking and slightly exceeding the registry's own ~3× growth over the same window. The cumulative footprint (1.17M) runs above the ~1.0M live registrations because it includes domains that have since lapsed; the June crawl's 1.01M queried roots is the cleaner "currently live" denominator we use for every rate below.
Methodology
This post makes quantitative claims about "use." Every label is defined here.
- Resolves — the bare root returns at least one
Arecord (an IP) in the June 2026 crawl. ANOERRORresponse with no address (NODATA) does not count. - Mail-capable — the root publishes a non-null
MXrecord. A null MX (0 ., RFC 7505) is an explicit no-mail declaration and is counted separately, not as mail-capable. - Publishes SPF — the root publishes a
v=spf1TXT record (outbound mail configured). - SaaS-verified — the root publishes at least one third-party domain-verification TXT token (e.g.
google-site-verification,MS=,stripe-verification,openai-domain-verification,amazonses,zoho,facebook-domain-verification). Parked domains effectively never do this. - Any real-use signal — the union of mail-capable, publishes-SPF, and SaaS-verified.
- For-sale nameservers — the root's authoritative NS belong to a domain-marketplace or parking operator (Afternic, Sedo
dns-parking.com, Atom, Dan, Bodis, and similar).
Dataset scope and resolution criteria. The crawl queries the observed hostname list, so it cannot measure a registration/NXDOMAIN rate — every queried name already exists in DNS and returned NOERROR. Resolution and configuration rates are therefore computed over names we already knew existed. Rates use the crawl's 1,013,951 queried roots as denominator; the cumulative footprint (1.17M) is used only for growth.
Known limitations. (1) Provider tallies for mail and verification are per record, so a domain with several MX hosts counts more than once in provider share; apex-level counts are stated where used. (2) DMARC lives at _dmarc.<domain>, which is largely absent from our hostname list, so we report no DMARC adoption figure. (3) CDN fronting (notably Cloudflare) hides origin geography — ~862K A answers had no geoIP country — so DNS-host share is more reliable than IP geography. (4) Verification and SPF presence are floors: a domain using a SaaS we don't fingerprint, or whose token name we never observed, will read as unconfigured. (5) "For-sale nameserver" depends on the operator set; name.com is dual-use (registrar and marketplace), so the parking figure carries a ±0.5pp band. (6) This is one snapshot; we flag where a single point-in-time reading cannot support a trend claim.
The Utilization Funnel: Resolution Is Not Use
| Signal | Roots | % of 1,013,951 |
|---|---|---|
| Resolves to an IP (A) | 955,717 | 94.3% |
| Any real-use signal (MX ∪ SPF ∪ verified) | 491,444 | 48.5% |
| Publishes SPF | 410,295 | 40.5% |
| Mail-capable (real MX) | 398,286 | 39.3% |
| Declares no mail (null MX) | 47,405 | 4.7% |
| SaaS-verified | 206,979 | 20.4% |
| Mail and SaaS-verified | 182,108 | 18.0% |
| On for-sale nameservers | ~93,865 | ~9.3% |
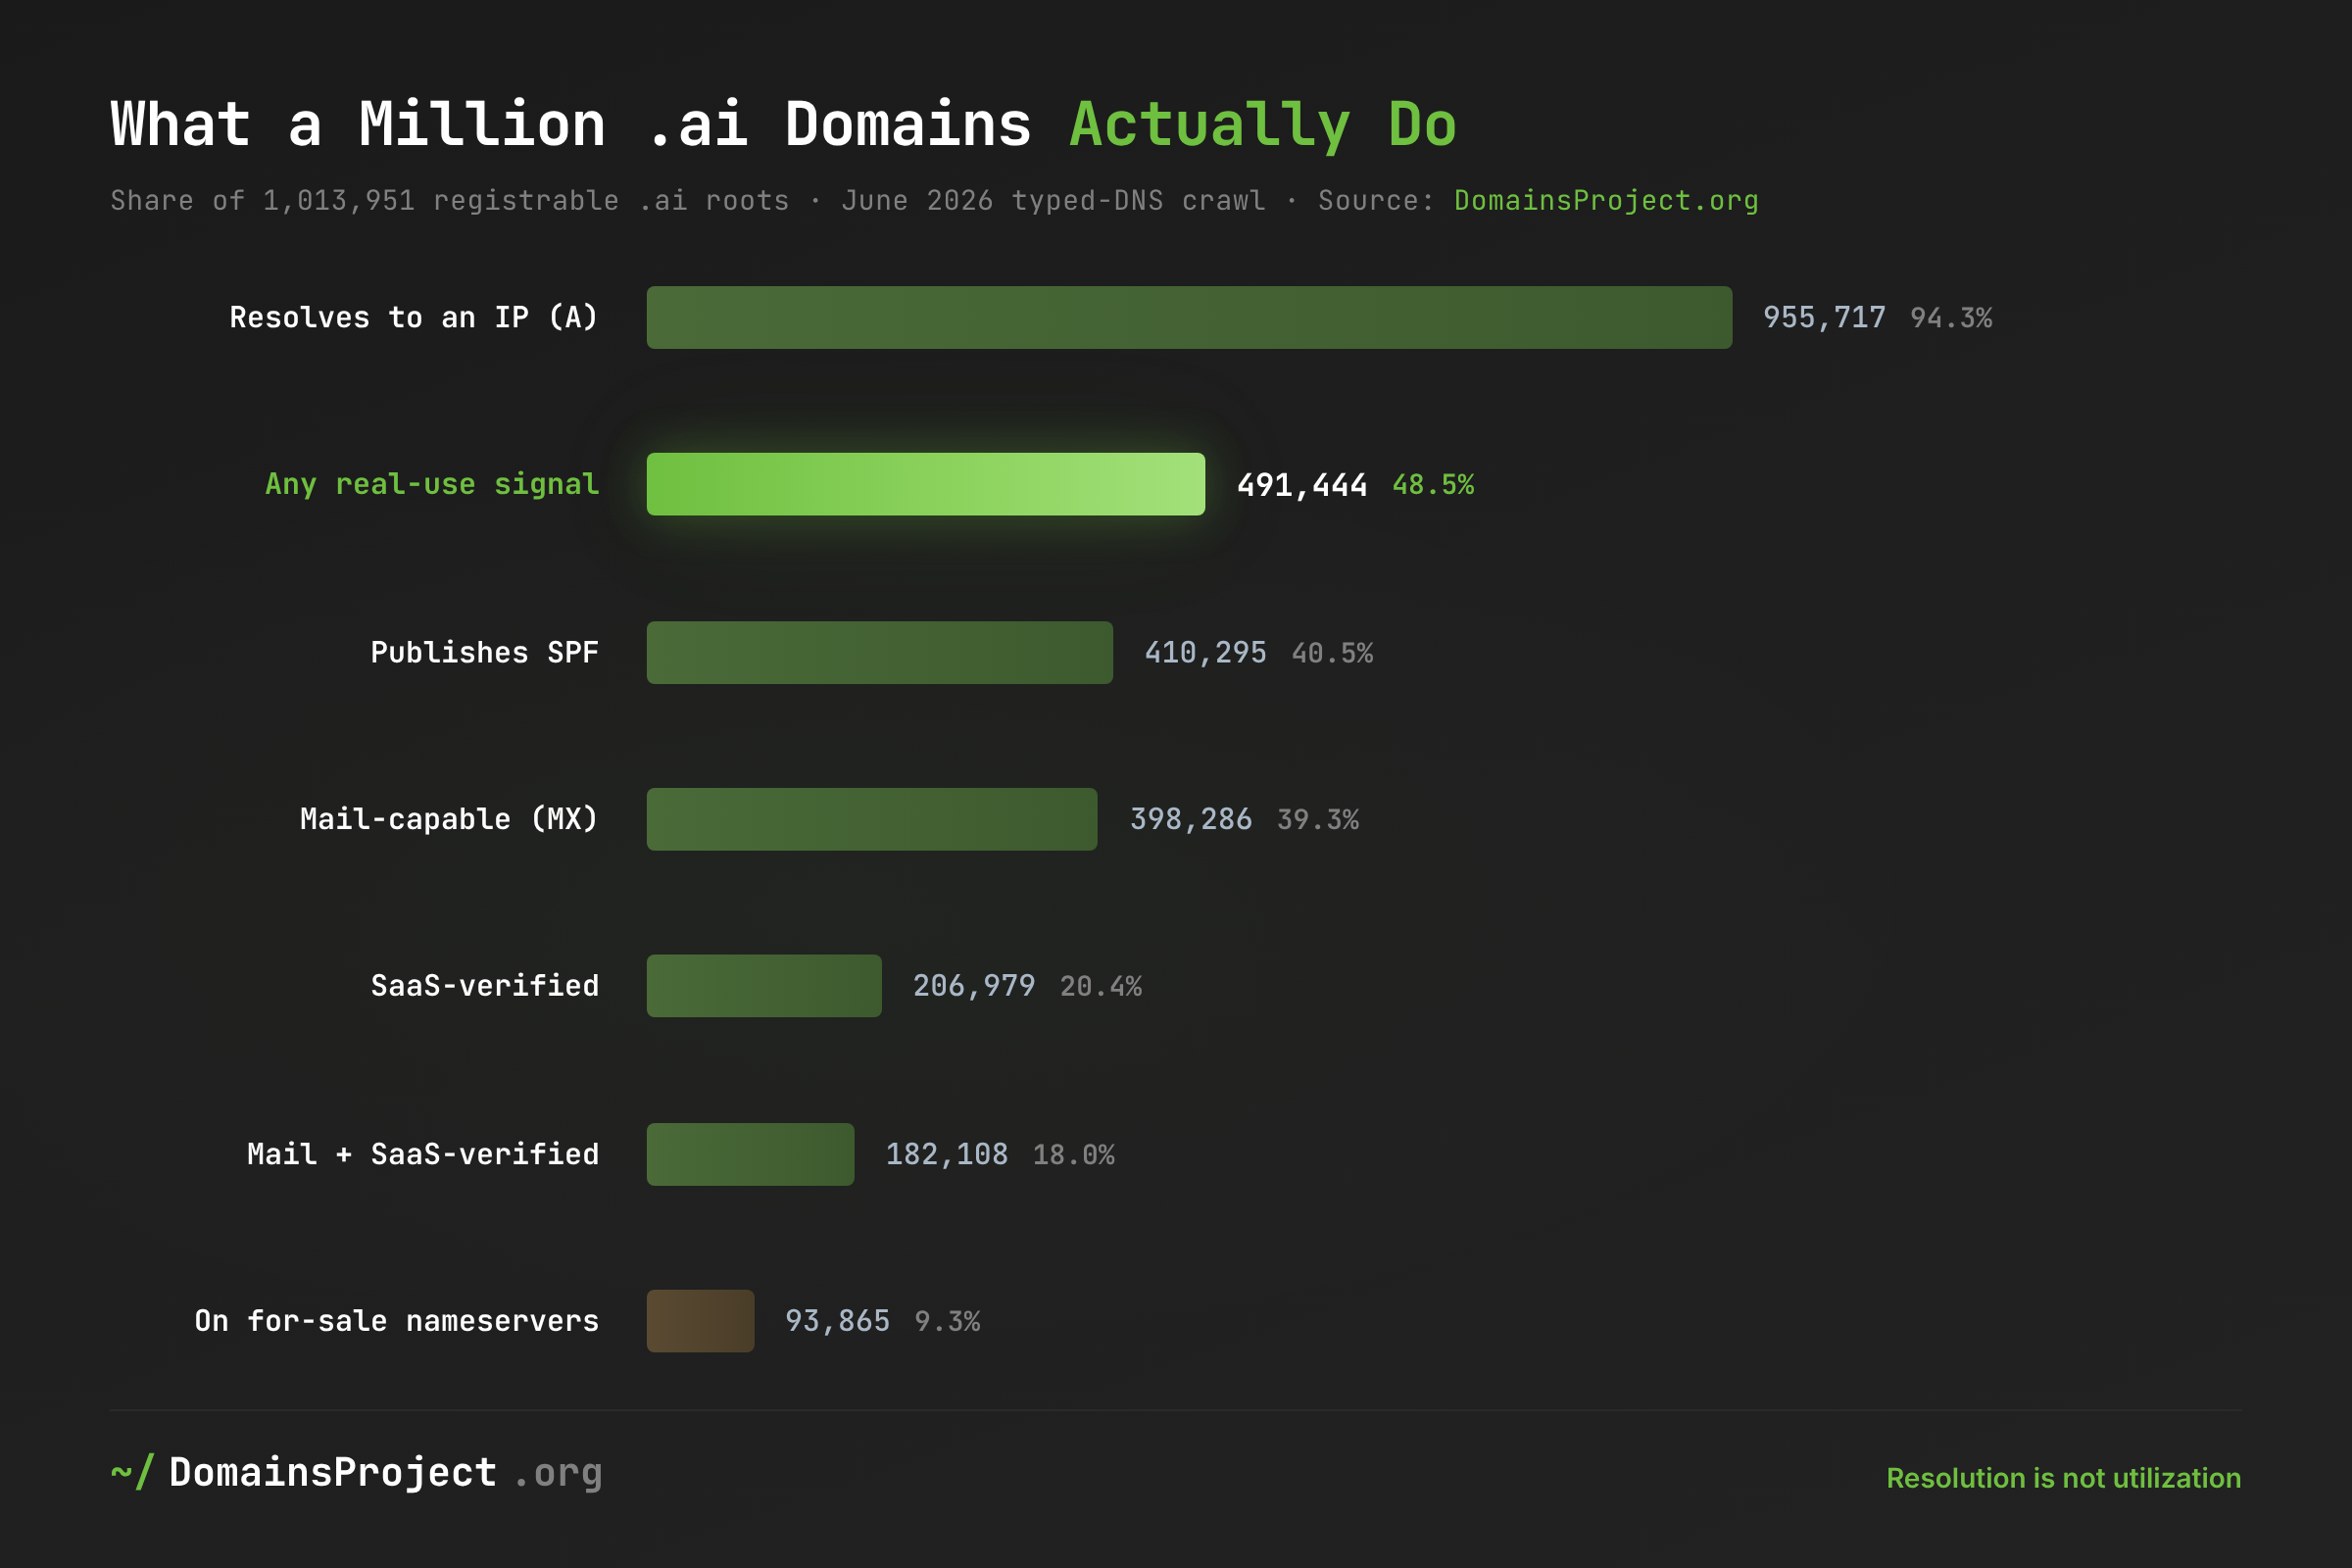
94.3% of registered .ai domains resolve — and that is the weakest bar in the table. An A record points at something; it does not say whether that something is a product, a landing page, or a parking lot. The more telling cut is what sits below resolution.
Of the domains that resolve, 51.2% publish no mail, no SPF, and no verification token at all — 489,749 roots that answer in DNS but show zero configuration consistent with an operated property. This is the direct, first-party measurement that our original post could only approximate by borrowing an external "≈61% placeholder" content audit. The two methods agree on the shape of the namespace from opposite directions: roughly half of what resolves is dormant.
48.5% carry at least one real-use signal — the defensible upper bound on "active" — while 20.4% carry a SaaS verification token, the floor of clearly commercial use. The honest active-utilization rate is a range, not a single number: somewhere between one in five (commercial-integration floor) and one in two (any signal). Either way, the "one million domains" headline overstates the operating namespace by roughly two to five times — consistent with the ~480,000 functional-site estimate from our original analysis, now anchored in configuration data rather than a content scan.
~9.3% of roots — about 94,000 domains — sit on domain-marketplace or parking nameservers (Afternic, Sedo, Atom, and peers). This is the aftermarket the original post described from sales reports, now counted from the DNS side: it is not an inference about speculation, it is the for-sale inventory resolving in plain sight. Notably, 18,396 of these parked roots still publish MX — the classic registrar-default mailbox attached to a domain whose primary purpose is to be sold.
Beyond Resolution: The Signals of Real Use
If resolution is noise, verification tokens are signal. A domain publishes stripe-verification because someone connected live payments; it publishes openai-domain-verification to claim a domain inside an OpenAI organization; it publishes MS= to stand up Microsoft 365. None of these happen by accident, and none happen on a parked domain.
| Verification token | .ai apexes | What it implies |
|---|---|---|
| Google (Search Console / Workspace) | 272,351 | Search/email setup |
| Microsoft 365 | 39,533 | Business email/identity |
| Zoho | 24,480 | Business email |
| Amazon SES | 11,400 | Transactional mail at scale |
| Brevo | 10,350 | Email marketing |
| OpenAI | 6,085 | OpenAI org / API / GPT domain |
| Meta Business | 4,650 | Ads/business identity |
| Atlassian | 4,124 | Jira/Confluence |
| Apple Business | 4,001 | Apple Business identity |
| Stripe | 2,726 | Live payment processing |
| Notion | 792 | Workspace |
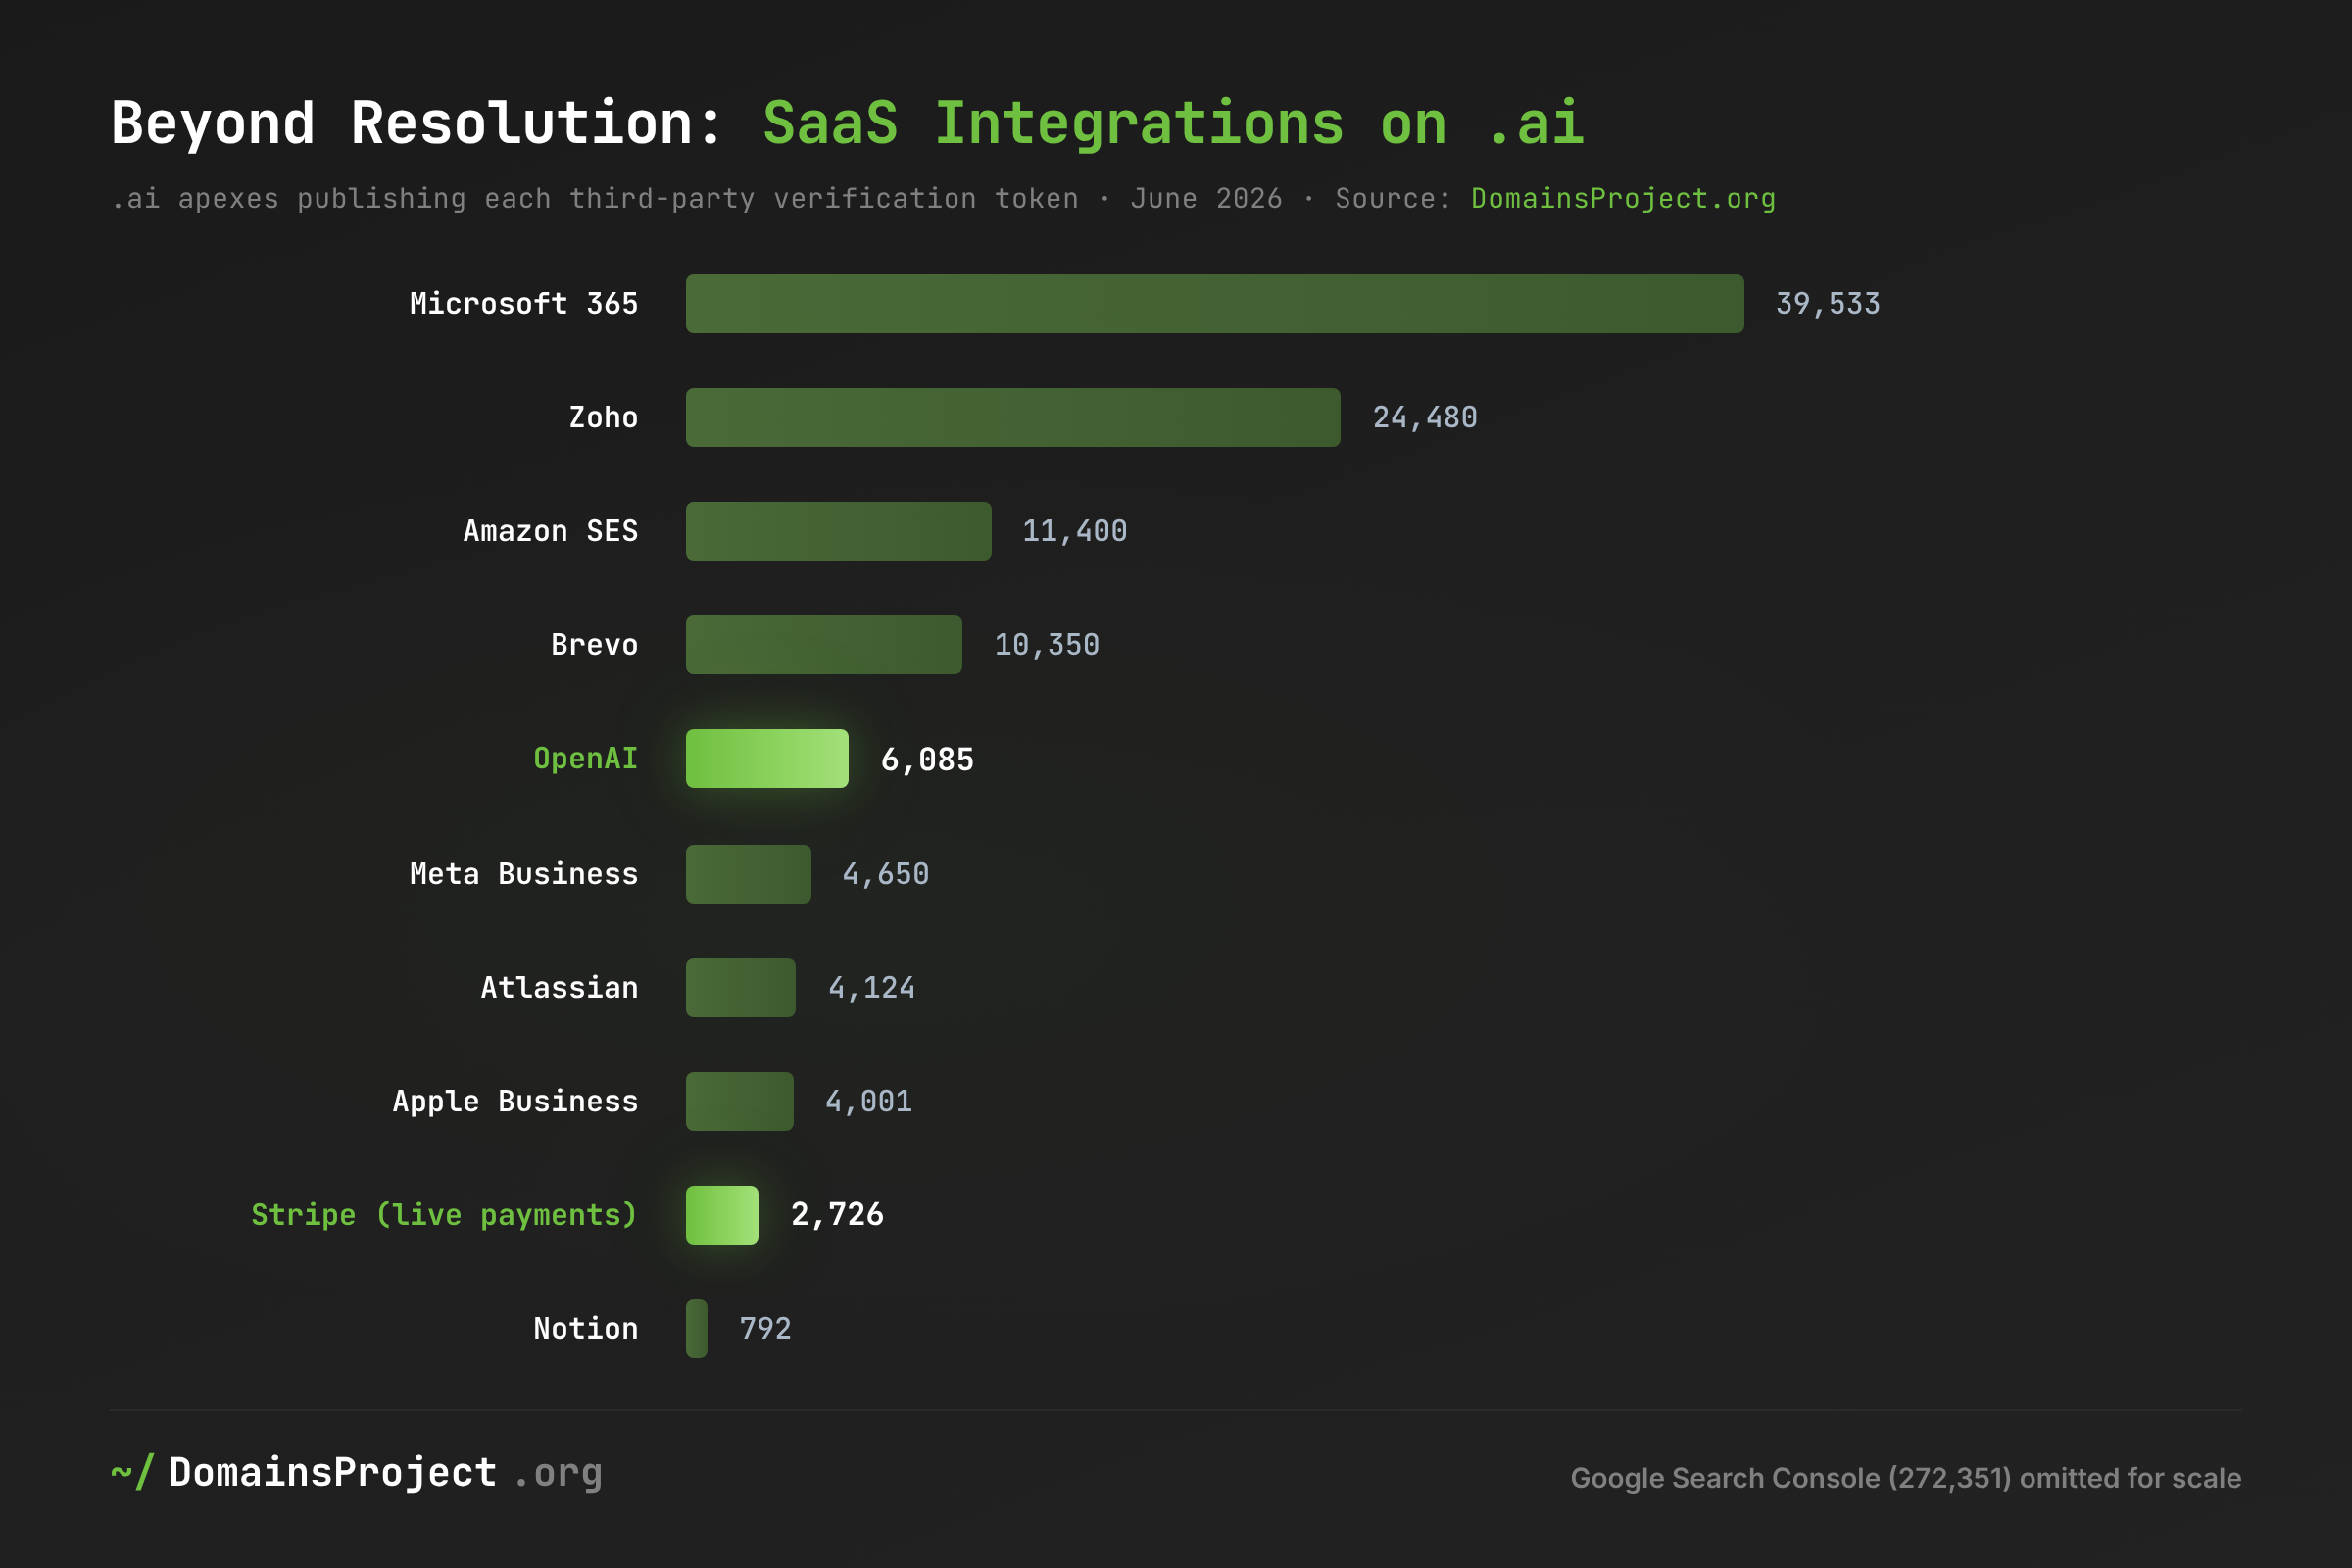
6,085 .ai domains have verified ownership with OpenAI and 2,726 run live Stripe payments — exactly the kind of AI-era, revenue-adjacent activity that a registration count cannot see and a content audit cannot confirm. These are floors (we only catch tokens whose names we observe), which makes them conservative evidence that the operating core of .ai is genuinely commercial, not merely registered. The transactional-mail providers tell the same story: 25,324 roots route mail through Mailgun and 11,400 through Amazon SES — domains that send real product email, not forwarders.
47,405 roots publish a null MX — a deliberate "this domain sends and receives no mail." That is a security-aware configuration almost never seen on parked inventory, and it belongs in the "operated" column even though it is the opposite of mail-capable. The picture that emerges is a barbell: a real, configured core of AI-native products and businesses on one end, a large dormant-but-resolving tail on the other, and a thinner middle than the registration curve implies.
The Infrastructure: Mass-Market Plumbing, Boutique Image
.ai carries a developer-cool reputation. Its plumbing tells a more mainstream story.
| DNS host (primary NS) | .ai apexes | Share of 989,221 |
|---|---|---|
| GoDaddy | 403,538 | 40.8% |
| Cloudflare | 163,914 | 16.6% |
| Namecheap | 95,045 | 9.6% |
| Afternic (for-sale) | 45,957 | 4.6% |
| Vercel | 34,765 | 3.5% |
| Spaceship | 26,130 | 2.6% |
| Sedo parking (for-sale) | 23,196 | 2.3% |
| 19,747 | 2.0% | |
| Atom (for-sale) | 15,939 | 1.6% |
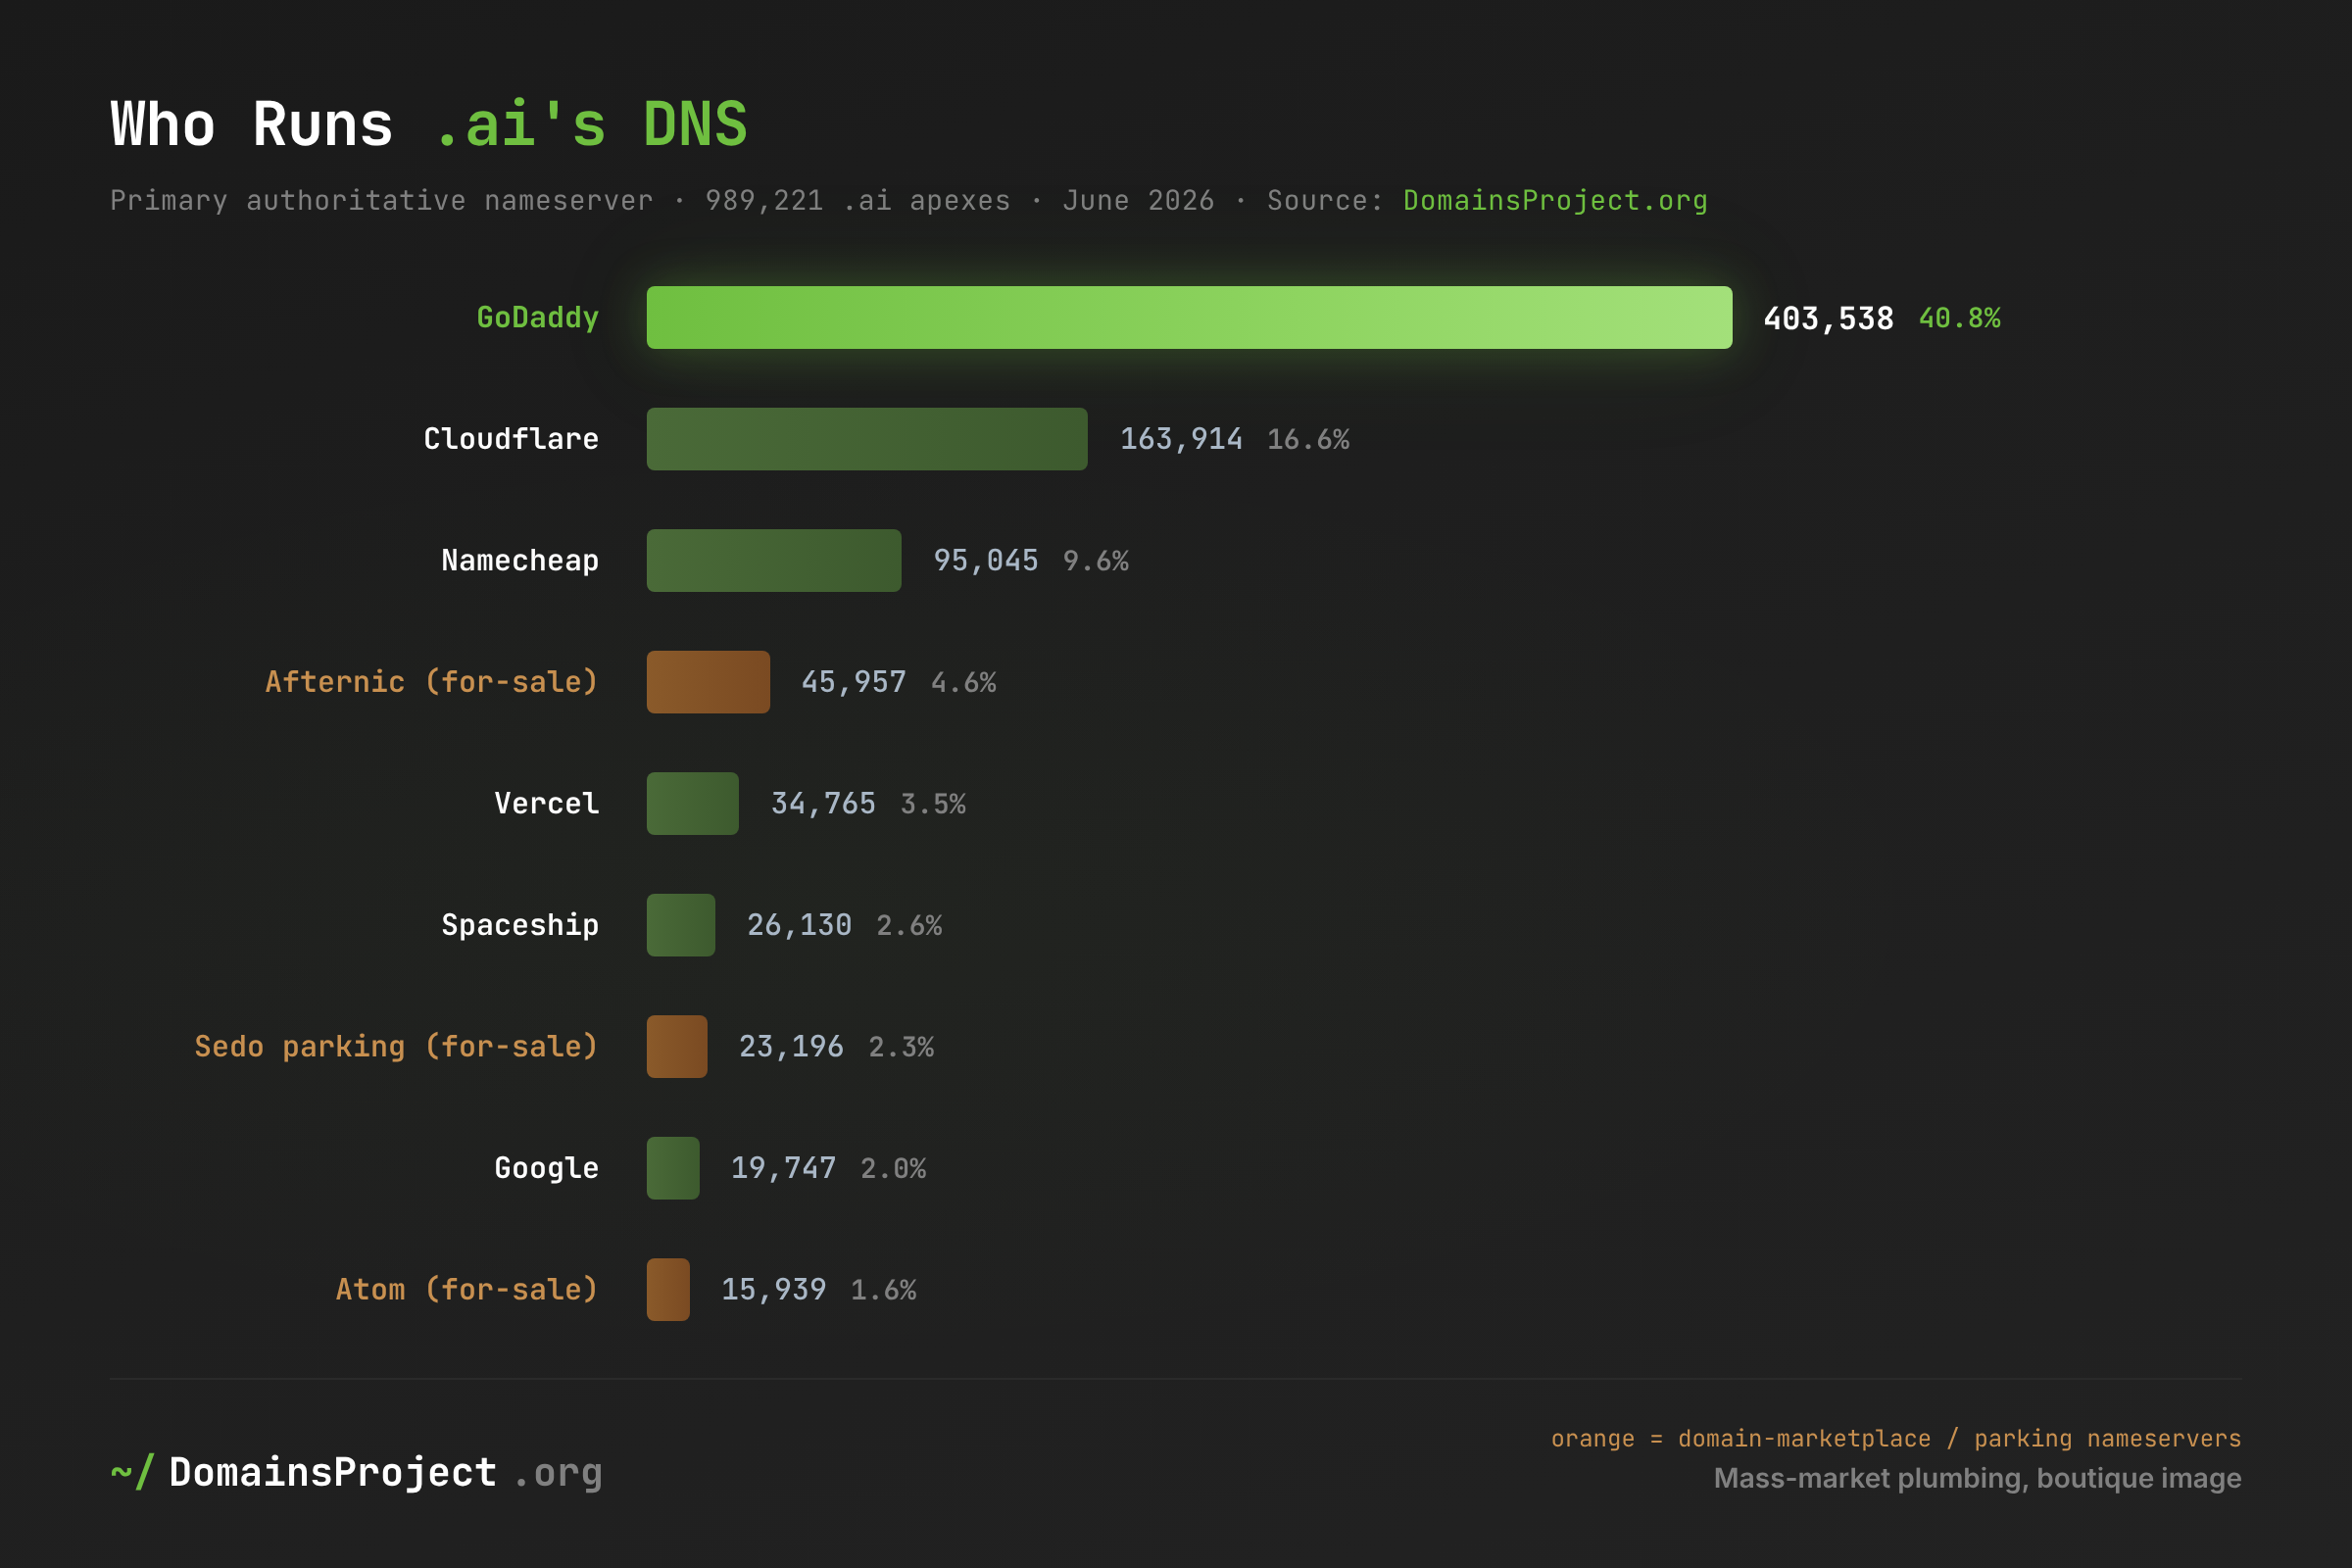
GoDaddy alone authoritatively serves 41% of all .ai domains. Infrastructurally, .ai is a mass-market registrar phenomenon, not the boutique developer namespace its reputation suggests. The modern-deployment slice is real but a minority: Cloudflare (16.6%) and Vercel (3.5%) are where the engineering-forward sites cluster. And the for-sale layer reappears from the NS angle — Afternic, Sedo, and Atom together host ~8.5% of apexes, corroborating the ~9.3% for-sale figure from the funnel using an entirely independent signal.
On email, Google dominates .ai mail (≈585K MX records across google.com/googlemail.com), ahead of Microsoft 365 (~80K) and Cloudflare Email Routing (~53K); Namecheap's private-email/forwarding default inflates the long tail. By hosting geography, .ai A-records point overwhelmingly to the United States, then Germany, with a long international tail — the same US-centric pattern the cohort data predicts below.
The Adoption Curve: Who's Actually Choosing .ai
Our DNS data cannot see funding stage or company identity, so for the cohort question we defer to the best external longitudinal source: Identity Digital's analysis of 4,000+ Y Combinator and Techstars startups (2020 → H1 2025), with batch-level counts from Smart Branding.
| Cohort | .ai share | Basis | Source |
|---|---|---|---|
| 2020 (panel) | ~7% | inferred from "+300%" | Identity Digital |
| 2024 (panel) | 21% | 4,000+ panel | Identity Digital |
| YC W24 (batch) | ~23% | 58 of 248 | Smart Branding |
| H1 2025 (panel) | 28% | 4,000+ panel | Identity Digital |
| YC Fall 2025 (batch) | ~32% | 48 of ~150 | Smart Branding |
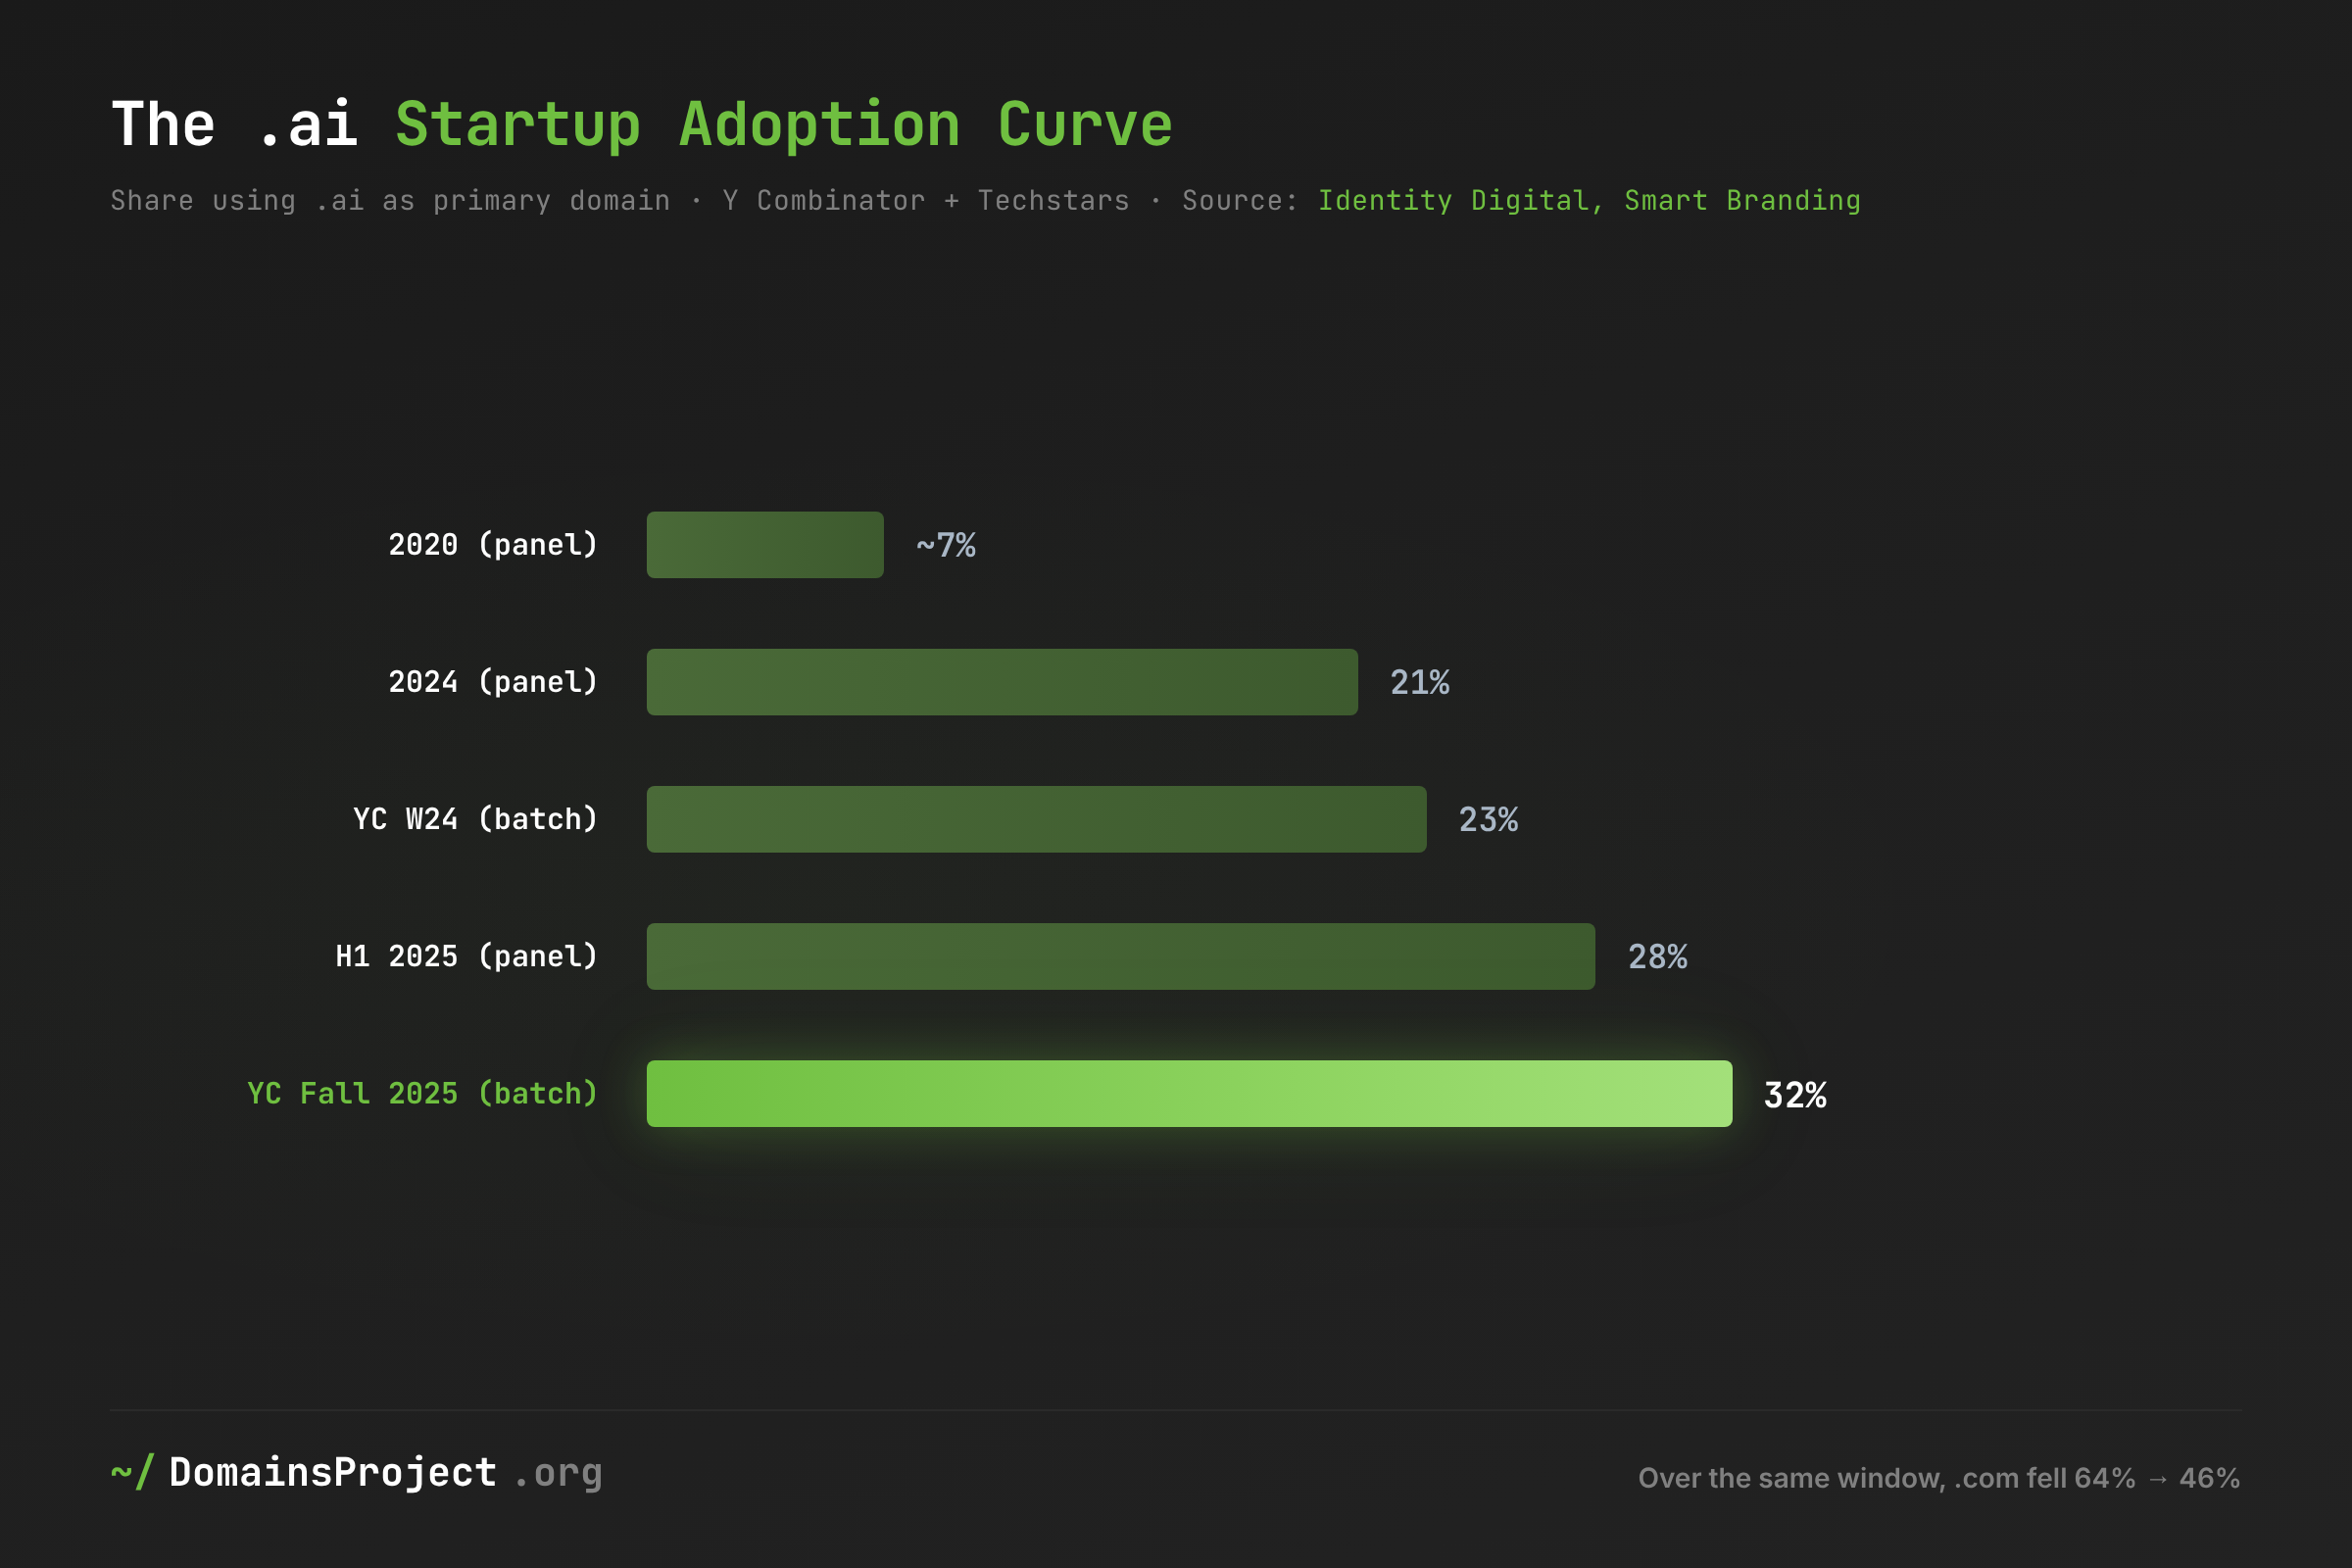
Adoption is real and still climbing — roughly 3 to 4 points per year — but it is a launch signal, not an enterprise standard. Over the same window, .com's share of startup primary domains fell from 64% to 46%. Two cautions the data supports, against the easy "everyone is moving to .ai" reading:
- The norm is dual-hold, not migration. With a ~90% renewal rate and a two-year minimum registration, founders tend to own both — .ai as the brand signal, .com as the defensive hold — rather than graduate from one to the other. There is no measured .ai→.com migration rate; the popular "start on .ai, move to .com after Series A" thesis is asserted, not demonstrated, and the renewal data argues against it. The largest labs that predate the rush (OpenAI, Anthropic) sit on .com regardless.
- Adoption is seed-concentrated and US-centric. The high percentages come from accelerator (pre-seed/seed) cohorts; roughly 60% of .ai registrations originate in the US (corroborated by our hosting-geography finding). A region-by-region adoption rate — what share of US vs European vs Asian AI startups choose .ai — is not published anywhere, and would be a genuinely new measurement.
The Abuse Question: Cleaner Than Its Reputation
Our original post stated that "Spamhaus now flags .ai in its Top 20 worst TLDs." On review against the primary sources, that is a misreading we should correct: .ai entered Spamhaus's Top 20 list of TLDs used in newly registered domains — a popularity ranking — not its poor-reputation ("worst") ranking. Spamhaus's own commentary on the entry was that it is "unlikely this TLD is being used for abuse." The distinction matters, because the corrected picture is the opposite of the original implication.
| TLD | Type | On a Spamhaus / Interisle "most-abused" list? | Reference point |
|---|---|---|---|
| .ai | ccTLD | No — appears only on new-registration lists | ccTLD phishing-score segment ≈14.4 |
| .io | ccTLD | Yes (Spamhaus ccTLD side, ~2,194 listed) | measurably dirtier than .ai |
| .com | legacy gTLD | by raw count (#1, 506,482 listed) | phishing score ≈30/10k |
| .xyz | new gTLD | Yes | high |
| .top | new gTLD | Yes (chronic top-3) | high |
| worst new-gTLDs | new gTLD | Yes — .cfd at 17.5% of zone listed | .xin 10,810/10k; .bond 1,759/10k |
Metrics are not commensurable across columns — Spamhaus counts listed domains, Interisle computes phishing per 10,000 — so read down each column, not across. Russian-administered TLDs excluded.
Across every major structured abuse dataset — Spamhaus reputation, Interisle/Cybercrime Information Center phishing (2022–2025), abuse.ch, ICANN DAAR — .ai is absent from the abuse rankings, and is measurably cleaner than .io. The one direct measurement of .ai abuse composition, Netcraft's November 2023 study, found 845 malicious URLs against 115,245 domains then registered — a domain-level badness ratio well under 0.1%. In abuse.ch's live malware feeds (pulled June 2026), .ai accounts for 122 URLhaus entries all-time and 0.02% of ThreatFox indicators, mostly compromised WordPress on legitimate startup sites.
The structural explanation is economic: a two-year minimum registration (~$140 floor), historically full public WHOIS, a strict acceptable-use policy, and professional registry operation by Identity Digital since January 2025 price out the disposable bulk registration that fills the cheapest gTLDs. And the counter-intuitive twist: the AI-themed scam wave — fake ChatGPT/Claude/Copilot tools, AI investment fraud, deepfake services — overwhelmingly avoids the .ai TLD. Microsoft Threat Intelligence (June 2026) found those campaigns on .com, .org, .shop, and .xyz lookalikes, not .ai. Attackers monetize the theme on cheap infrastructure; the expensive, registry-controlled namespace sees only incidental compromise.
Where .ai abuse is rising is brand disputes, not malware. WIPO cybersquatting cases under .ai went from 50+ in 2023 to 80+ in 2024 (making it the #2 ccTLD by caseload), and CSC reports the share of Forbes Global 2000 brands' .ai domains held by third parties widened from 43% (2023) to 52% (2026). That is an artifact of legitimacy — people squat names that are worth defending — not of criminality.
What's at Stake
- Registration counts overstate the .ai economy by 2–5×. The functional namespace is ~480,000 domains, not a million — material for anyone valuing the TLD, the registry contract, or the aftermarket on "domains under management."
- ~9% of the namespace is openly for sale, measurable from nameservers alone. The aftermarket is not a side market; it is a visible fraction of the zone, and it is exposed to the March 2026 price increase and renewal economics.
- The operating core is genuinely commercial — 6,085 OpenAI-verified, 2,726 Stripe-verified, tens of thousands on Microsoft 365 and transactional mail. This base is unlikely to churn even if speculative registrations lapse.
- Adoption momentum is concentrated at the seed stage and in the US. A funding pullback would slow new .ai registrations faster among accelerator cohorts than among established companies, which mostly never adopted .ai in the first place.
- .ai's clean abuse record is a competitive asset for brand owners and an underappreciated point in registry due diligence — but the rising cybersquatting caseload is a real, growing cost for trademark holders.
What Would Help
- Investors and acquirers: value .ai on utilization, not registrations. "Domains under management" is the wrong denominator. Resolution, mail, and SaaS-verification rates — the funnel above — are the metrics that separate an operating namespace from a speculative one. Apply the ~20–48% active band, not the headline million.
- The registry: publish .ai-specific abuse and renewal statistics. Identity Digital's enforcement reports are portfolio-wide across 270+ TLDs; ICANN's DAAR excludes ccTLDs. A .ai-isolated transparency report would convert .ai's strong-but-invisible abuse record into a documented selling point.
- Brand owners: register and monitor defensively now. With 43%→52% of Global 2000 .ai brand-domains in third-party hands and WIPO caseloads up ~60% year-over-year, the cheapest brand protection is a registration today, not a UDRP filing later.
- Founders: treat .ai as a brand signal, budget for both. The data shows dual-hold is the norm and migration is a myth. Plan to hold the .com defensively from day one rather than assuming a later "graduation."
- Researchers: measure the cohort-migration and regional-adoption questions directly. No public dataset tracks a startup cohort's domains forward through funding rounds, or breaks adoption down by founder region. Both are answerable with the kind of longitudinal DNS data behind this post — explore the .ai statistics page or the full dataset to start.
This analysis used the DomainsProject dataset, which continuously indexes hostnames across the 1,511 active TLDs in the IANA root zone (Russian-administered TLDs excluded). Utilization figures derive from our typed-DNS crawl of June 2026 (A, MX, NS, TXT records) over 1,013,951 registrable .ai roots; growth figures compare against our November 2023 snapshot. Definitions and limitations are in the Methodology section above. External cohort data is from Identity Digital and Smart Branding; abuse data from Spamhaus, Interisle/Cybercrime Information Center, abuse.ch, Netcraft, Microsoft Threat Intelligence, WIPO, and CSC. This post is a follow-up to ".ai Domains and the AI Gold Rush". Explore .ai on our TLD statistics page, browse the full TLD dashboard, or access the complete dataset for your own research.