Fourteen months ago, The Hidden SaaS Map classified every TXT record in a single DNS crawl and built a vendor census from the verification tokens domains leak into DNS. It ended with a confession: "Without a rollback to historical TXT-record snapshots we cannot decompose live-customer from stale-token, and we don't try."
This post rolls the tape. We now hold ten full TXT-typed crawls of the same master corpus, spanning April 2025 to July 2026 — 18.05 billion TXT queries in total — and we re-ran a single, validated classifier over all of them. The snapshot census becomes a ledger: every vendor's token population can be watched growing, decaying, migrating, and fossilizing month by month. Where the original post could only count tokens, this one can tell you when they appeared, whether the domain that holds them is still alive, and whether anyone ever bothers to delete them.
The conventional way to track SaaS momentum is vendor announcements: seats, customers, annualized revenue. Those numbers are self-reported, unit-incompatible, and published on the vendor's schedule. The DNS ledger is none of those things. When a company connects a domain to Google Workspace, Microsoft 365, Claude Enterprise, or a domain marketplace, a vendor-prefixed TXT record appears at its apex — and it appears for everyone who asks DNS, on whatever schedule the asker likes. Watched longitudinally, it becomes an involuntary disclosure feed for the entire SaaS economy.
We classified every TXT answer in all ten crawls against 58 token categories (the full rule table is in the Methodology), deduplicated to the registrable apex per the Public Suffix List, and joined the resulting (vendor, apex) tuples across snapshots — 150+ million tuples per pass. The classifier was rebuilt from scratch and validated against the April 2026 published scorecard: the major categories reproduce to within ±0.5% (Google −0.30%, SPF +0.05%, OpenAI +0.01%, Afternic −0.05%). The rebuild also surfaced two errors in the original census, corrected below — one of which understated Anthropic's footprint by four orders of magnitude.
The headline: the fastest-growing verification token on the Internet is anthropic-domain-verification — from 211 apex domains in April 2025 to 131,812 in July 2026, a 625x increase in fifteen months, and it is being added overwhelmingly by established domains, not new registrations. Meanwhile the single largest movement in the entire ledger was not organic adoption at all: GoDaddy's retirement of Dan.com moved the Afternic token population from 867,594 to 4,450,816 apexes in one quarter, while 374,157 Dan.com tokens still sit in DNS a year after the platform died. And across every major vendor, only 19–29% of month-over-month token disappearances are deliberate removals — the other three quarters happen because the domain itself died. Nobody deletes a verification token.
The Data
| Pass | Crawl date | Result shards | TXT queries | Apex names queried | Apexes with ≥1 TXT answer |
|---|---|---|---|---|---|
| 1 | 2025-04 | 2,488 | 1.64B | 339,256,640 | 131,113,391 |
| 2 | 2025-07 | 2,709 | 1.75B | 359,776,330 | 138,983,424 |
| 3 | 2025-12 | 2,911 | 1.80B | 368,804,253 | 146,184,577 |
| 4 | 2026-01 | 2,930 | 1.79B | 371,151,568 | 147,645,955 |
| 5 | 2026-02 | 2,971 | 1.80B | 372,755,687 | 147,993,015 |
| 6 | 2026-03 | 3,064 | 1.83B | 377,849,646 | 150,205,740 |
| 7 | 2026-04 | 3,105 | 1.86B | 387,649,916 | 154,889,058 |
| 8 | 2026-05 | 3,132 | 1.83B | 381,170,969 | 143,178,117 |
| 9 | 2026-06 | 3,170 | 1.85B | 390,377,563 | 156,050,589 |
| 10 | 2026-07 | 3,204 | 1.90B | 404,049,762 | 150,577,145 |
Each pass queries the full DomainsProject master corpus for TXT records — apex names, www. and other observed hostnames — and each answer string is classified against the vendor-token rule table, then rolled up to the registrable apex of the queried name. The cadence is uneven and we treat it honestly: monthly from December 2025 onward, with an April 2025 baseline and a July 2025 point before a five-month gap. Where a change lands inside the gap, we say so rather than interpolating.
Two passes need flags. The May 2026 pass under-resolved: many vendor populations dip 3–45% and fully recover in June (Afternic implausibly halves and un-halves). We exclude it from trend claims; charts show it as a hollow marker or omit it. The July 2026 pass added 13.7 million new names to the corpus in one month; absolute counts are unaffected but per-corpus shares dilute, which is why all share math below uses TXT-visible apexes as the denominator.
Methodology
What a verification token is. A TXT data string with a vendor-controlled prefix that the vendor instructs a domain owner to publish, usually at the apex, to prove control of the domain: google-site-verification=…, MS=ms…, anthropic-domain-verification-…=…, afternic-verification-…. Each rule maps one prefix to one vendor; a domain counts once per vendor regardless of how many matching records it holds. The unit of analysis is the (vendor, apex) tuple.
Classifier provenance. The original Hidden SaaS Map classifier was lost with its temp directory; we rebuilt it empirically. For every one of the 58 categories, we took example hostnames from the April 2026 classified output, located their raw TXT answers in the archived crawl, and recovered the exact triggering string format. The rebuilt classifier, run on the same April 2026 crawl, reproduces the published scorecard within ±0.5% for every major vendor. Deliberate divergences are restated below.
Restatements of the April 2026 census. Four numbers in the original post change under the rebuilt rules:
| Category | Published (Apr 2026) | Restated | Why |
|---|---|---|---|
| Anthropic | 7 | 63,674 | The original rule only matched a rare anthropic-domain-verification= variant. The actual format is anthropic-domain-verification-<id>=<value>; the original missed essentially the entire population. |
| "HubSpot" | 56,735 | 50,569, relabeled Salesforce Pardot | The tokens are pardot<id>=… and sending_domain<id>=… — Salesforce Account Engagement's DNS validation keys (Pardot's post-2022 name). HubSpot verifies sending domains with DKIM CNAMEs, not apex TXT tokens. The original count also appears to have swept SPF include: strings mentioning pardot.com. |
| Atlassian | 230,746 | 230,964 | Rule now explicitly covers both atlassian-domain-verification= and atlassian-sending-domain-verification=. |
| Adobe | 72,673 | 75,910 | Rule covers both adobe-idp-site-verification= and adobe-sign-verification=. |
Definitions used throughout.
- TXT-visible — an apex whose query returned at least one TXT answer in that pass. This is the share denominator (it is robust to corpus growth).
- Retained / added / dropped — presence changes of a (vendor, apex) tuple between adjacent passes.
- added_visible vs added_new — an added token on an apex that was already TXT-visible in the prior pass (an existing, live domain adopted the vendor) versus on an apex that was not (a new domain, a newly TXT'd domain, or corpus growth).
- dropped_visible vs dropped_dark — a token that disappeared while the apex remained TXT-visible (deliberate DNS edit) versus a token that disappeared because the apex left the TXT-visible universe entirely (expired, went dark, or lost all its TXT records at once).
- 15-month retention — of the apexes carrying a vendor's token in April 2025, the share still carrying it in July 2026.
Known limitations. CNAME-verifying vendors (Cloudflare, Mailgun, SendGrid's main flow) are structurally invisible here, as in the original census. Tokens measure domain-level relationships, not paid seats — and, as this post quantifies for the first time, they persist long after the underlying subscription: treat every absolute count as cumulative-adoption-minus-domain-death, not current customers. Chinese marketplace tokens (west.cn, 17ex.com) resolve inconsistently across passes — 17ex tokens appear in only one of ten crawls — so we exclude them from longitudinal claims. Russian-administered TLDs are excluded from all counts per project policy. Single-pass response variance is roughly ±1–2%; we never read a single month-over-month wiggle as signal, and the flagged May 2026 pass is excluded from all trend claims.
Reproducibility. The full vendor × snapshot matrix is downloadable: saas-ledger-trend-matrix.csv. Each chart below links its own CSV. The classifier is ~250 lines of Go (streaming xz JSONL reader, prefix-dispatch rule table, PSL apex rollup); the flux decomposition is a sorted merge over per-snapshot (vendor, apex) tuple files. The active dataset is available at domainsproject.org/dataset.
The Scorecard
Unique apex domains carrying each vendor's token, at four points of the series, with the change in share per 1,000 TXT-visible apexes — the normalization that removes the corpus's own +19.1% growth.
| Vendor | Apr 2025 | Dec 2025 | Apr 2026 | Jul 2026 | Abs. change | Share/1,000: Apr'25 → Jul'26 |
|---|---|---|---|---|---|---|
| 20,111,507 | 23,726,745 | 25,909,101 | 26,853,544 | +33.5% | 153.4 → 178.3 | |
| Microsoft 365 | 6,782,524 | 7,360,299 | 7,773,356 | 7,673,828 | +13.1% | 51.7 → 51.0 |
| Meta (Facebook) | 1,257,225 | 1,152,008 | 1,153,889 | 1,120,377 | −10.9% | 9.6 → 7.4 |
| Zoho | 833,246 | 1,070,443 | 1,230,254 | 1,312,482 | +57.5% | 6.4 → 8.7 |
| Brevo | 684,136 | 927,348 | 1,120,427 | 1,253,190 | +83.2% | 5.2 → 8.3 |
| Yahoo | 330,713 | 524,815 | 611,573 | 687,913 | +108.0% | 2.5 → 4.6 |
| Apple | 343,049 | 424,478 | 484,818 | 521,832 | +52.1% | 2.6 → 3.5 |
| Yandex | 250,468 | 278,980 | 305,674 | 332,751 | +32.9% | 1.9 → 2.2 |
| Klaviyo | 183,261 | 232,179 | 260,630 | 268,964 | +46.8% | 1.4 → 1.8 |
| Atlassian | 192,690 | 213,030 | 230,964 | 228,297 | +18.5% | 1.5 → 1.5 |
| OpenAI | 105,471 | 182,881 | 206,959 | 214,305 | +103.2% | 0.8 → 1.4 |
| Anthropic | 211 | 4,851 | 63,674 | 131,812 | +62,370% | 0.002 → 0.9 |
| 145,162 | 163,463 | 175,032 | 175,993 | +21.2% | 1.1 → 1.2 | |
| Stripe | 79,950 | 88,392 | 96,765 | 98,422 | +23.1% | 0.6 → 0.7 |
| Salesforce Pardot | 45,917 | 48,631 | 50,569 | 48,914 | +6.5% | 0.35 → 0.32 |
| TikTok | 6,775 | 16,223 | 28,860 | 41,593 | +513.9% | 0.05 → 0.28 |
| Notion | 5,776 | 10,062 | 12,915 | 14,089 | +143.9% | 0.04 → 0.09 |
The corpus grew 19.1% over the window and the TXT-visible population grew 14.8% — so any vendor below roughly +15% absolute growth is actually standing still or shrinking in share. That one sentence reorders the entire table: Microsoft 365's +13.1% is a flat share (51.7 → 51.0 per 1,000); Pardot's +6.5% is decline; Meta's −10.9% absolute is a 22% share loss, the largest of any major vendor. The unambiguous share gainers are Google, the productivity challengers (Zoho, Brevo), Apple, Yahoo, and the entire AI tier.
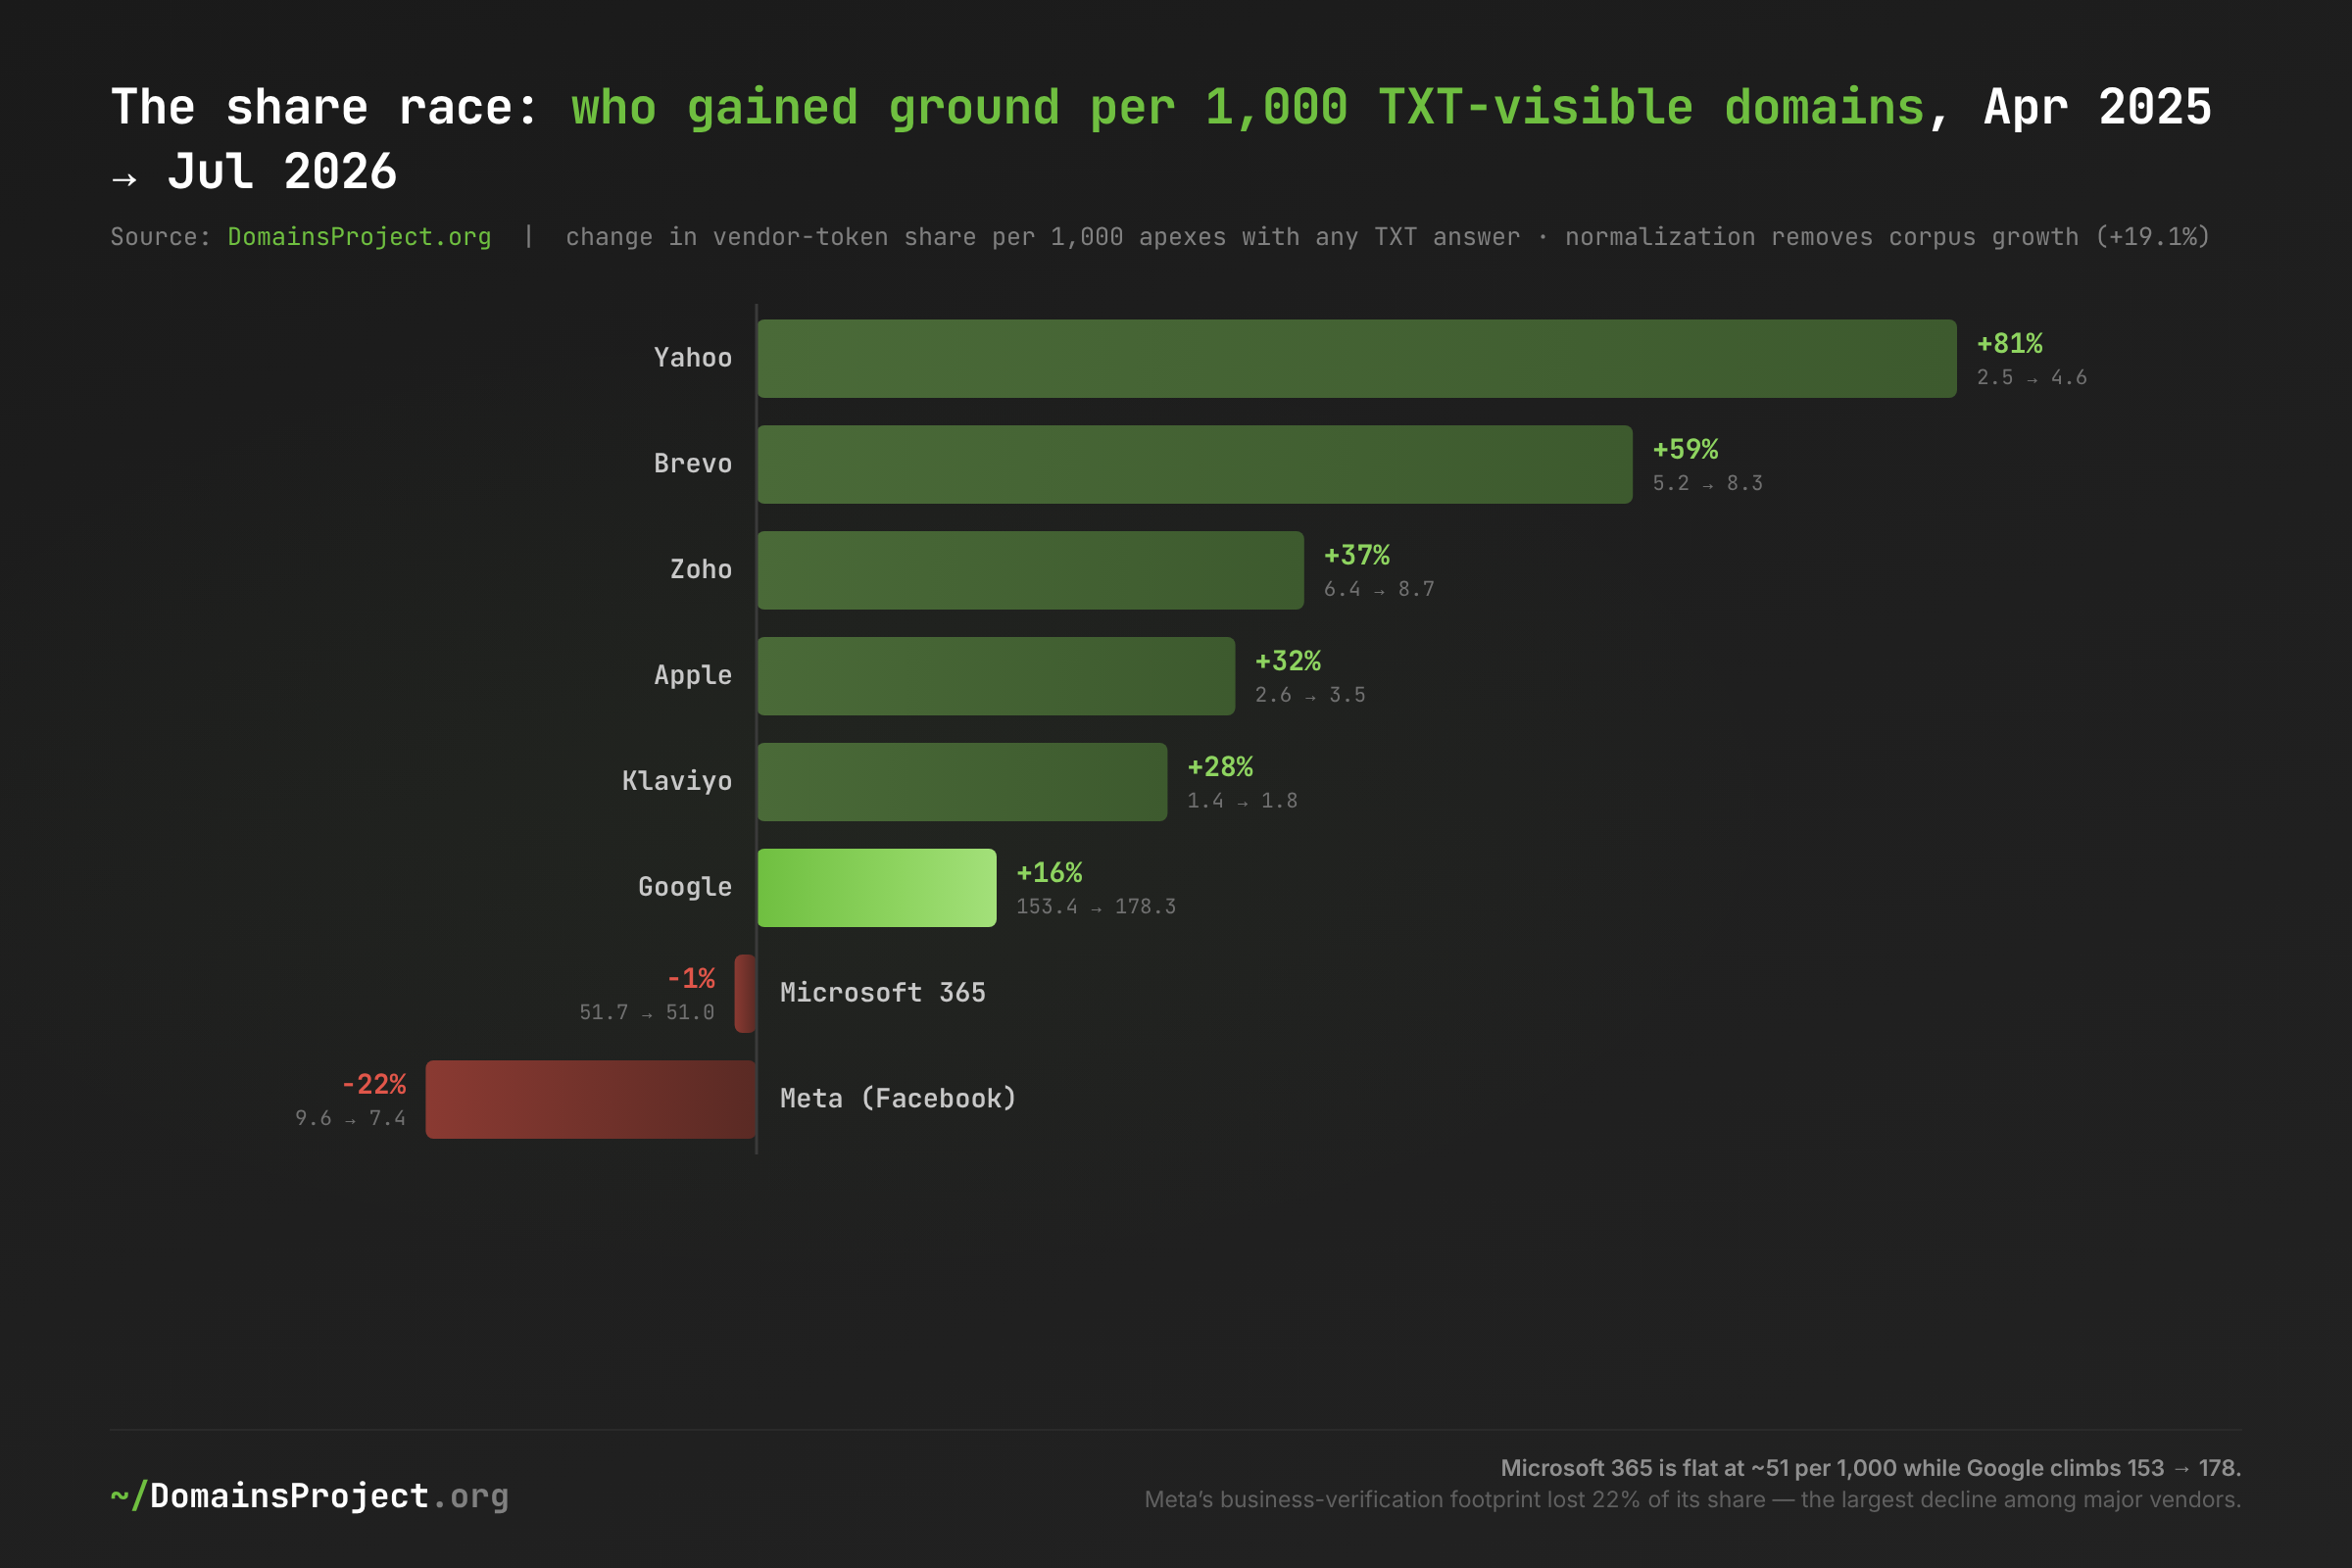
Download: saas-ledger-share-race.csv — share per 1,000 apexes with ≥1 TXT answer; corpus-growth-neutral.
The units matter here, and they cut in different directions per vendor. Microsoft reports 450 million paid Microsoft 365 seats (January 2026); Google reports 11 million paying Workspace customers (December 2025). Seats measure employees; the DNS ledger measures organizations with domains — and a Google token additionally covers free Search Console, which is why Google's 26.9 million dwarfs its paying-customer count. The ledger's honest reading is not "Google is 3.5x Microsoft's business" but "3.5x as many domains name Google in their DNS as name Microsoft — and that multiple is widening": 3.0x in April 2025, 3.5x in July 2026. Microsoft's growth engine is seats inside existing tenants; Google's is new domains. Zoho's curve triangulates cleanly against its own disclosure: one million paying customers announced February 2026, against 1.31 million token domains in our July pass — same order, consistent with tokens counting cumulative-ever adoption slightly above current customers. Brevo's 1.25 million tokens against ~600,000 self-reported customers shows the same inflation factor of roughly 2x that stale tokens produce for a decade-old company that rebranded (the rule counts both brevo-code: and legacy sendinblue-code:).
The AI Curve: 211 to 131,812
The original census caught the AI tier at the moment of ignition and — due to the classifier bug restated above — dramatically understated it. Corrected and rolled forward, anthropic-domain-verification is the fastest-growing token we have ever measured.
| Snapshot | Anthropic | OpenAI |
|---|---|---|
| 2025-04 | 211 | 105,471 |
| 2025-07 | 647 | 131,101 |
| 2025-12 | 4,851 | 182,881 |
| 2026-01 | 6,083 | 187,174 |
| 2026-02 | 12,793 | 190,394 |
| 2026-03 | 27,920 | 196,952 |
| 2026-04 | 63,674 | 206,959 |
| 2026-06 | 115,507 | 217,742 |
| 2026-07 | 131,812 | 214,305 |
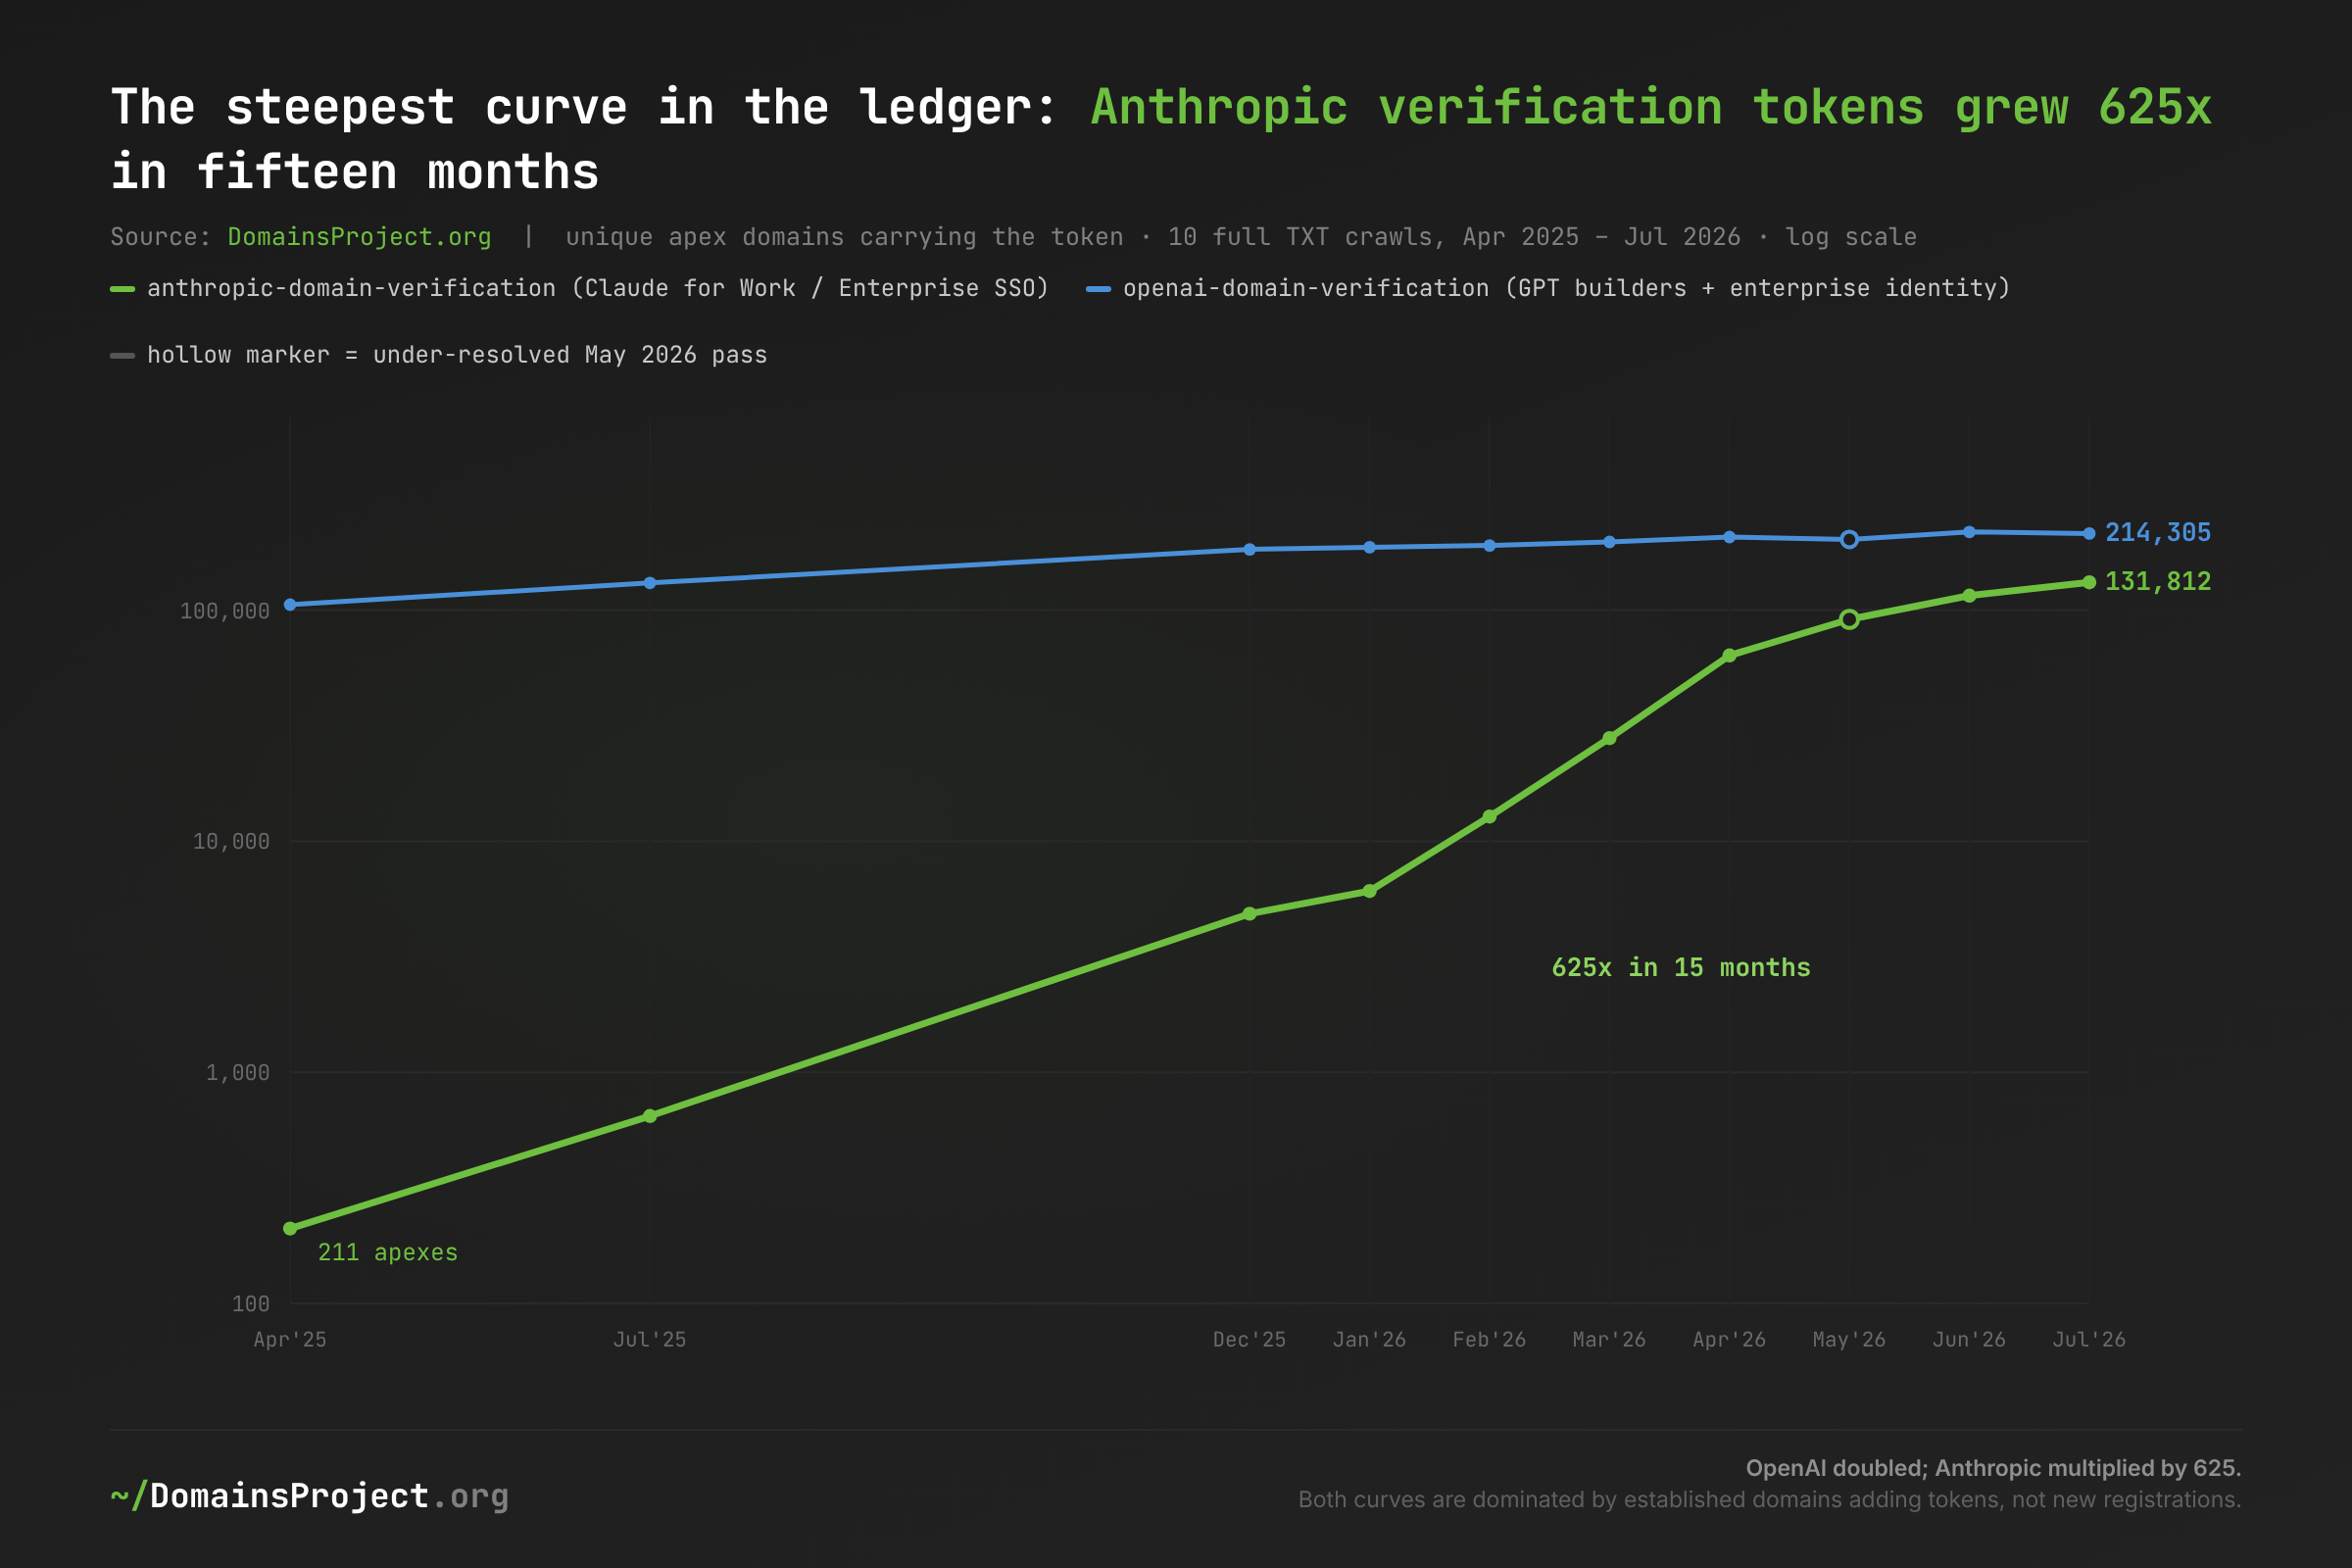
Download: saas-ledger-ai-curve.csv — May 2026 pass shown but under-resolved.
The Anthropic token is a Claude for Work artifact — it must be published at the apex for Team/Enterprise domain claiming and SSO — and Claude Enterprise only launched in September 2024, so our window captures essentially the entire lifetime of the product's domain footprint. The curve steepens exactly where Anthropic's business news does: the doubling from 12,793 (February) through 27,920 (March) to 63,674 (April 2026) brackets the company's reported $30B revenue run-rate of April 2026, and the continued climb coincides with the rollout of domain capture for Enterprise (documented June 2026), which gives organizations a concrete reason to verify. Against Sacra's estimate of 300,000+ business customers, 131,812 verified domains is the right order for a verification step that only Team and Enterprise tiers perform.
OpenAI's curve tells a maturity story instead. Its token — used for GPT Builder profiles and enterprise identity/SSO — doubled from 105,471 to 214,305 over the window, tracking the company's disclosed business-user ramp (2M in February 2025, 3M in June, 5M by August, 1M business customers by November). But the growth decelerates visibly through 2026 while Anthropic's compounds — and the cohort data adds a wrinkle: a quarter of the domains that carried an OpenAI token in April 2025 no longer carry it in July 2026 (74.7% retention), consistent with the 2024 GPT-Store builder wave receding while the enterprise SSO wave replaces it. Anthropic's earliest 211 adopters, by contrast, retain at 87.7%.
Who is doing the adopting? The flux decomposition answers this cleanly. In the March→April 2026 pair, 93% of Anthropic's 36,788 additions were added_visible — domains that already existed and were already TXT-visible a month earlier. Google's additions in the same pair were 78% added_new. The AI-enterprise wave is not new domains being born; it is the existing installed base of businesses — 56% of Anthropic token holders sit on .com, with .org, .au, .de, .ai, and .io following — bolting a new vendor onto DNS zones they already run. The AI gold rush measured in new .ai registrations and the AI adoption measured here are different populations: the former is speculation, the latter is procurement.
The Marketplace Re-Plumb: When Five Million Tokens Move at Once
The largest single movement in the ledger was not adoption at all.
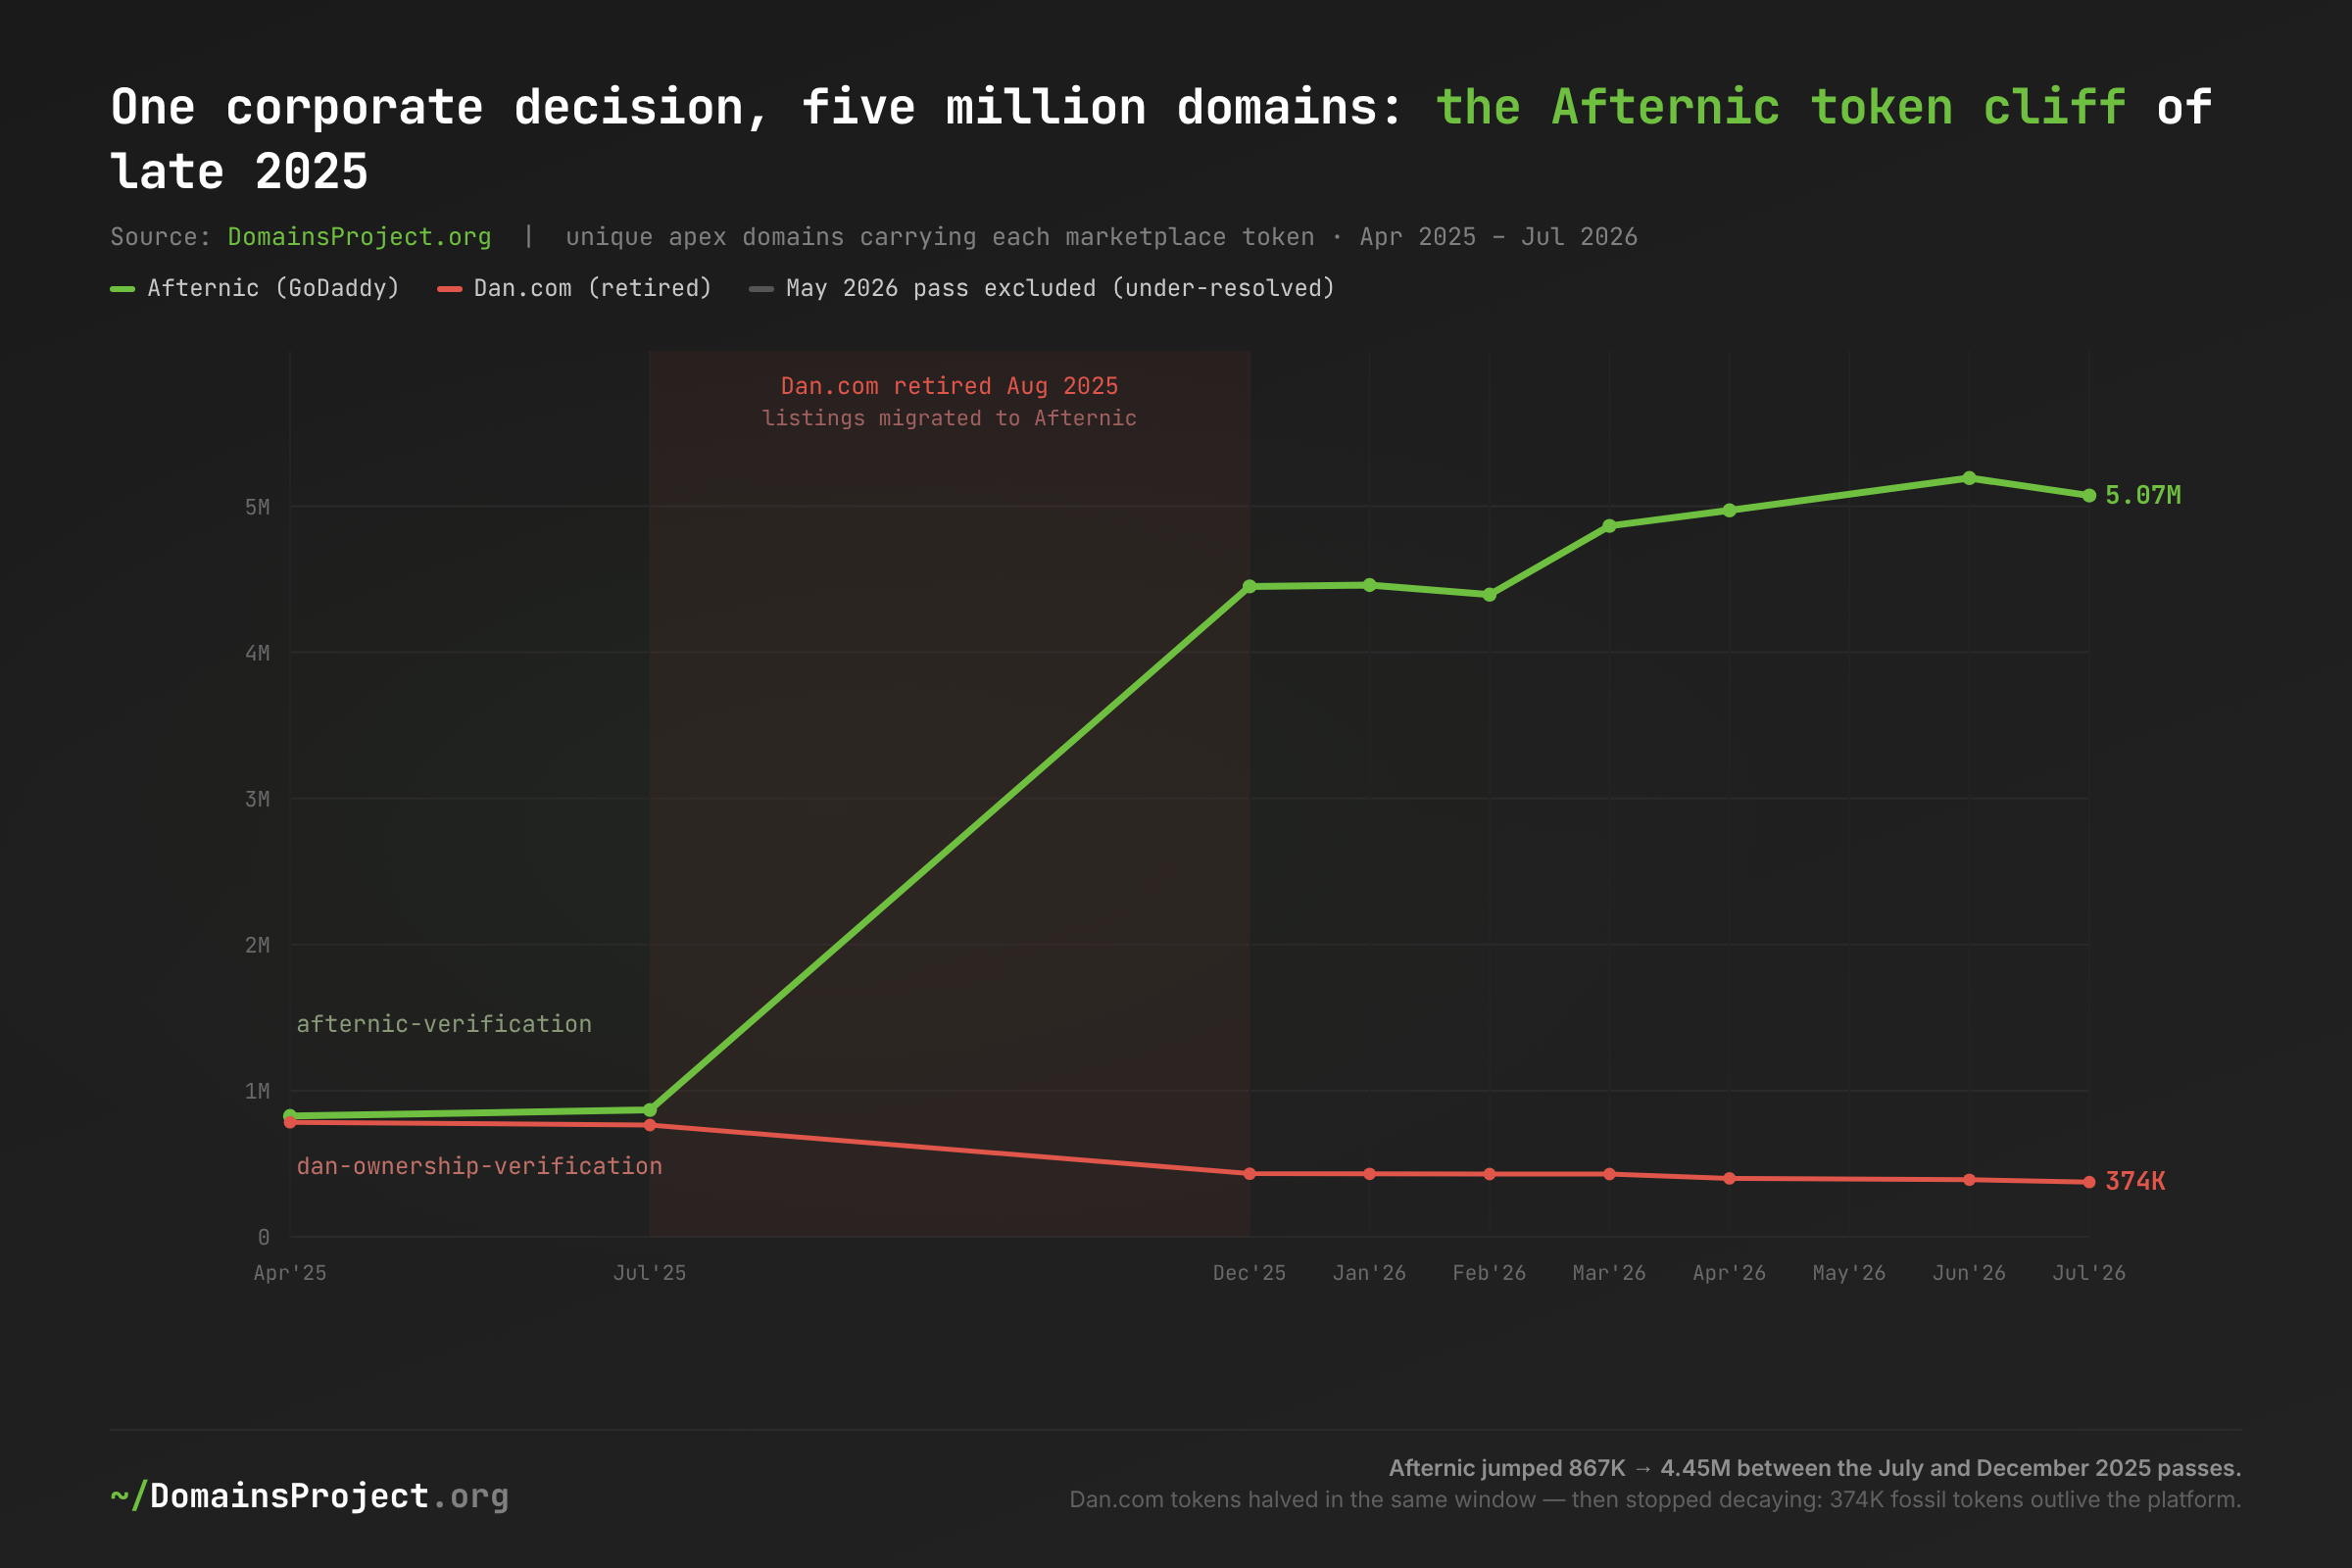
Download: saas-ledger-marketplace.csv — May 2026 pass excluded as under-resolved.
GoDaddy announced in September 2024 that Dan.com would be retired and its listings folded into Afternic; by August 2025 dan.com redirected to Afternic. The ledger watched it happen: between our July and December 2025 passes, afternic-verification tokens quintupled from 867,594 to 4,450,816 apexes, and dan-ownership-verification tokens fell from 765,047 to 432,136. No organic sales funnel adds 3.6 million verified domains in a quarter — this is a platform-side migration re-verifying an inherited inventory, visible in DNS as a step function. (GoDaddy's aftermarket segment grew 28% year-over-year in Q3 2025 — healthy, but a different order of magnitude than 5x.)
The Dan.com side is the more scientifically valuable curve, because August 2025 gives it a known death date — a controlled experiment in token decay. During the shutdown quarter, 53% of Dan token losses were dropped_visible — live domains actively editing DNS, the signature of sellers and registrars cleaning up during migration. It is the only vendor-quarter in our entire series where deliberate removal outran domain death. Then the cleanup stopped: through 2026 the population decays at just 2–3% per month, three quarters of that from domain death, and 374,157 domains still carry the token of a marketplace that no longer exists — 75% of them holdovers from before the shutdown. Extrapolated at the current decay rate, Dan.com tokens will outlive their platform by well over a decade.
Nobody Deletes a Verification Token
The Dan.com fossils are not an anomaly. They are the rule, and the flux decomposition proves it across every vendor.
| Vendor (five clean 2026 pairs) | Deliberate removals | Domain went dark | Removal share |
|---|---|---|---|
| Dan.com — shutdown quarter, Jul–Dec 2025 | 200,695 | 177,078 | 53% |
| Anthropic | 4,416 | 5,231 | 46% |
| OpenAI | 16,091 | 29,176 | 36% |
| Dan.com — 2026 steady state | 47,481 | 92,300 | 34% |
| Brevo | 54,754 | 134,730 | 29% |
| Afternic | 317,033 | 912,516 | 26% |
| Meta (Facebook) | 64,832 | 204,343 | 24% |
| Zoho | 67,757 | 223,527 | 23% |
| SPF records | 8,515,352 | 32,240,583 | 21% |
| 1,111,903 | 4,581,688 | 20% | |
| Microsoft 365 | 244,452 | 1,022,606 | 19% |
| Klaviyo | 9,287 | 39,533 | 19% |
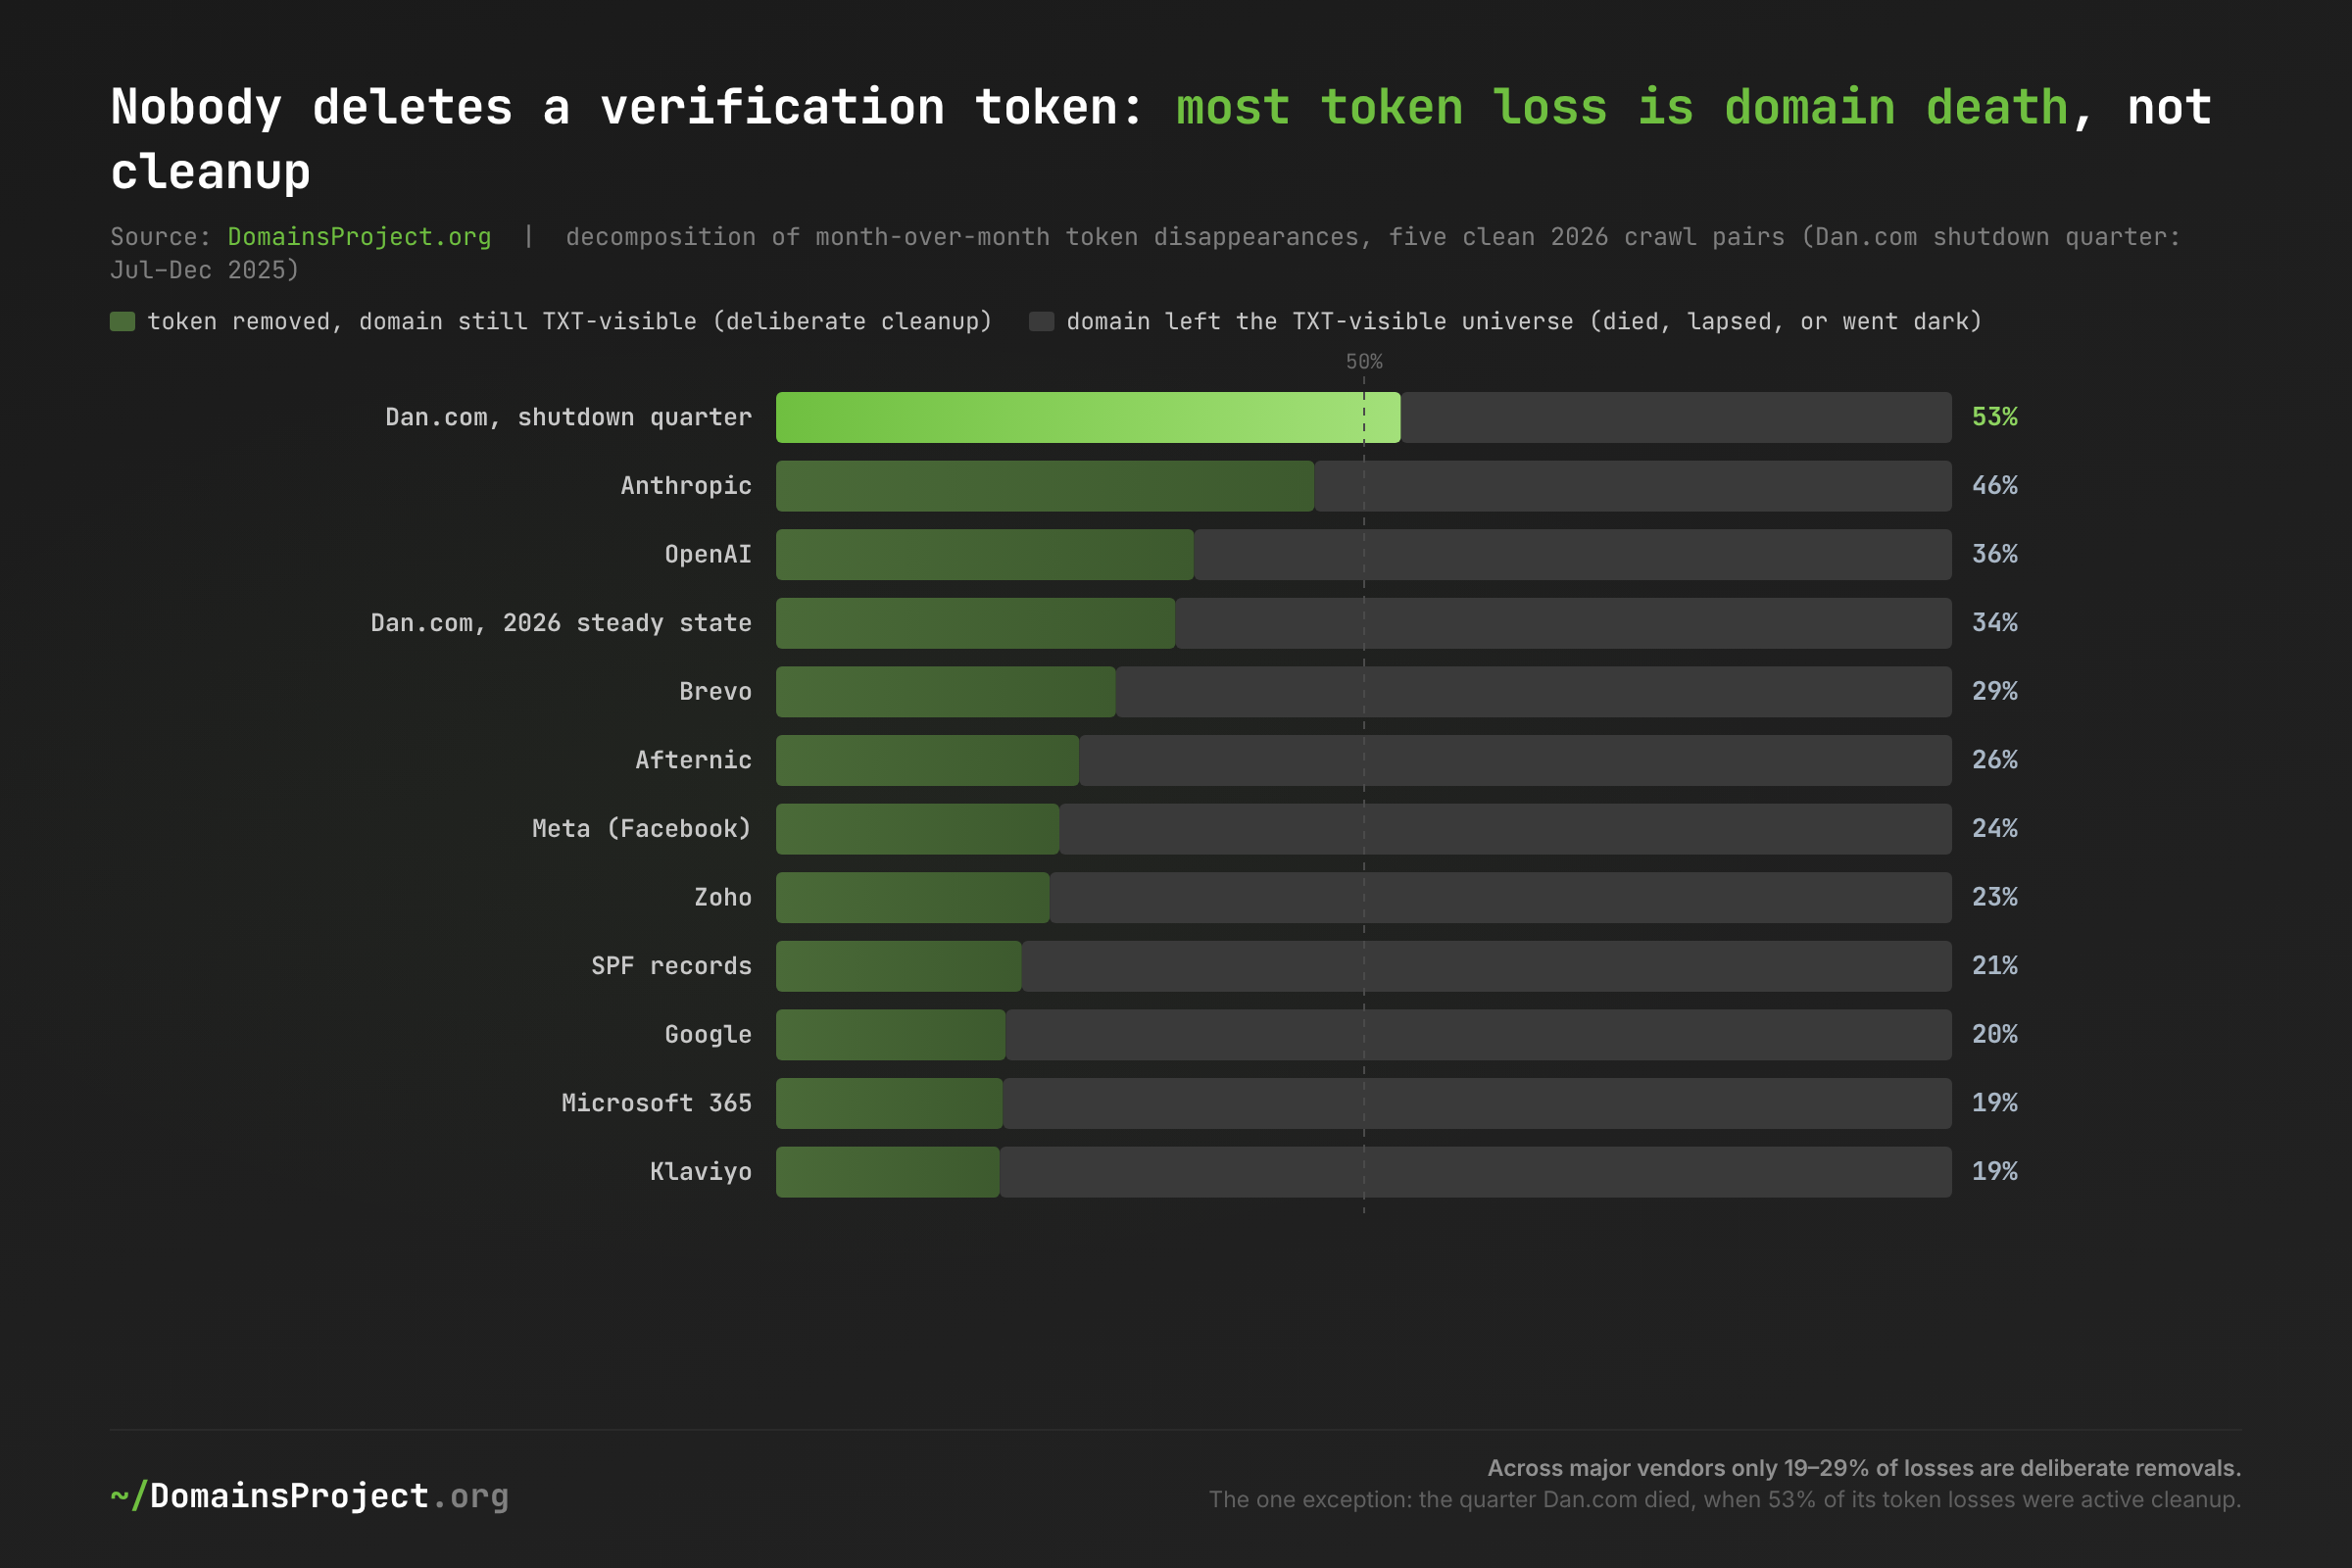
Download: saas-ledger-churn.csv — decomposition sums the five clean 2026 crawl pairs; Dan.com shutdown row covers Jul–Dec 2025.
For the incumbent platforms, four out of five token disappearances happen because the domain itself left the Internet, not because anyone edited a zone file. Google's ledger lost roughly 5.7 million tokens across the five clean 2026 pairs; 4.6 million of those losses were domains going dark — the background mortality documented in The Half-Life of a Domain — and only 1.1 million were deliberate. The AI vendors run hotter (36–46% deliberate), consistent with young deployments still being reconfigured. The pattern quantifies, for the first time we know of, the caveat that offensive-security practitioners have long exploited: the TXT layer is an append-mostly ledger of every vendor relationship a domain has ever had. A CCS 2025 measurement poster argued verification tokens disclose sensitive business relationships; our series adds the temporal dimension — the disclosure persists years past the relationship, because the economic incentive to add a token (a verification flow that blocks onboarding) has no counterpart on removal.
The fifteen-month retention table makes the same point from the cohort side:
| Vendor | Apr 2025 cohort | Still carrying token, Jul 2026 | Retention |
|---|---|---|---|
| Notion | 5,776 | 4,969 | 86.0% |
| Anthropic | 211 | 185 | 87.7% |
| Microsoft 365 | 6,782,524 | 5,718,678 | 84.3% |
| Klaviyo | 183,261 | 151,080 | 82.4% |
| OpenAI | 105,471 | 78,808 | 74.7% |
| 20,111,507 | 14,876,396 | 74.0% | |
| SPF (apex) | 119,377,324 | 88,211,898 | 73.9% |
| Afternic | 826,578 | 561,285 | 67.9% |
| Meta (Facebook) | 1,257,225 | 838,984 | 66.7% |
| TikTok | 6,775 | 4,554 | 67.2% |
| Zoho | 833,246 | 540,034 | 64.8% |
| Dan.com | 783,216 | 282,044 | 36.0% |
| Hostinger expired-domain notice | 151,303 | 4,454 | 2.9% |
The bottom row is the control group that proves the method: Hostinger's "This domain is expired!" TXT notice is a transient state, not a relationship, and its cohort retention collapses to 2.9% — expired domains get re-registered or dropped. Everything above it is sticky in proportion to how enterprise-shaped its customer base is: Microsoft 365 (84.3%) outlasts Google (74.0%) because tenant domains are corporate assets while Search Console verifications ride the long tail of the web's mortality.
One Operator Moves the Ledger: The Jimdo Cliff
A longitudinal census also inherits a longitudinal hazard: a single infrastructure operator can move a population by an order of magnitude, and an unwary analyst will read it as a market trend. Our series contains a perfect specimen.
The Kubernetes ExternalDNS heritage marker (heritage=external-dns,external-dns/owner=…) — the signal behind The Kubernetes Census Hiding in DNS — collapsed from 354,357 apexes in July 2025 to 47,015 in December 2025, and has been stable around 42–47K since. Decomposing the 312,153 dropped apexes: the population is dominated by .de, .ch, .at, .fr, and .jp small-business sites; the vanished records overwhelmingly carried external-dns/owner=wl-prod-eu-west-1; and sampled dropped domains are Jimdo-built sites. One website builder — Jimdo, whose DACH-plus-Japan footprint matches the TLD distribution exactly — stopped publishing ExternalDNS markers for its customer estate, and 88% of the global "Kubernetes visible in DNS" signal disappeared with it. The domains did not die; they remain TXT-visible. Their host simply re-plumbed its DNS automation.
Two lessons follow. First, our own May 2026 Kubernetes census — which counted 41,565 ExternalDNS apexes from the April 2026 crawl — measured the post-Jimdo baseline; run six months earlier it would have reported eight times the footprint, with the same methodology and the same confidence. Snapshot censuses date-stamp their own validity. Second, marker populations conflate "how many operators use the technology" with "how many domains the largest such operator hosts." The 42K steady state is arguably the more honest number for Kubernetes-operator diversity: it counts thousands of independent clusters rather than one white-label platform. This is the same lesson the Afternic cliff teaches about marketplaces, and it generalizes: in vendor-token measurement, the tail is organic; the steps are corporate.
The Mandate Plateau: SPF's Flat Year
A State of TXT measured email authentication as a snapshot funnel. The ledger adds the trend, and the trend is a plateau.
Apex SPF records grew from 119.4 million (April 2025) to 135.6 million (July 2026) in absolute terms — but as a share of queried apexes the line is flat: 35.2% → 36.2% across the fifteen months, with every 2026 pass landing between 36.0% and 36.2% (the two lower prints, May and July 2026, are the degraded pass and the corpus-injection dilution respectively, not adoption reversals). The February 2024 Google/Yahoo bulk-sender mandate and Microsoft's May 2025 high-volume-sender enforcement fall inside or just before our window, and neither produces a visible inflection: the domains that were ever going to comply had largely complied before our series begins.
External measurements agree once denominators are aligned. DMARCguard's February 2026 Tranco study finds SPF on 56.0% of 5.5 million active, ranked domains; our 36% covers 404 million known names including the parked and the dying, and our own SPF cohort loses 26% to domain death over the window. Valimail's 2026 report describes DMARC enforcement as "plateaued" at 42% of its panel — the same shape we see at the SPF layer. The mandate era moved email authentication from growth story to maintenance story in under two years; the remaining SPF-less majority is dominated by domains that send no mail and answer to no mandate.
What's at Stake
- SaaS market share now has an involuntary, unit-consistent scoreboard — vendor announcements count seats or customers on the vendor's schedule; the DNS ledger counts organizations-with-domains on anyone's schedule, and it moves months before earnings calls narrate it. Anthropic's Q1 2026 acceleration was in public DNS by March.
- Verification tokens are an append-mostly disclosure of vendor relationships, past and present — with only 19–29% of removals being deliberate, a domain's TXT record set approximates its cumulative procurement history. Security teams should treat their own apex TXT records as an attack-surface document that an adversary reads for free — and one that this series shows almost nobody audits.
- Marketplace and platform token populations are corporate-action seismographs — the Dan.com→Afternic migration (5M tokens), the Jimdo ExternalDNS exit (312K apexes) and the Hostinger expired-notice churn (doubling to 313K, 97% annual cohort turnover — the parked-web flow documented in The Parking Lot) all register as step functions that dwarf organic drift. Any analyst using single-snapshot token counts inherits whichever side of a step their crawl happened to land on.
- The AI tier's adoption is qualitatively different from the AI TLD boom — 93% of Anthropic's additions are established, already-TXT-visible domains, versus 78% brand-new apexes for Google's. Enterprise AI procurement is landing on the existing corporate web, not the speculative one — a distinction invisible to registration-count analyses.
- Stale tokens systematically inflate every SaaS census, including ours — Brevo's token population runs 2x its self-reported customer count; Dan.com's runs 374K against a true count of zero. Point-in-time token counts are ceilings on live adoption; only decay curves separate the living from the fossil record.
What Would Help
1. Security teams: audit your apex TXT records annually. The ledger says almost nobody does — deliberate removals run below 2% of population per month for every incumbent vendor. Every fossil token names a vendor relationship (or a lapsed one) to anyone with dig. Stale entries for platforms you have left are both an information leak and, for tokens tied to re-claimable accounts, a takeover primitive.
2. SaaS vendors: expire your verification tokens. Verification flows check the token once and never again, which is why 374,157 domains still "verify" for a dead marketplace. Scoped, dated token formats (vendor-verification-2026Q3-…) or periodic re-verification would make the DNS ledger reflect live relationships — and would make vendor-side domain-ownership claims (SSO, domain capture) materially safer.
3. Market analysts: normalize token counts by a TXT-visible denominator and demand two snapshots minimum. The corpus underneath any DNS census grows; absolute token growth below the corpus growth rate is share loss. Microsoft 365's +13% over our window reads as growth until normalization reveals a flat 51 per 1,000. A single-snapshot count cannot distinguish a 5x organic market from one Afternic-style migration.
4. Internet measurement researchers: treat operator concentration as a first-class error term in marker-based censuses. Our Kubernetes signal was 88% one company. Before reporting "N domains use technology X," decompose by operator (ExternalDNS conveniently ships an owner= field; other markers have provider-specific tells) and report the concentration alongside the count. We will adopt this practice in our own future censuses.
5. AI platform vendors: publish domain-verification counts. OpenAI discloses business seats and customer counts; Anthropic discloses revenue multiples. Verified-domain counts — which both companies possess exactly and which DNS approximates publicly anyway — are the cleanest cross-vendor adoption unit the industry could have. The ledger will keep score either way.
This analysis is based on ten full TXT-typed DNS measurement passes of the DomainsProject master corpus (2.49–3.20 thousand result shards per pass, 18.05 billion TXT queries in total) crawled between 10 April 2025 and 11 July 2026, classified with a single 58-category vendor-token ruleset validated to ±0.5% against the published April 2026 census, and joined per registrable apex across snapshots. Russian-administered TLDs are excluded throughout. Charts and per-chart CSVs are linked above; the full vendor × snapshot matrix is at saas-ledger-trend-matrix.csv. Explore the dataset at domainsproject.org/dataset and the per-TLD statistics at /stats/.