Every few months the same question trends for a day. A configuration error at Cloudflare, a capacity event in an AWS region, a bad update from CrowdStrike — and for a few hours large parts of the web go dark together, the outage maps light up, and the headline writes itself: does one company control the Internet? Then the services come back, the question fades, and nobody answers it with a number.
There are two usual ways to answer, and both miss. The first is the revenue league table — cloud-infrastructure market share, productivity-suite seats, CDN billings — which measures who captures the most money, a quantity that lives in the enterprise and says little about the hundreds of millions of ordinary domains that make up the actual Internet. The second is vibes: a sense that "Big Tech" owns everything, untethered from any measurement of the plumbing itself. Antitrust regulators, the EU's Digital Markets Act, and a decade of single-points-of-failure outages have all sharpened the question, and none of the answers measure the thing the outages actually break: the core infrastructure layers — naming, mail, hosting, and the proxy edge — that every site depends on whether or not it generates a dollar.
So we measured them. Over the past two months DomainsProject ran four full-corpus, typed-DNS censuses against the same master dataset of roughly three billion hostnames — one pass each for the NS record (who runs your DNS), the MX record (who runs your email), the A record (where your site is hosted), and the AAAA/CNAME records (which CDN or proxy fronts you). Each was published on its own; this post is the synthesis that puts them on one scale. We call that scale the Internet Concentration Index, and this is its 2026 baseline — the first edition of what is designed to be an annual measurement. Every figure is counted one domain, one vote, so a parked blog weighs the same as a Fortune 500 homepage; Russian-administered TLDs are excluded throughout, per project policy.
The headline is that no single company controls the Internet — and that the structure underneath that reassuring fact is more fragile, not less, than a monopoly would be. Four different companies top the four core layers: GoDaddy runs the most DNS (18.9% of delegated domains), Google the most email (13.2% of mail-capable domains), Amazon the most hosting (15.9% of resolving domains), and Cloudflare the most of the CDN/proxy edge (44.7% of all domains that publish IPv6). The company most synonymous with "owning" enterprise IT, Microsoft, is a rounding error in every one of these domain-count censuses. But the layers do not concentrate the same way — the edge you cannot see is a near-monopoly while email refused to concentrate at all — and the dominant force across all four is not a brand but a default: the nameserver your registrar filled in, the mailbox your host bundled, the proxy that switched itself on. The result is an Internet where 92.5% of delegated domains depend on a single DNS organization with no independent backup — a correlated-failure risk built not by one company winning, but by everyone accepting the default.
The Data
The Index is a meta-analysis of four standalone censuses, each measuring one record type across the full DomainsProject corpus. They share a method — reduce every name to its registrable apex (eTLD+1) under ICANN public-suffix rules, attribute it to the operator that answers for it, count each apex once — which is what lets them sit on one scale. What they do not share is a denominator, and that distinction is load-bearing: each layer is measured against the population for which the question is meaningful.
| Layer | Record | Source census | Denominator (the universe measured) | Apexes |
|---|---|---|---|---|
| DNS | NS | Who Runs the World's DNS | Delegated apexes (≥1 NS record) | 277,585,349 |
| MX | Who Runs the World's Email | Mail-capable apexes (≥1 real MX) | 151,070,140 | |
| Cloud | A | Where the Web Lives | Resolving apexes (≥1 A record) | 29M–74M / snapshot |
| CDN / proxy | AAAA + CNAME | The IPv6 Mirage · The Landlords of the Web | IPv6-publishing apexes (≥1 AAAA) | 64,178,083 |
Three of the four passes are drawn from the same 9 June 2026 typed crawl; the cloud layer adds a 26-month longitudinal series (April 2023 – June 2026) so that the one layer where motion is the story can be read as a trend rather than a snapshot. Together the four touch the same corpus from four angles, and the value of measuring them as a set — rather than one at a time — is that concentration turns out to be a property of the layer, not of the Internet as a whole.
Methodology
This post makes comparative claims about market concentration, so the definitions and the limits matter more than usual.
- Concentration ratio. For each layer we report the standard concentration ratios: CR1 (the single largest operator's share), CR2 (top two), and CR4 (top four). These are computed directly from each census's published operator leaderboard and are the Index's core metric. We deliberately do not collapse the four layers into one composite "Internet concentration score." The denominators differ — delegated, mail-capable, resolving, IPv6-publishing — and a single blended number would be exactly the kind of unlabeled figure this series exists to argue against. The Index is the labeled matrix, not a magic number.
- Concentration verdict. The difference between the layers is not just how much concentration there is but what shape it takes, so we use three labels. A layer is branded-concentrated when a single named operator exceeds 40% of it — one company effectively is the layer. It is default-concentrated when the largest force is an inherited default that has consolidated onto a handful of global providers: no operator over 40%, but the top operator still leads at 15–40% (a registrar oligopoly). It is fragmented when the largest force is an inherited default that never consolidated — the top operator sits around 15% or below, and a long tail of mostly-national operators holds the majority. The distinction between the last two is the whole story of the Index: a default that concentrates (one registrar's nameservers, repeated globally) versus a default that scatters (a thousand national hosts, each bundling its own mail).
- Operator attribution. Each apex is attributed to the organization running its primary record — the plurality NS operator, the lowest-preference MX host, the first A/AAAA address's owning prefix, the CNAME target's registrable domain — with multi-domain providers (AWS, Azure, IONOS, Akamai) grouped to one organization. Classification rates are stated per layer: 80.3% of delegated apexes (DNS), 65.8% of mail-capable apexes (email), and 79.9% of cross-domain aliases (CNAME) resolve to a named operator; the residual in each is a verified long tail of small regional hosts, not a hidden giant.
- "Registrars" is a proxy, read it as one. We have no WHOIS or RDAP feed, so we cannot measure registrar market share. What the NS layer measures is registrar default-DNS usage — the share of domains still pointed at the nameservers their registrar filled in (
domaincontrol.com→ GoDaddy). This undercounts any registrar whose customers moved their DNS to Cloudflare or Route 53, and it is reported as default-usage, never as "registrars who control the Internet." For the same reason this Index excludes the web-server layer (nginx/Apache/IIS share): that lives in HTTPServer:banners, which a DNS census does not crawl, and there is no DNS proxy for it. We measure what the records can actually see. - Counted by domains, not traffic or revenue. Every share here is a share of domains. This is the opposite bias from the popularity-weighted trackers (W3Techs, BuiltWith) and the revenue tables (Synergy, Gartner), and the divergence is consistent and explainable: counting domains rewards reach into the long tail, where bundled defaults dominate, while counting traffic or money rewards the enterprise top of the market. Where our numbers and an external source disagree, it is almost always this, and we triangulate every layer against at least one outside measurement.
- Single snapshot (mostly). Three layers are a single June 2026 pass; no growth is claimed from them. Only the cloud layer is longitudinal. Full per-layer methods, classification heuristics, and reproduction inputs live in the four linked source posts; the underlying data is at /dataset.
The Scorecard: The Internet Concentration Index 2026
Here is the whole Index on one page — the four core layers, ranked by how concentrated each is, with the company that tops it and the structure underneath.
| Layer | CR1 (top operator) | CR2 | CR4 | Largest force | Verdict |
|---|---|---|---|---|---|
| CDN / proxy edge | Cloudflare 44.7% | 53.7% | 66.6% | Cloudflare | branded-concentrated |
| DNS | GoDaddy 18.9% | 32.8% | 39.9% | Registrar-bundled (47.9%) | default-concentrated |
| Cloud hosting | Amazon 15.9% | 24.2% | 30.7% | Long tail (65.9%) | fragmented |
| Google 13.2% | 22.6% | 33.1% | Host-bundled (≈67%) | fragmented |
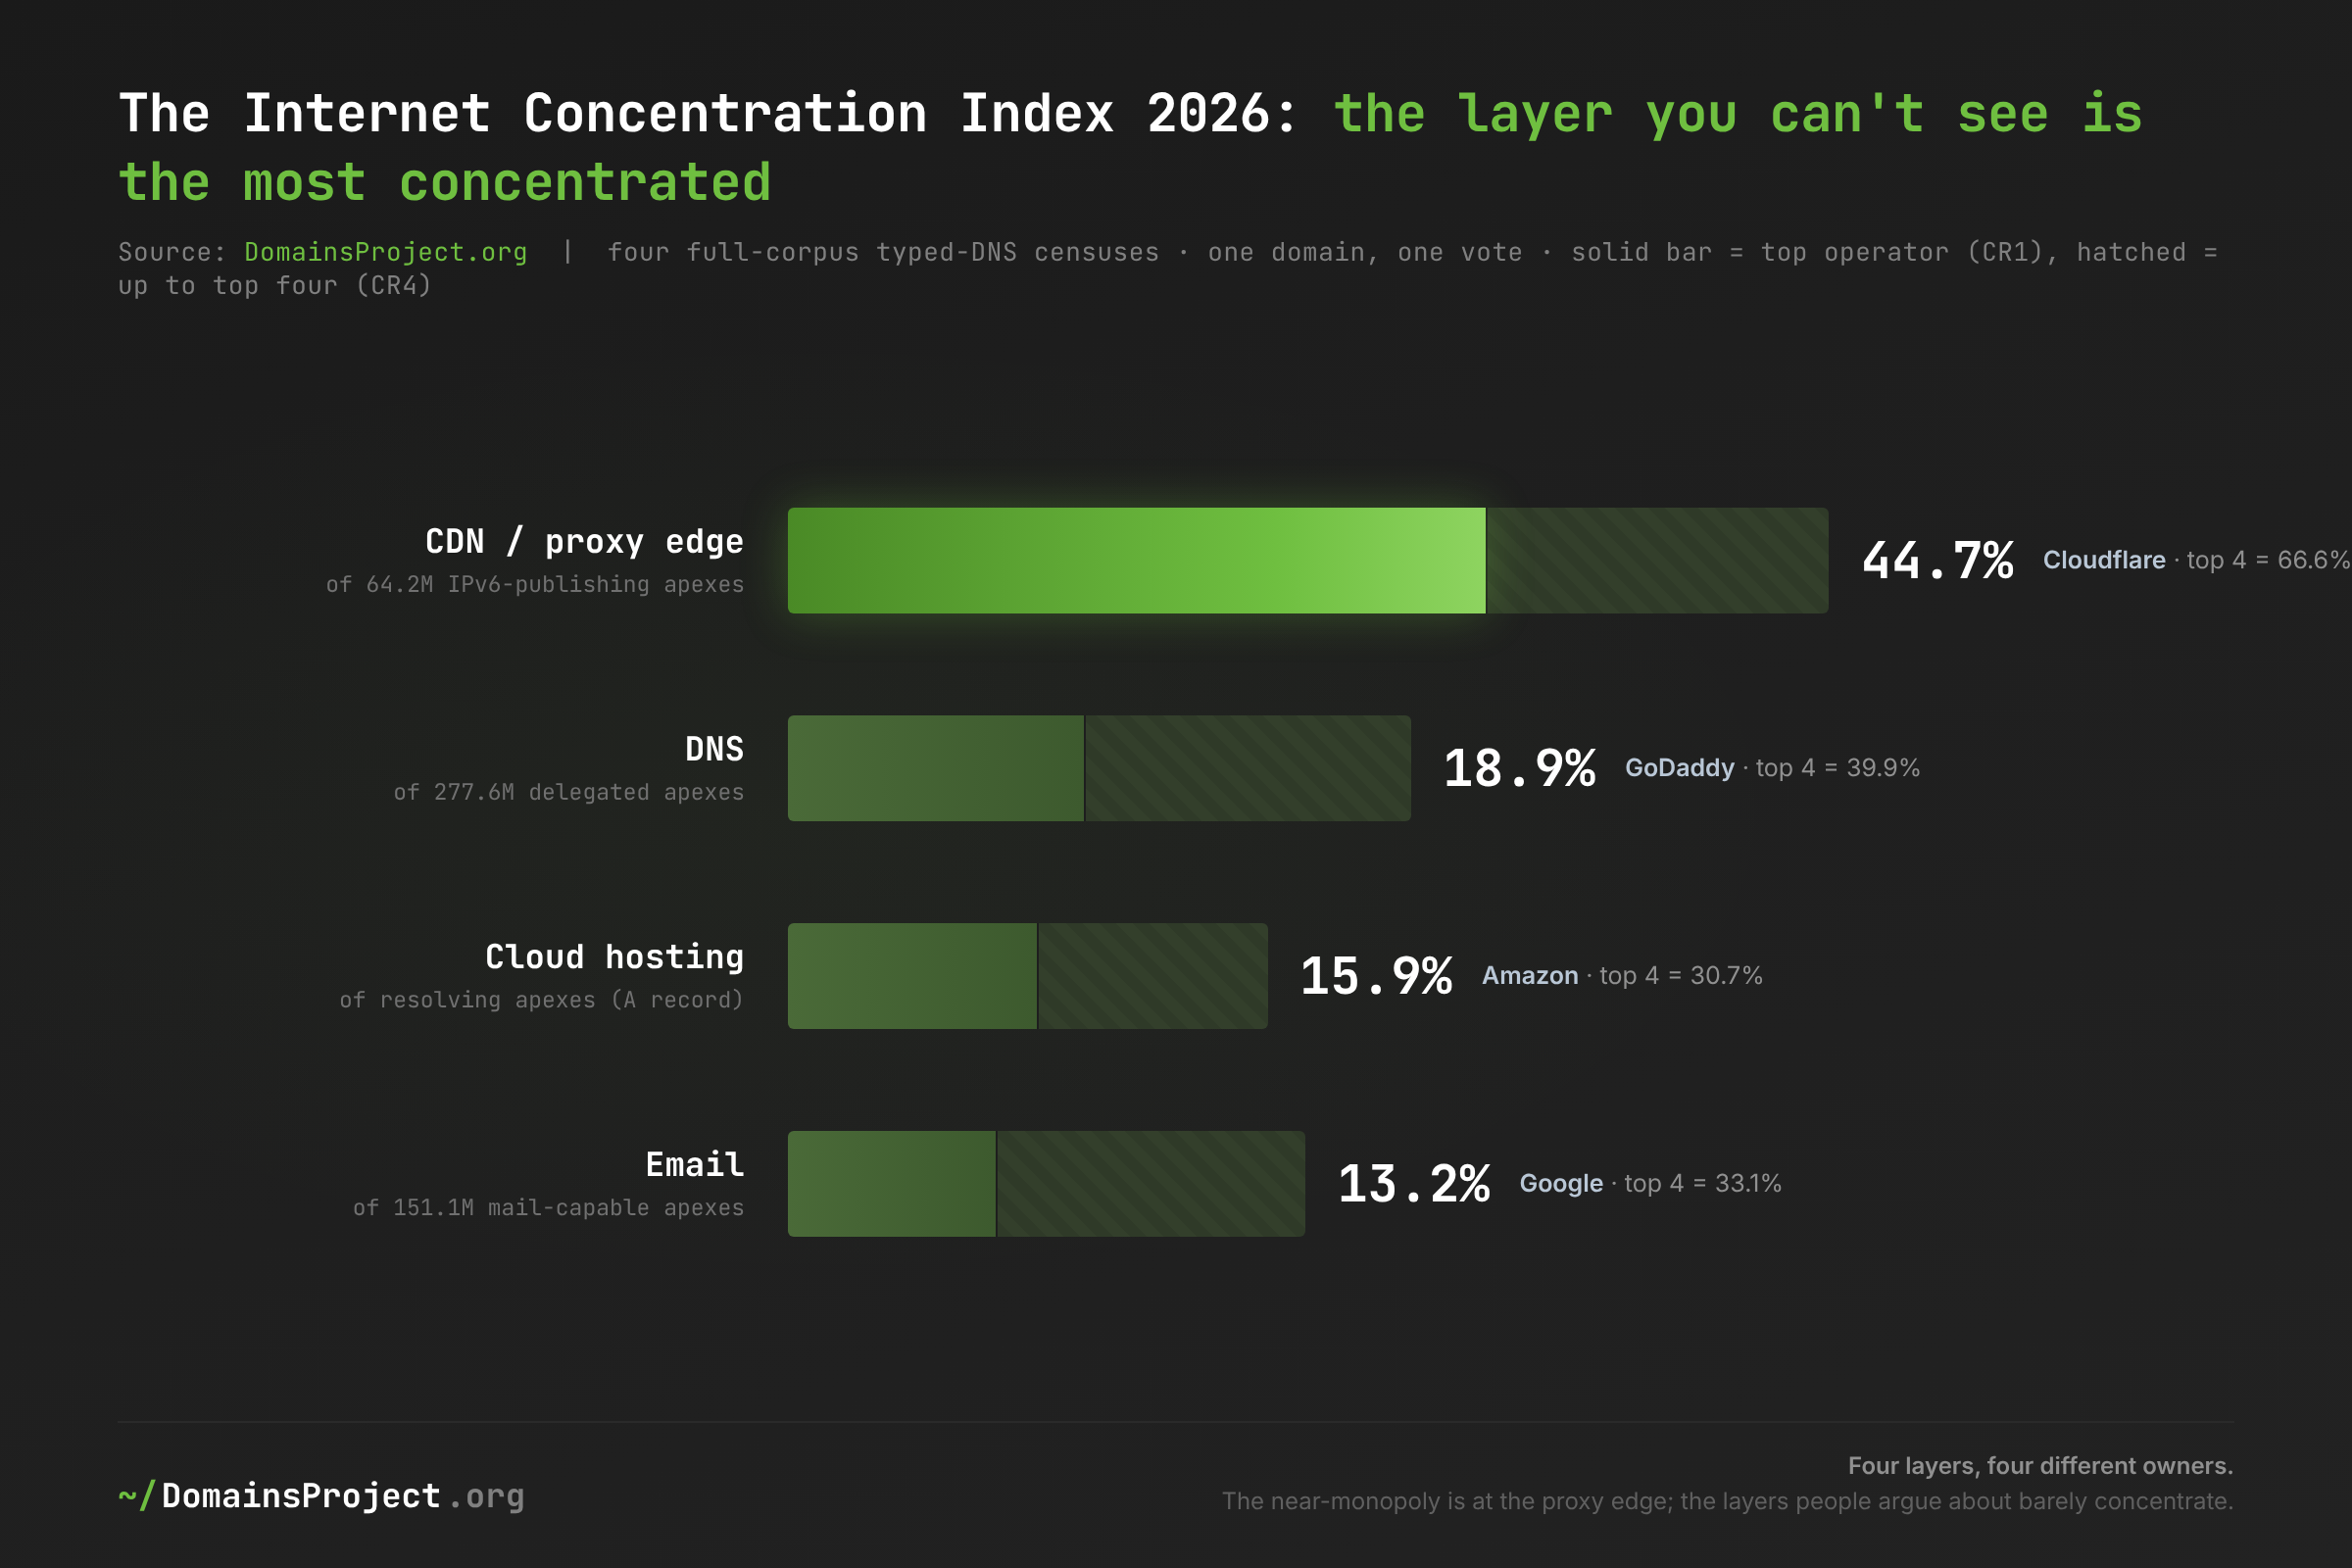
The single most important pattern in the Index is that concentration is inversely correlated with visibility. The CDN/proxy edge — the layer the public never thinks about, because it has no bill and no login — is the most concentrated infrastructure on the Internet, with one company supplying 44.7% of it. The DNS layer, slightly more visible, is a contested field led by a registrar default. And the two layers people actually argue about — "AWS vs Azure," "Google vs Microsoft for email" — are the least concentrated of all, each with a top operator below 16% and a majority held by operators too small to name. Data → inference: the fights that dominate tech-press coverage are happening in the most competitive layers, while the genuine near-monopoly sits in the layer with no marketing department. Implication: any answer to "who controls the Internet" that names the companies in the headlines is looking in exactly the wrong layer.
No single company tops more than one layer, and that is the case for and against alarm. Four different firms hold the four crowns. There is no AT&T of the Internet, no one company you could break up to decentralize it — which is the reassuring read. The unsettling read is in the next two sections: the layers are tied together by shared dependencies and shared defaults, so "four owners" does not mean four independent failure domains. It means four overlapping ones.
DNS: The Default Nobody Chose, the Migration Everybody Makes
The naming layer is concentrated, but not by a company anyone selected — it is concentrated by inertia. GoDaddy runs DNS for 18.9% of the 277.6 million delegated domains, and almost none of those owners chose GoDaddy for DNS; they registered a domain, and domaincontrol.com was the nameserver already filled in. Group every operator that wins this way — Namecheap, Hostinger, IONOS, Wix, OVH — and registrar- and host-bundled DNS runs 47.9% of the delegated web, nearly half, on the strength of a default that most owners never see.
| DNS, by category | Share of delegated |
|---|---|
| Registrar / host-bundled (the default) | 47.89% |
| Cloudflare (active migration) | 13.88% |
| Hyperscaler cloud DNS (Google, Alibaba, AWS, Azure…) | 7.36% |
| Parking / aftermarket | 6.64% |
| Specialist managed DNS (NS1, UltraDNS, Akamai…) | 4.04% |
| Self-hosted (vanity NS) | 0.40% |
| Unclassified long tail | 19.69% |
Cloudflare's 13.9% is the one number on this layer that represents a decision. You cannot register a domain and have it default to Cloudflare DNS; every one of those 38.5 million domains moved — an owner copied two ns.cloudflare.com hostnames into their registrar and repointed their delegation. It is the only top-tier DNS footprint built entirely by active migration, and it is already larger than every hyperscaler cloud's DNS combined (7.36%). The contrast is the whole character of the layer: GoDaddy owns the default, Cloudflare owns the choice, and between them they answer for a third of the delegated web. External trackers that weight by site popularity put both higher — W3Techs has GoDaddy at 26.7% and Cloudflare at 10.8% — and rank them in the same order, the predictable signature of measuring traffic instead of domains.
Underneath the leaderboard is the Index's most alarming single statistic: 92.5% of delegated domains depend on a single DNS organization with no independent backup. They publish the recommended two nameservers, but both live inside one company's network, so a provider-wide outage takes all of them down together — the redundancy is an illusion. Only 7.5% spread DNS across two genuinely independent operators, the one configuration that survives a provider failure. This is the fragility the outage headlines are really about, and it is not caused by GoDaddy or Cloudflare being large. It is caused by the default delegating to one place and never offering a second.
Email: The One Layer That Refused to Concentrate
Email is the counter-example that proves the rest of the Index, because it is the one core layer that did not concentrate. Among 151.1 million mail-capable domains, Google Workspace leads at 13.2% and Microsoft 365 trails at 9.4% — and that 1.4-to-1 Google lead is the exact inverse of the enterprise seat-count charts, where Microsoft's 450 million paid seats dominate. Both are true: Microsoft wins the enterprise, where one tenant is one MX record and a hundred thousand seats; Google wins the domain count, where one small business is one MX record and five seats. An MX census counts domains, so it counts Google's territory.
| Email, by category | Share of mail-capable |
|---|---|
| Registrar / host-bundled | 32.88% |
| Unclassified long tail (overwhelmingly more small hosts) | 34.22% |
| Google Workspace | 13.21% |
| Microsoft 365 | 9.39% |
| Other cloud suites / gateways / forwarders | ~6.6% |
| Regional, parking, broken | ~3.7% |
The cloud duopoly everyone names is 22.6% of email; the category nobody names is three times bigger. Registrar- and host-bundled mail — the inbox that came switched-on with your domain at GoDaddy, IONOS, Namecheap or a thousand regional hosts — is 32.9% before the long tail, and the unclassified 34.2% residual is, on manual inspection, almost entirely more of the same small hosts. Together that is roughly two-thirds of the world's email, run by the company that sold you the domain. In Germany the most common email operator is not Google or Microsoft but IONOS at 16.3%; Google reaches just 1.5% of German domains. Data → inference: where a country grew a domestic hosting industry, its domains keep their mail at home by default. Implication: email's fragmentation is not an accident waiting to consolidate — it is a structural consequence of national registrars and bundled defaults, and it is the most resilient layer in the Index precisely because no one center of gravity exists to fail.
Cloud Hosting: A Map That Won't Move and a Long Tail That Won't Die
The hosting layer is where the consolidation narrative is loudest and the data is most stubborn. Across 26 monthly snapshots from April 2023 to June 2026 — the one longitudinal layer in the Index — the share of resolving domains hosted on US soil held essentially flat at ~45%, never leaving a 44–50% band. The predicted de-Americanization did not show up in the per-domain census; it is a story about the traffic-weighted top of the market, not the registered Internet. What did move is one company and one category.
| Cloud provider (visible IPv4) | Apr 2023 | Jun 2026 | Net |
|---|---|---|---|
| Amazon AWS | 5.3% | 15.9% | +10.6 |
| Cloudflare (visible IPv4 only) | 6.9% | 8.3% | +1.4 |
| 8.1% | 3.9% | −4.2 | |
| Big-6 cloud & CDN (combined) | 21.2% | 28.9% | +7.7 |
| Long tail (too small to name) | 72.9% | 65.9% | −7.0 |
Amazon roughly tripled its footprint while its share of cloud revenue stayed flat-to-declining, and the gap between those two facts is the finding. Synergy Research puts AWS near 28–31% of cloud revenue; by the count of ordinary domains that physically resolve to it, AWS went from 5.3% to 15.9% — the shadow of a decade of site builders, SaaS back-ends and registrar infrastructure quietly defaulting onto Amazon. Yet after all of it, two-thirds of the world's resolving domains still answer from hosting too small to name. The Big-6's combined share rose a real but modest 7.7 points in three years, almost all of it out of the long tail. Data → inference: consolidation into the hyperscalers is genuine but slow. Implication: the Internet of busy sites is consolidated; the Internet of registered names is not, and on this trajectory the long tail is still the majority well into the 2030s. (One caveat folds straight into the next section: these are visible IPv4 shares. The fastest-growing geographic category in the data is the 9.3% anycast bucket — addresses, overwhelmingly Cloudflare's, that refuse to say what country or origin they front. Cloudflare's true hosting weight is larger than its 8.3% A-record share, and it surfaces fully only in the layer below.)
The CDN / Proxy Edge: The Most Concentrated Layer Is the One You Can't See
The proxy edge is the most concentrated layer in the Index, and it is the hardest to measure — for the same reason. When we asked every domain for an IPv6 address, 44.7% of the 64.2 million that answered pointed at Cloudflare — more apex IPv6 than Hostinger, IONOS, AWS, Strato, Shopify, Hetzner and GoDaddy combined. Cloudflare reaches that number because proxying a zone through it switches on an AAAA record by default, whether or not the origin behind it speaks IPv6 at all. The edge is a near-monopoly, manufactured by a single default setting at a single company.
| Cloudflare, measured two ways | Share | Base |
|---|---|---|
| Of domain IPv6 (AAAA census) | 44.74% | 64.2M IPv6-publishing apexes |
| Of all reverse-proxy sites (W3Techs) | 83.4% | popularity-weighted sites |
| Of CNAME aliases | 0.73% | 169M cross-domain aliases |
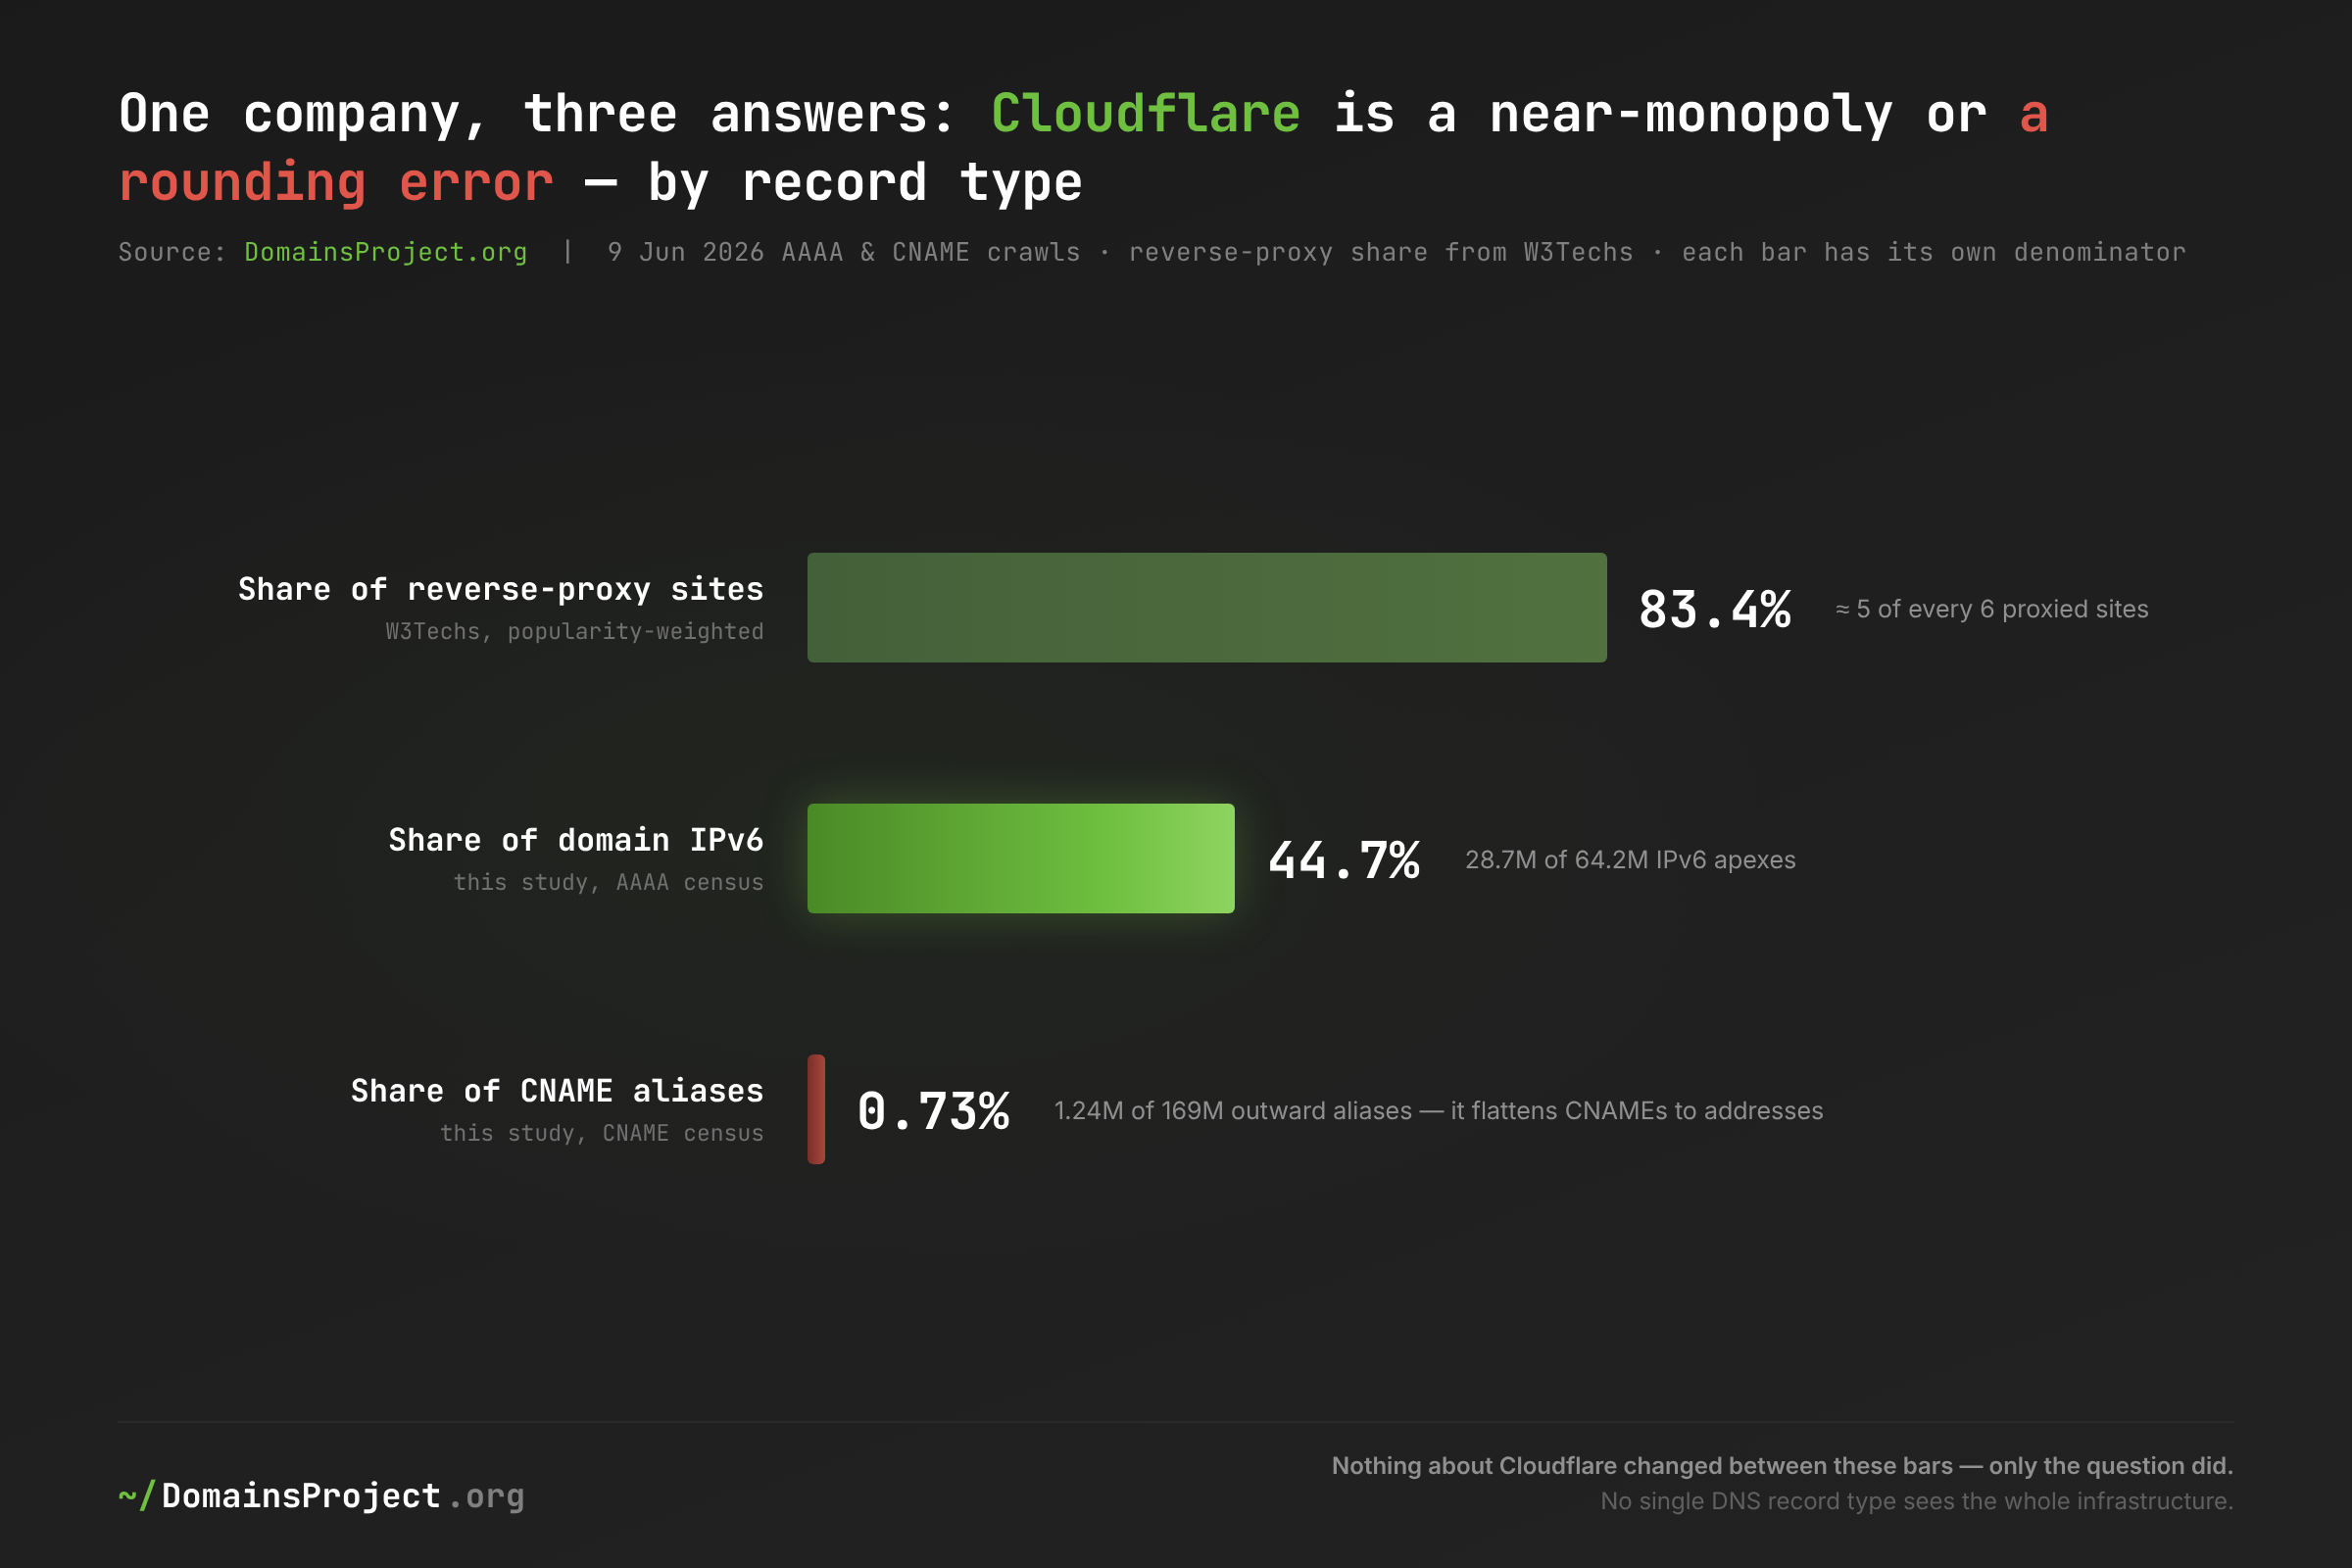
The third row is the methodological heart of the entire Index. Query AAAA and Cloudflare is 44.7% of the answer; query CNAME and it is 0.7% — because Cloudflare resolves aliases server-side and returns its own address records, so the dominant proxy on the Internet is nearly invisible to a CNAME crawl. Nothing about Cloudflare changes between those two numbers; only the question does. This is why the CDN category looks small (5.9%) in the alias census even though the proxy edge is the most concentrated layer there is: the biggest member doesn't answer in that record type. Data → inference: no single record type sees the whole infrastructure, and any market-share figure drawn from one inherits a large, directional blind spot. Implication: "who controls the Internet" cannot be answered from a single DNS question — and the layer where one company comes closest to actually controlling it is precisely the layer a casual measurement would conclude is the most competitive.
The Cross-Layer Map: Four Owners, One Center of Gravity
Stack the four layers side by side and the Index's real shape appears — not a single ruler, but a small cartel of giants who each own a different floor of the same building.
| Company | DNS (NS) | Email (MX) | Cloud (A) | CDN/proxy (IPv6) |
|---|---|---|---|---|
| Cloudflare | 13.9% (#2) | 1.2% (forwarder) | 8.3% + anycast | 44.7% (#1) |
| GoDaddy | 18.9% (#1) | 6.2% (#3) | registrar farms | 1.6% |
| Amazon | 1.2% (Route 53) | SES (forwarder) | 15.9% (#1) | 6.2% (#4) |
| 3.6% (Cloud DNS) | 13.2% (#1) | 3.9% | Blogger* | |
| Microsoft | 0.1% (Azure DNS) | 9.4% (#2) | 0.6% | minimal |
*Google's CDN/proxy presence is overwhelmingly free *.blogspot.com platform hosts, which the IPv6 census holds out of the registry apex count.
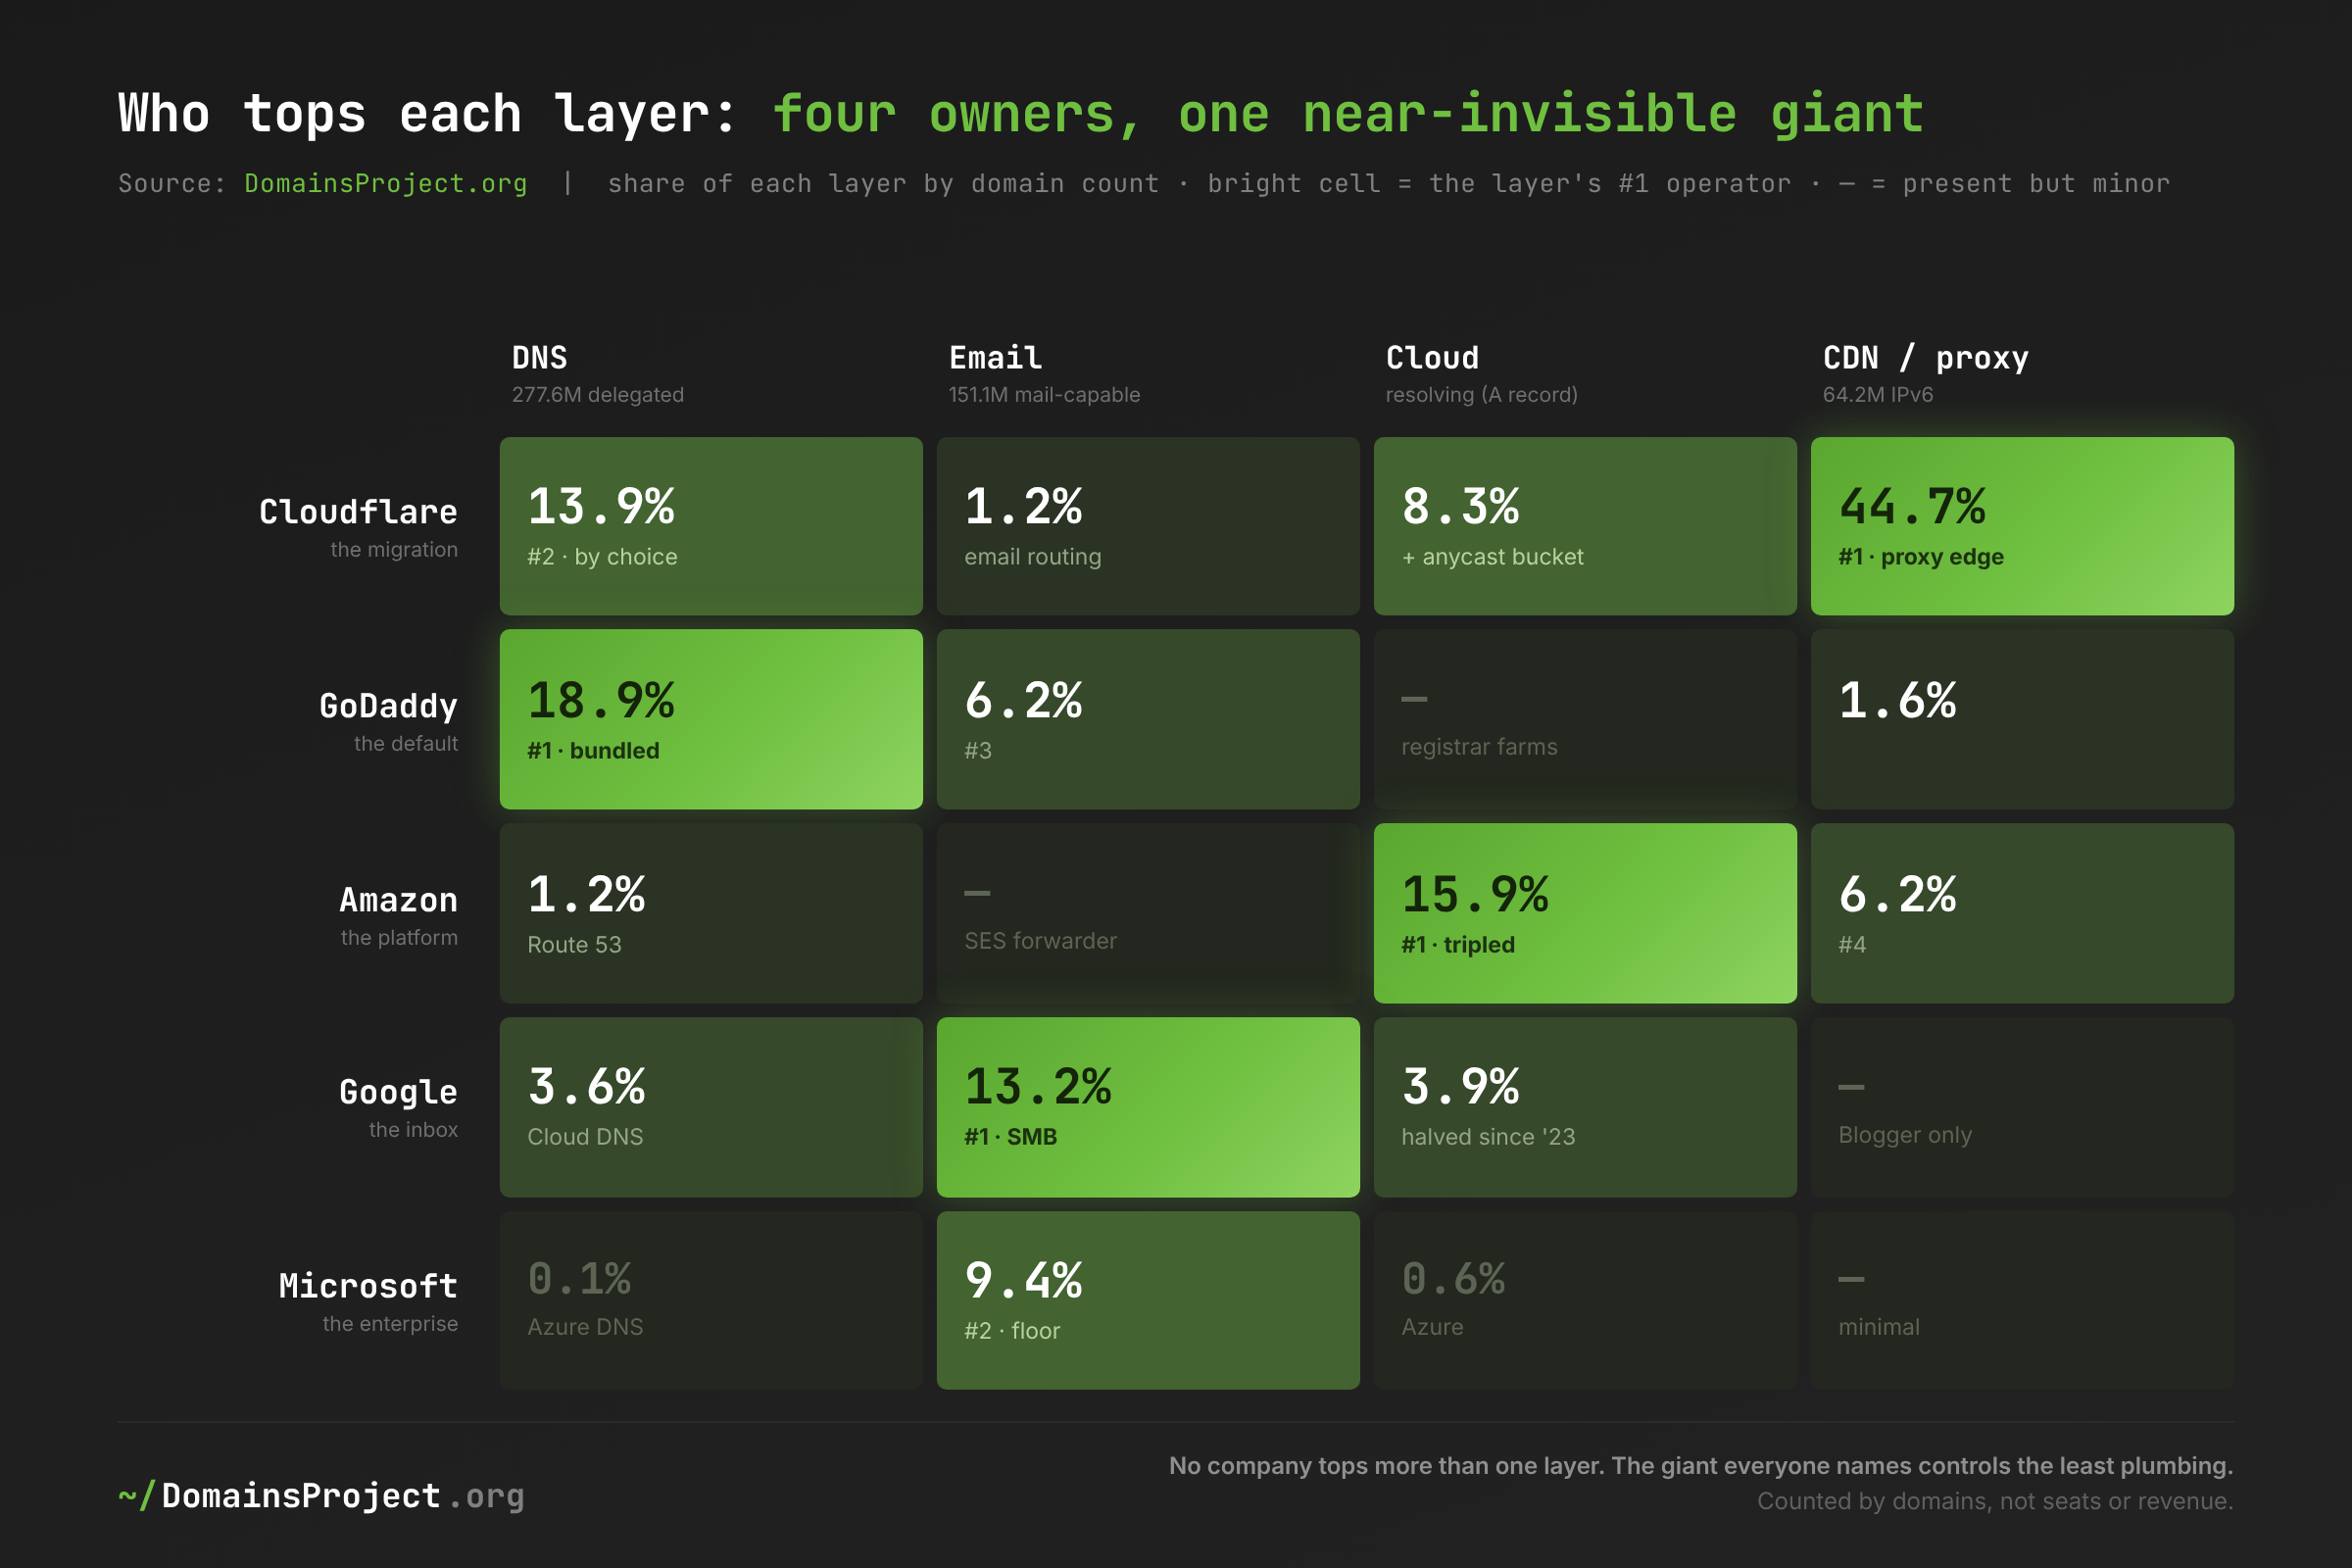
Three readings fall out of this matrix, and together they are the answer to the question in the title.
First: the Internet has four owners, not one — and they barely overlap. GoDaddy, Google, Amazon and Cloudflare each top exactly one layer and are minor in at least one other. No company is in the top two of more than two layers. The thing people fear — a single entity that could switch off the web — does not exist in the data. What exists is a division of territory so clean it looks almost negotiated.
Second: Microsoft, the company most named when people say "Big Tech controls the Internet," is nearly invisible in every domain-count census. Azure DNS answers for one domain in 670; Azure hosting is 0.6% of resolving apexes; even in email, where Microsoft is strongest, it trails Google by domain count. Microsoft's dominance is real and lives almost entirely in the enterprise seat and the revenue line — the part of the Internet that a per-domain census is built to look past. The single most counterintuitive fact in the Index is that the giant everyone names controls the least of the actual plumbing.
Third: if any company is the center of gravity, it is Cloudflare — and it got there by being the default no one was assigned. Cloudflare is the only firm ranked in the top two of more than one core layer (#1 in CDN/proxy, #2 in DNS), and it is the force behind the rising anycast bucket that is quietly erasing the hosting map. It owns none of the layers by being bundled with a domain sale; it owns them because tens of millions of operators each individually chose to route through it for a free certificate and DDoS protection — and inherited its IPv6, its proxy edge, and its single-point-of-failure profile as side effects they never configured.
The Default Is the Product
Step back from the four owners and one mechanism explains all four layers: the Internet runs on defaults, not decisions. The single largest force in three of the four layers is not a company chosen on its merits but a setting accepted without thought.
| Layer | The inherited default | Share of the layer |
|---|---|---|
| Host-bundled inbox (came with the domain) | ≈67% | |
| Cloud | Long-tail / regional host (came with the plan) | 65.9% |
| DNS | Registrar-bundled nameservers (came with the registration) | 47.9% |
| CDN/proxy | Cloudflare's auto-generated AAAA (came with the proxy) | 44.7% of domain IPv6 |
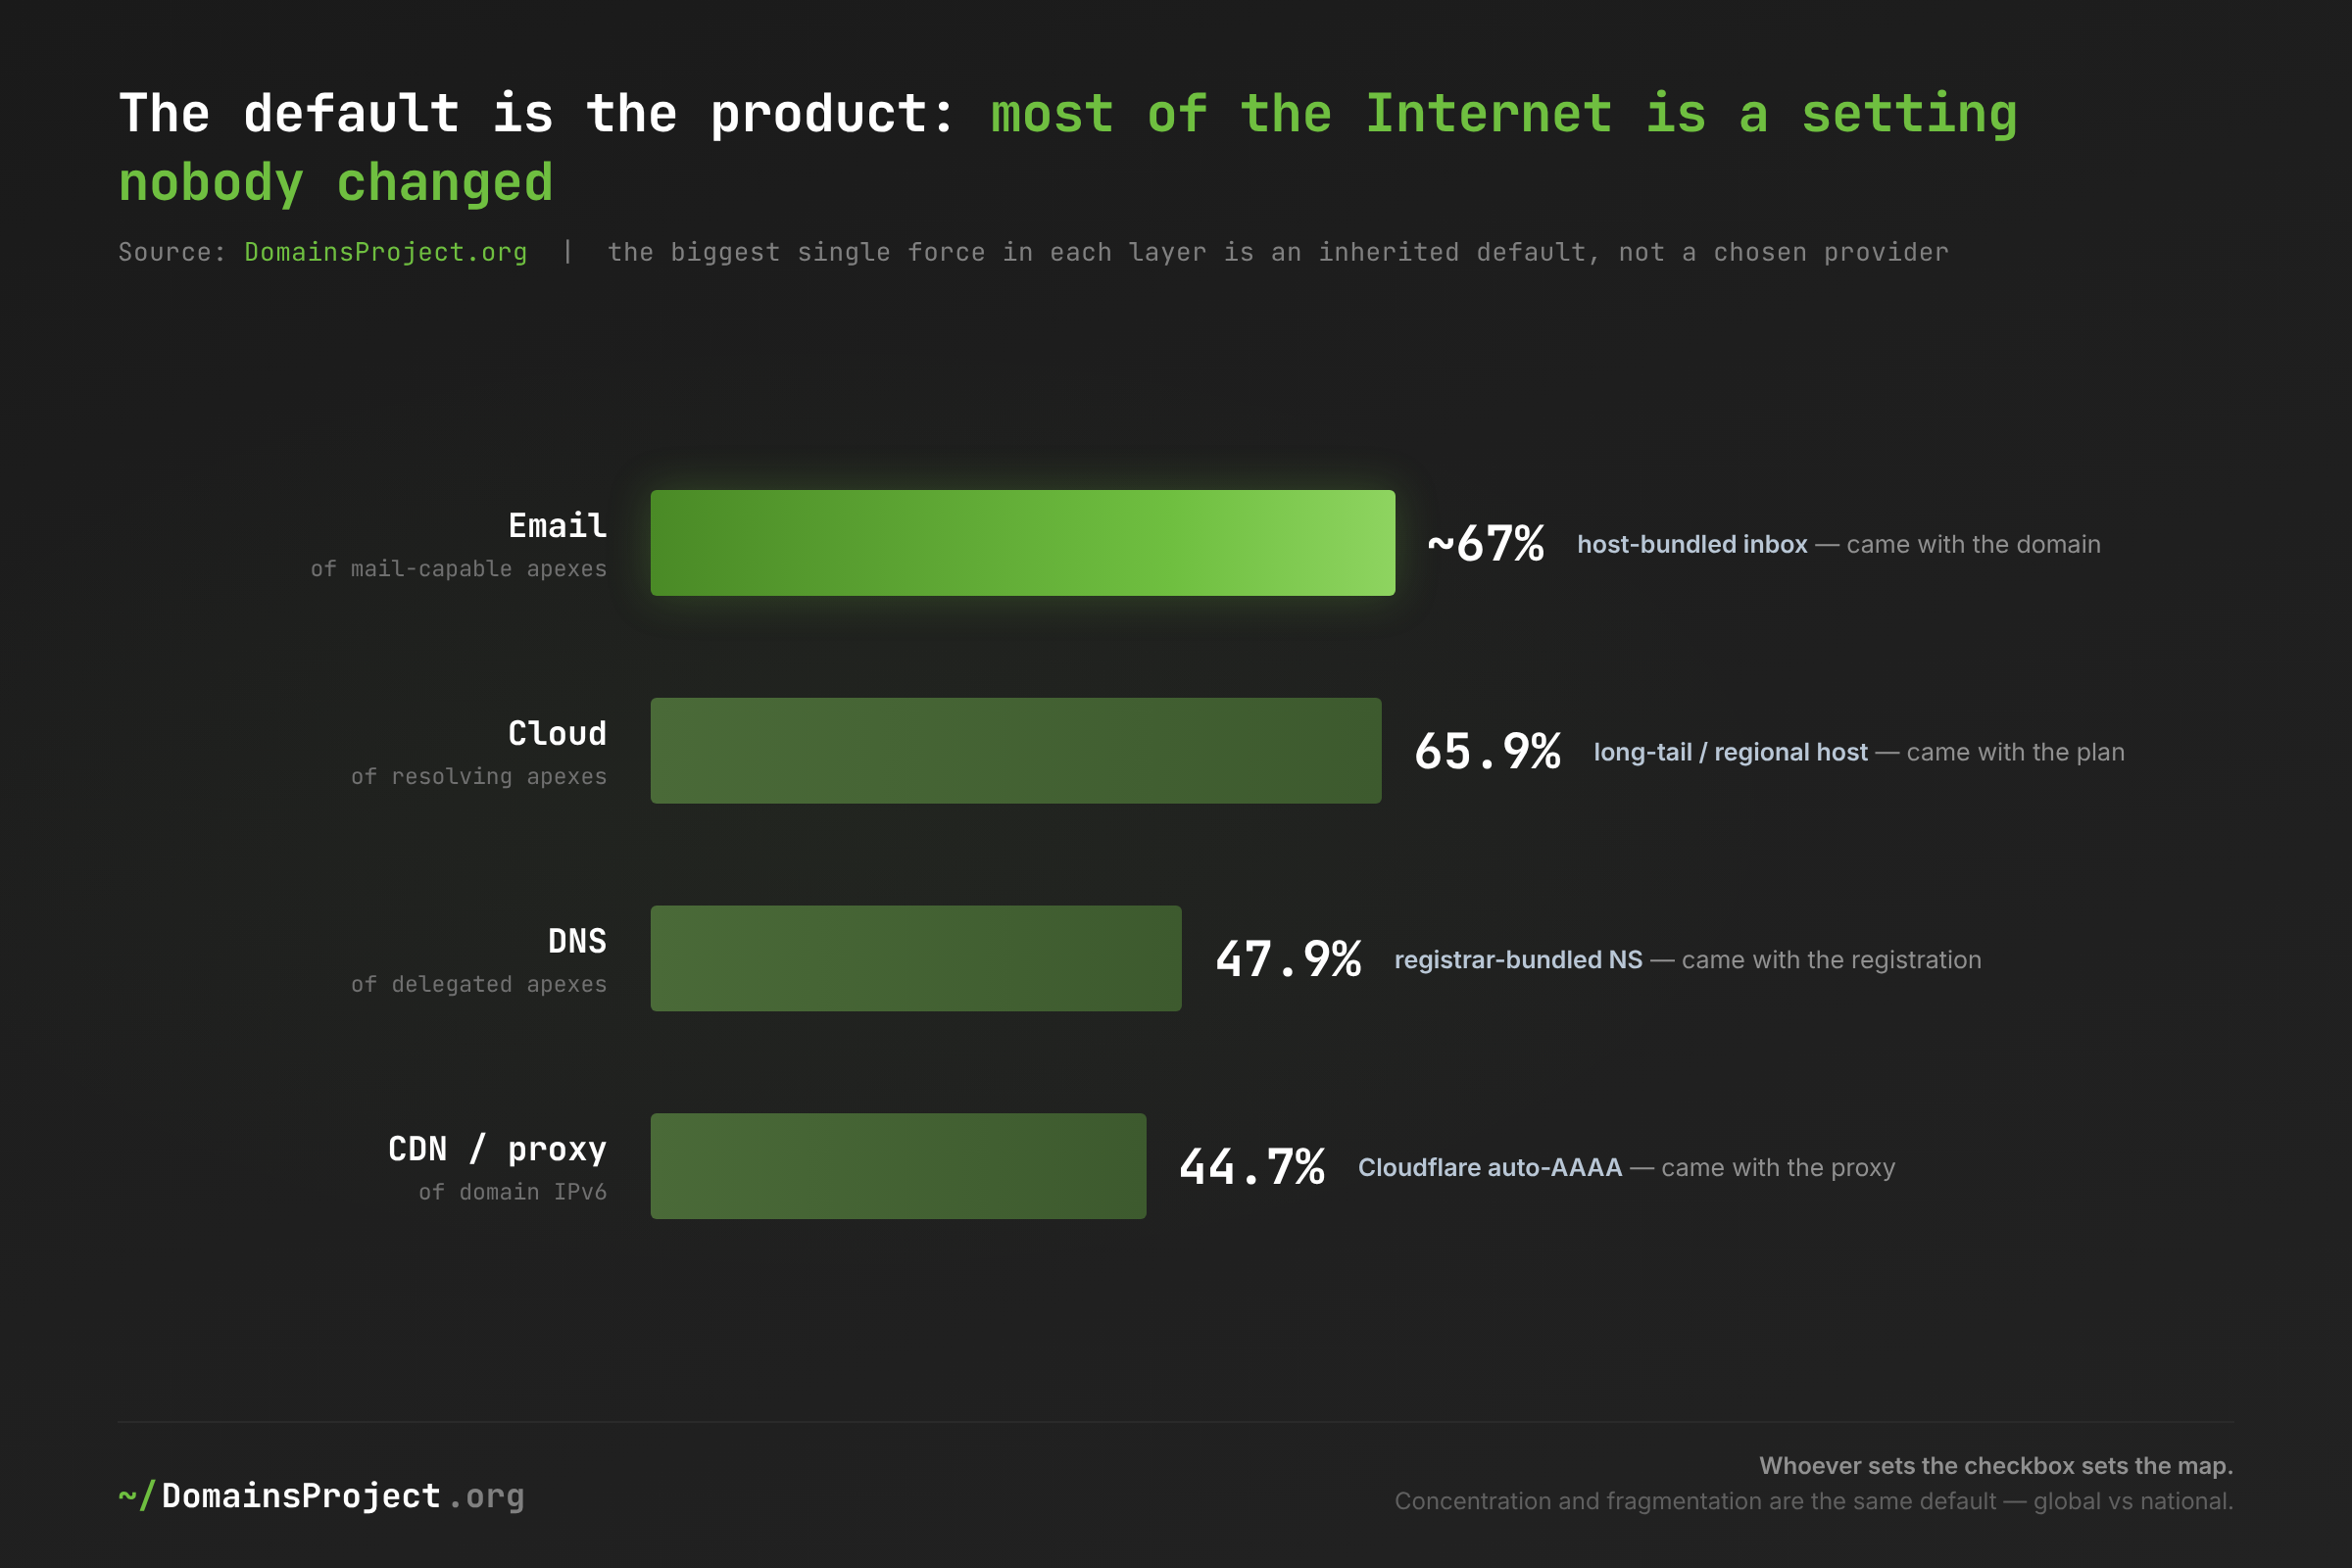
This is why concentration and fragmentation are the same phenomenon wearing two costumes. The fragmented layers (email, cloud) are fragmented because their defaults are national — every country has its own registrar and its own host, so the bundled inbox resolves to thousands of small operators. The concentrated layers (DNS, CDN/proxy) are concentrated because their defaults are global — one registrar's nameservers, one proxy's edge, repeated tens of millions of times. Data → inference: in every layer, the operator the typical domain ends up on is the one it was handed, not the one it picked. Implication: the lever that actually moves Internet structure is not competition policy aimed at brands — it is the default. Whoever sets the checkbox sets the map, which means the most consequential decisions about who controls the Internet are made by product managers choosing default values, not by users choosing providers.
What's at Stake
- Correlated failure is the Internet's default architecture, not an edge case. With 92.5% of delegated domains on a single DNS organization and one company supplying 44.7% of all domain IPv6, the recurring outages that take down "half the web" are a structural property of the system, not a run of bad luck. The conditions that made the 2016 Dyn attack catastrophic are more concentrated now, not less — and they sit in the layers nobody watches.
- Antitrust and DMA enforcement are aimed at the wrong denominator. Regulators measuring market power by revenue and enterprise seats will find Microsoft and the cloud majors and miss the actual control points: a registrar default that runs half the world's DNS, a proxy default that owns the IPv6 edge. The plumbing concentrates in places the revenue tables do not look.
- "Registrar share" and "CDN share" mean nothing without the record type and denominator attached. Cloudflare is 44.7% of one census and 0.7% of another — the same company, two questions. Any policy, inventory, or news figure that infers infrastructure control from a single DNS record inherits a large, predictable blind spot.
- The fragmented layers are a resilience asset worth defending. Email's two-thirds-bundled, nationally-distributed long tail is the one core layer with no single point of failure. The same is true of the cloud long tail. Policy that treats all fragmentation as inefficiency to be consolidated away would be trading the Internet's most robust layers for its most fragile ones.
- The center of gravity is a company you opted into, not one assigned to you. Cloudflare's cross-layer weight was built one free-tier signup at a time. That makes it both more legitimate (everyone chose it) and more insidious (no one priced in the systemic dependency) than a bundled monopoly — and it means the concentration can only be addressed by the millions who created it, one configuration at a time.
What Would Help
- Regulators and policymakers: measure the plumbing, and name the layer. Market-power analysis built on revenue and seats will never see the registrar default that runs 47.9% of DNS or the proxy that owns 44.7% of domain IPv6. Mandate per-layer, per-record concentration reporting — DNS, mail, hosting, proxy edge, each with its denominator — and the genuine control points become legible. The data is public; the dataset and per-layer censuses are a starting template.
- Registrars: make a second, independent DNS provider a one-click default. The single biggest available lever on Internet resilience is not new technology — it is a checkbox. The same inertia that put 92.5% of domains on a single DNS organization would, redirected, move them off it. Whoever changes the default changes the map.
- Domain owners and enterprises: inventory your stack across all four layers, and add redundancy before you need it. Resolve your own apexes for NS, MX, A and AAAA, confirm each points where you intend, and add a second DNS operator if your business depends on resolving. Your flagship may be redundant while a dozen acquired brands run on a single bundled default you have never audited. Benchmark against the statistics dashboard.
- Researchers and journalists: never quote one record type as "the Internet," and always state domains-versus-traffic. "Cloudflare controls a quarter of the web" and "Cloudflare is 0.7% of aliases" are both true and both incomplete. Report the layer, the denominator, and the unit, and the contradiction dissolves into a precise map instead of a misleading headline.
- This Index, annually: track the trajectory, not just the snapshot. A single year's concentration is a baseline; the story is the direction. Re-running these four censuses each year will show whether the default-wins dynamic is intensifying, whether multi-provider DNS rises after each outage, and whether the anycast bucket keeps erasing the hosting map. This is the 2026 edition; it is built to be compared against 2027.
Methodology: the Internet Concentration Index is a synthesis of four full-corpus, typed-DNS censuses of the DomainsProject master dataset (~3 billion hostnames), reduced to the registrable apex (eTLD+1) under ICANN public-suffix rules and counted one domain per vote. Sources: the NS census of 277,585,349 delegated apexes, the MX census of 151,070,140 mail-capable apexes, and the AAAA census of 64,178,083 IPv6-publishing apexes are from the 9 June 2026 typed crawl; the A-record cloud layer is a 26-snapshot longitudinal series, April 2023 – June 2026. Concentration is reported as CR1/CR2/CR4 per layer and is never collapsed into a single composite score, because the denominators differ. "Registrar" figures are a default-DNS-usage proxy, not WHOIS market share; the web-server layer is excluded as unmeasurable from DNS. Shares are by domain count, not traffic or revenue, and diverge from popularity-weighted and revenue-weighted trackers in a consistent, documented direction. External triangulation from W3Techs, BuiltWith, Statista, Synergy Research, Gartner, the UCSD/ICANN IMC 2021 measurement, and Hurricane Electric. Russian-administered TLDs excluded throughout. This is the first edition of an annual index. Full per-layer detail in Who Runs the World's DNS, Who Runs the World's Email, Where the Web Lives, The IPv6 Mirage, and The Landlords of the Web. Explore the data at /dataset and /stats/.