On September 16 the House passed the Ratepayer Protection Act 417–3. The next day Senator Martin Heinrich objected when it came up for unanimous consent in the Senate, and offered his own GRID Savings Act, which would give federal regulators authority over any single load of 150 megawatts or more (CBS News, CNBC, Utility Dive). The fight is about who pays for the power data centers draw, and it is argued in megawatts and dollars. Data centers were 28% of Dominion Energy Virginia's electricity sales in 2025, up from 21% in 2022 (Dominion 2025 10-K, 2023 annual report). PJM's capacity auctions have cleared at their price cap three times in a row, and PJM's independent market monitor attributes $23.1 billion of the cost of three auctions to data-center load (Monitoring Analytics).
The other side of that ledger is almost never measured: how much of the Internet itself depends on that grid. The usual answer is a slogan. Loudoun County's economic-development office still says that "more than 70% of the world's internet" courses through the networks of its companies (Loudoun Economic Development). TeleGeography said in 2019 that "there's just no way" this is true (TeleGeography), and when Cardinal News traced it in 2025, Virginia's own economic-development agency did not know where the figure came from. What is verifiable is that the region is the world's largest data-center market: about 13% of reported global operational capacity (JLARC) and nearly 7 GW of inventory (JLL). And when one AWS region there, us-east-1, published an empty DNS record for its DynamoDB endpoint on October 20, 2025, Reddit, Snapchat, Venmo, Disney+ and the UK's tax portal failed with it (AWS, CNBC).
We could not find a published measurement of how many websites are served from Northern Virginia. The nearest is a 2013 study that found 74% of EC2-hosted subdomains in AWS's US East region, and at least 2.3% of the Alexa top million depending on it (He et al., IMC 2013). Traffic is not measurable from DNS, and neither is power. What DNS does show is where each website answers from.
We measured that. For each of 29 full A-record crawls of the DomainsProject corpus, April 2023 to September 2026, we took the website record of every registrable domain — the same 169 to 290 million websites as How Many Computers Host the Web? — and located every address in it. We used the best evidence available for each address, in this order: anycast and CDN edge lists; 132 Globalping round-trip measurements; the cloud providers' own region tags, in the version current at each crawl; RFC 8805 geofeeds; and geoIP. Each location then maps to a metro, a US state and a grid operator. This is not an energy estimate. A website count says nothing about megawatts, and this post does not convert one into the other. It measures dependency: where the web goes dark if one place, or one grid, does.
The headline: Northern Virginia serves 3.53% of the world's websites — 10.2 million in September 2026 — which is more than any country except the United States and Germany, 6.7% of all websites we can place anywhere, and 20.0% of those we can place in the US. It is the largest single hosting metro on the map. But it is not growing. Its share was 3.72% in April 2023 and has stayed between 3.35% and 4.04% in every crawl since. For live, non-parked websites it fell by almost a third (3.72% → 2.61%). What grew in Virginia is parked inventory: a third of the websites answering from Northern Virginia are HugeDomains for-sale pages on AWS us-east-1. The fastest-growing place on the map is no place at all: 47.0% of websites now answer only from anycast and CDN front doors with no single location and no single grid, up from 30.6%.
The Data
| April 2023 | September 2026 | |
|---|---|---|
| Crawls in the series | 29 full A-record passes | April 7, 2023 → September 18, 2026 |
| Websites analysed | 169,343,511 | 289,735,675 |
| … located by edge list or RTT-proved anycast (no single location) | 30.56% | 47.02% |
| … by cloud region tag (AWS, Google Cloud, Azure, Oracle) | 9.58% | 6.40% |
| … by RFC 8805 geofeed (DigitalOcean, Linode, Vultr) | 2.00% | 1.54% |
| … by RTT measurement (pinned or moved) | 1.11% | 1.33% |
| … by geoIP only (DB-IP City Lite) | 56.75% | 43.71% |
| Websites that are parked (#98 front-door registry) | 16.64% | 25.16% |
| Distinct addresses probed with Globalping | — | 100 (132 measurements) |
A website is a registrable domain with a website record in that crawl: the addresses its bare apex resolves to, or its www if the apex does not resolve. The universe, exclusions and parked/live split are exactly those of How Many Computers Host the Web?, Where the Web Moves and The Parking Lot. Our scanner reproduces that post's website count to the domain in every crawl (289,735,675 in September 2026). The corpus grew 1.7× over the window, most of it in one December 2024 expansion of the crawler's known-name list, so this post reports shares and controls for composition with a fixed panel of the 108.5 million websites present at both ends.
Methodology
Definitions.
- Share of websites. A website with k addresses counts 1/k at the location of each. Shares add up to 100%. "Answers only from X" means every address in the record is in X.
- Location. Where the address that answers is served from. It is not where the company is, not where a CDN's origin server sits, and not where the visitors are.
- Edge / anycast. An address announced from many sites at once (anycast), or handed out per resolver by a CDN (DNS-steered). It has no single location and no single grid. The same Cloudflare address serves a Virginia visitor from Ashburn and a Frankfurt visitor from Frankfurt.
- Metro. A data-center cluster. Northern Virginia is everything within 80 km of Ashburn on the Virginia side: Loudoun, Prince William and Fairfax counties and their neighbours. Washington DC–Maryland is a separate metro, which geoIP matters for (see below). Virginia (the state) also includes Azure's East US and East US 2 regions, which Microsoft places only in "Virginia" with no city (Microsoft).
- Grid. In the US, the ISO/RTO — PJM, ERCOT, MISO, SPP, NYISO, ISO-NE — or the non-RTO West and Southeast. California is labelled "CAISO + municipal BAs" because Los Angeles's DWP and Sacramento are separate balancing authorities. Assignment is by state, overridden by metro where a state is split (Chicago → PJM via ComEd, Kansas City → SPP, Council Bluffs → MISO). Outside the US, a location maps to its national grid. Northern Virginia sits in PJM's Dominion zone, which the EIA calls "the largest concentration of data centers in the world" (EIA).
- Parked / live. A website whose addresses are a parking, for-sale or expiry front door in the #98 registry is parked. Everything else is live.
Evidence tiers. Each address takes its location from the best evidence available:
- Edge lists. Cloudflare's
ips-v4list and AS13335; Fastly's public list and AS54113; Akamai's edge ASNs; AWSip-ranges.jsonprefixes with regionGLOBAL(CloudFront, Global Accelerator); Google Cloudcloud.jsonscopeglobal; Google ranges outsidecloud.json(Google's own front ends); Azure Front Door. - RTT measurements. Globalping pings of the heaviest addresses that only geoIP could place, from seven probes: Ashburn, New York, Dallas, Los Angeles, Frankfurt, Singapore, São Paulo. Light in fibre covers about 200 km per millisecond one way, so a target is at most 100 km from a probe for every millisecond of round trip.
- Anycast. If two probes' discs cannot intersect, the address is anycast, and its whole /24 moves to edge: anycast is a property of the announced prefix, and /24 is the smallest prefix routed globally.
- Pinned. A unicast address within 2 ms of a probe takes that probe's metro.
- Refuted. An address that geoIP puts in Northern Virginia is moved out if no Ashburn probe reaches it in under 5 ms. Every Ashburn site we measured answered in 0.5–1.9 ms. Every such refutation was re-tested from three separate Ashburn probes.
- Region tags. The cloud provider's own published region for the prefix: AWS
regionandnetwork_border_group(so a Local Zone in Boston or Dallas is not counted as us-east-1), Google Cloudscope, Azure service tags, Oracle regions. The AWS, Google and Oracle files are the Wayback Machine captures nearest each crawl — AWS within 23 days, Google within 45, Oracle within 95 — so every crawl is labelled with the region map in force at the time. - Geofeeds. RFC 8805 files self-published by DigitalOcean, Linode/Akamai and Vultr.
- GeoIP. DB-IP City Lite (CC BY 4.0), September 2026 edition, for everything else.
What the RTT checks changed. Speed of light proved 14 /24s anycast, and each was a platform geoIP had pinned to a single city. Squarespace ("New York") answered in 1.6 ms from Dallas and 1.3 ms from Singapore. Wix ("Washington DC") answered in 1.3 ms from Ashburn and 25 ms from Frankfurt. Vercel's four prefixes ("Atlanta", "Los Angeles"), WordPress.com ("San Francisco"), Hostinger's two parking prefixes ("Vilnius"), Render, Nameshift ("Amsterdam") and Bodis ("Tampa") behaved the same way. Together these carry 8.96% of all websites in September 2026. A map built on geoIP alone would have put them in specific cities, and on specific grids.
Unicast checks re-located another 1.33% of websites, either pinning them to a probe's metro or taking away a metro geoIP had wrongly given them:
- Pinned elsewhere. Confluence Networks' parking fleet is in Dallas (0.8 ms), not Jacksonville.
- Not in Ashburn. DB-IP says Ashburn for BuyDomains' for-sale lander and for Newfold's
209.17.116.0/24, but they answer three Ashburn probes in 10–15 ms. - Not in Melbourne. Trellian's "Melbourne" parking servers are within 450 km of Los Angeles.
Refuted addresses keep their country when a probe bounds it, but lose their metro, state and grid ("unresolved", 0.75% of websites).
How good is the geoIP tier? Where a cloud region tag gives the answer, DB-IP names the same metro for 93.4% of the websites involved (87.8% if place-name mismatches such as Eemshaven/Groningen count as misses). For the websites AWS places in us-east-1 the agreement is 99.9%. It falls to 49.9% for us-west-2, which DB-IP spreads across Portland and Silicon Valley. And it is 0% for Google's us-east4, which Google documents as Ashburn but DB-IP (following Google's own geofeed) places in "Washington DC".
For the geoIP-only part of Northern Virginia itself, we drew a weight-proportional sample of 20 addresses and tested each from Ashburn:
- Confirmed: 14 answered in 0.5–1.9 ms.
- Refuted: 5 answered in 10–19 ms from three Ashburn probes.
- No reply: 1.
That is 74% precision by count and by weight. Applied to the whole geoIP-only slice, it means Northern Virginia's 3.53% may overstate by up to about 0.2 points. The region-tagged part alone is 2.80%.
At country level, DB-IP agrees with the crawler's own geoIP (taken at crawl time) for 91.5% of geoIP-tier websites in April 2023 and 90.6% in September 2026. The disagreement is between databases, not a decay with age. Applying the September 2026 AWS, Google and Oracle files to the April 2023 crawl instead of the contemporaneous ones changes Northern Virginia's share by less than 0.001 points (3.716% either way).
Known limitations.
- Front door only. We see the address a website's name resolves to, not the origin server behind a CDN, and not the backend a site calls. The October 2025 outage broke sites through DynamoDB, not through their A records. Everything here is a lower bound on dependency.
- Domains, not traffic or power. A parked page and a bank count the same. Nothing here converts to megawatts, and nothing here tests the "70% of traffic" claim, which is about packets.
- IPv4 only. Website records here are A records; a website reachable only over IPv6 is not measured (see The IPv6 Mirage for how far the two address families diverge).
- Current files applied backwards. The Azure, geofeed, edge and DB-IP files are September 2026 versions. The AWS/Google/Oracle test above suggests the effect is negligible, but an address reassigned between providers during the window would be misplaced.
- Grid by state. Split states follow their main data-center metro. The Azure East US regions are counted to Virginia but not to Northern Virginia, although they may well be there. AWS lists a us-east-1 zone "coming in 2026" in Maryland (AWS), which is also PJM.
- Excluded. Russian-administered TLDs are excluded from every figure.
Reproducibility. Per-chart CSVs are linked under each chart. The full 29-crawl series (grid-series.csv), the per-TLD cut (grid-tlds.csv) and every RTT measurement with its verdict and Globalping measurement ID (grid-rtt-verdicts.csv) are published alongside.
The Scorecard
| April 2023 | September 2026 | |
|---|---|---|
| Websites | 169.3M | 289.7M |
| Share of all websites answering from Northern Virginia | 3.72% | 3.53% |
| … in websites | 6.3M | 10.2M |
| … answering only from Northern Virginia | 3.67% (6.2M) | 3.48% (10.1M) |
| … of websites with a single location (non-edge) | 5.35% | 6.67% |
| … of websites located in the US | 16.7% | 20.0% |
| … of the live web | 3.72% | 2.61% |
| … of the parked web | 3.68% | 6.28% |
| … of the fixed panel (same websites both years) | 3.74% | 4.08% |
| … of the live fixed panel | 3.65% | 3.24% |
| Virginia, whole state (adds Azure East US / East US 2) | 3.81% | 3.66% |
| Region-tagged part of Northern Virginia (AWS / Google / Oracle) | 2.12 pts (57%) | 2.80 pts (79%) |
| PJM, all 13 states + DC | 6.25% | 5.40% |
| Edge / anycast — no single grid | 30.56% | 47.02% |
| Fortune 500 corporate websites in Northern Virginia | 7.8% | 7.3% |
| Fortune 500 corporate websites on the edge | 32.8% | 50.4% |
One website in 28 answers from Northern Virginia. That is a lot for one metro, and nowhere near "most of the Internet". The region serves more websites than any country except the United States and Germany: 3.53%, against Hong Kong's 3.08%, the Netherlands' 2.32% and France's 2.21%. Among the websites we can place in the US, one in five is there. Data → inference: at the level of registered names, Northern Virginia is the largest single place the web lives, and its dependency footprint is 10 million websites answering from nowhere else. Implication: a regional power or network event in Loudoun and Prince William counties has a direct, DNS-visible blast radius of about 3.5% of the web, before counting the backends, APIs and CDN origins that DNS cannot see.
Where the web answers from
| Rank | Location | Share of websites | Evidence | Grid |
|---|---|---|---|---|
| — | Edge / anycast (all networks) | 47.02% | edge lists + RTT | none |
| 1 | Northern Virginia | 3.53% | 79% region tag, 21% geoIP | PJM (Dominion zone) |
| 2 | Hong Kong | 3.08% | 91% geoIP | Hong Kong |
| 3 | Phoenix | 2.45% | geoIP | US West, non-RTO |
| 4 | Karlsruhe (IONOS) | 1.75% | geoIP | Germany |
| 5 | Los Angeles | 1.48% | 87% geoIP | California |
| 6 | Frankfurt | 1.48% | 67% geoIP, 18% region tag | Germany |
| 7 | Amsterdam | 1.28% | 90% geoIP | Netherlands |
| 8 | Tokyo | 1.27% | 90% geoIP | Japan |
| 9 | Silicon Valley–Bay Area | 1.22% | 65% geoIP, 25% region tag | California |
| 10 | Cologne–Düsseldorf | 1.21% | geoIP | Germany |
| 11 | Roubaix–Lille (OVH) | 1.10% | geoIP | France |
| 12 | Atlanta | 1.03% | geoIP | US Southeast, non-RTO |
| 13 | Falkenstein (Hetzner) | 0.98% | geoIP | Germany |
| 14 | Dallas–Fort Worth | 0.94% | 50% RTT, 37% geoIP | ERCOT |
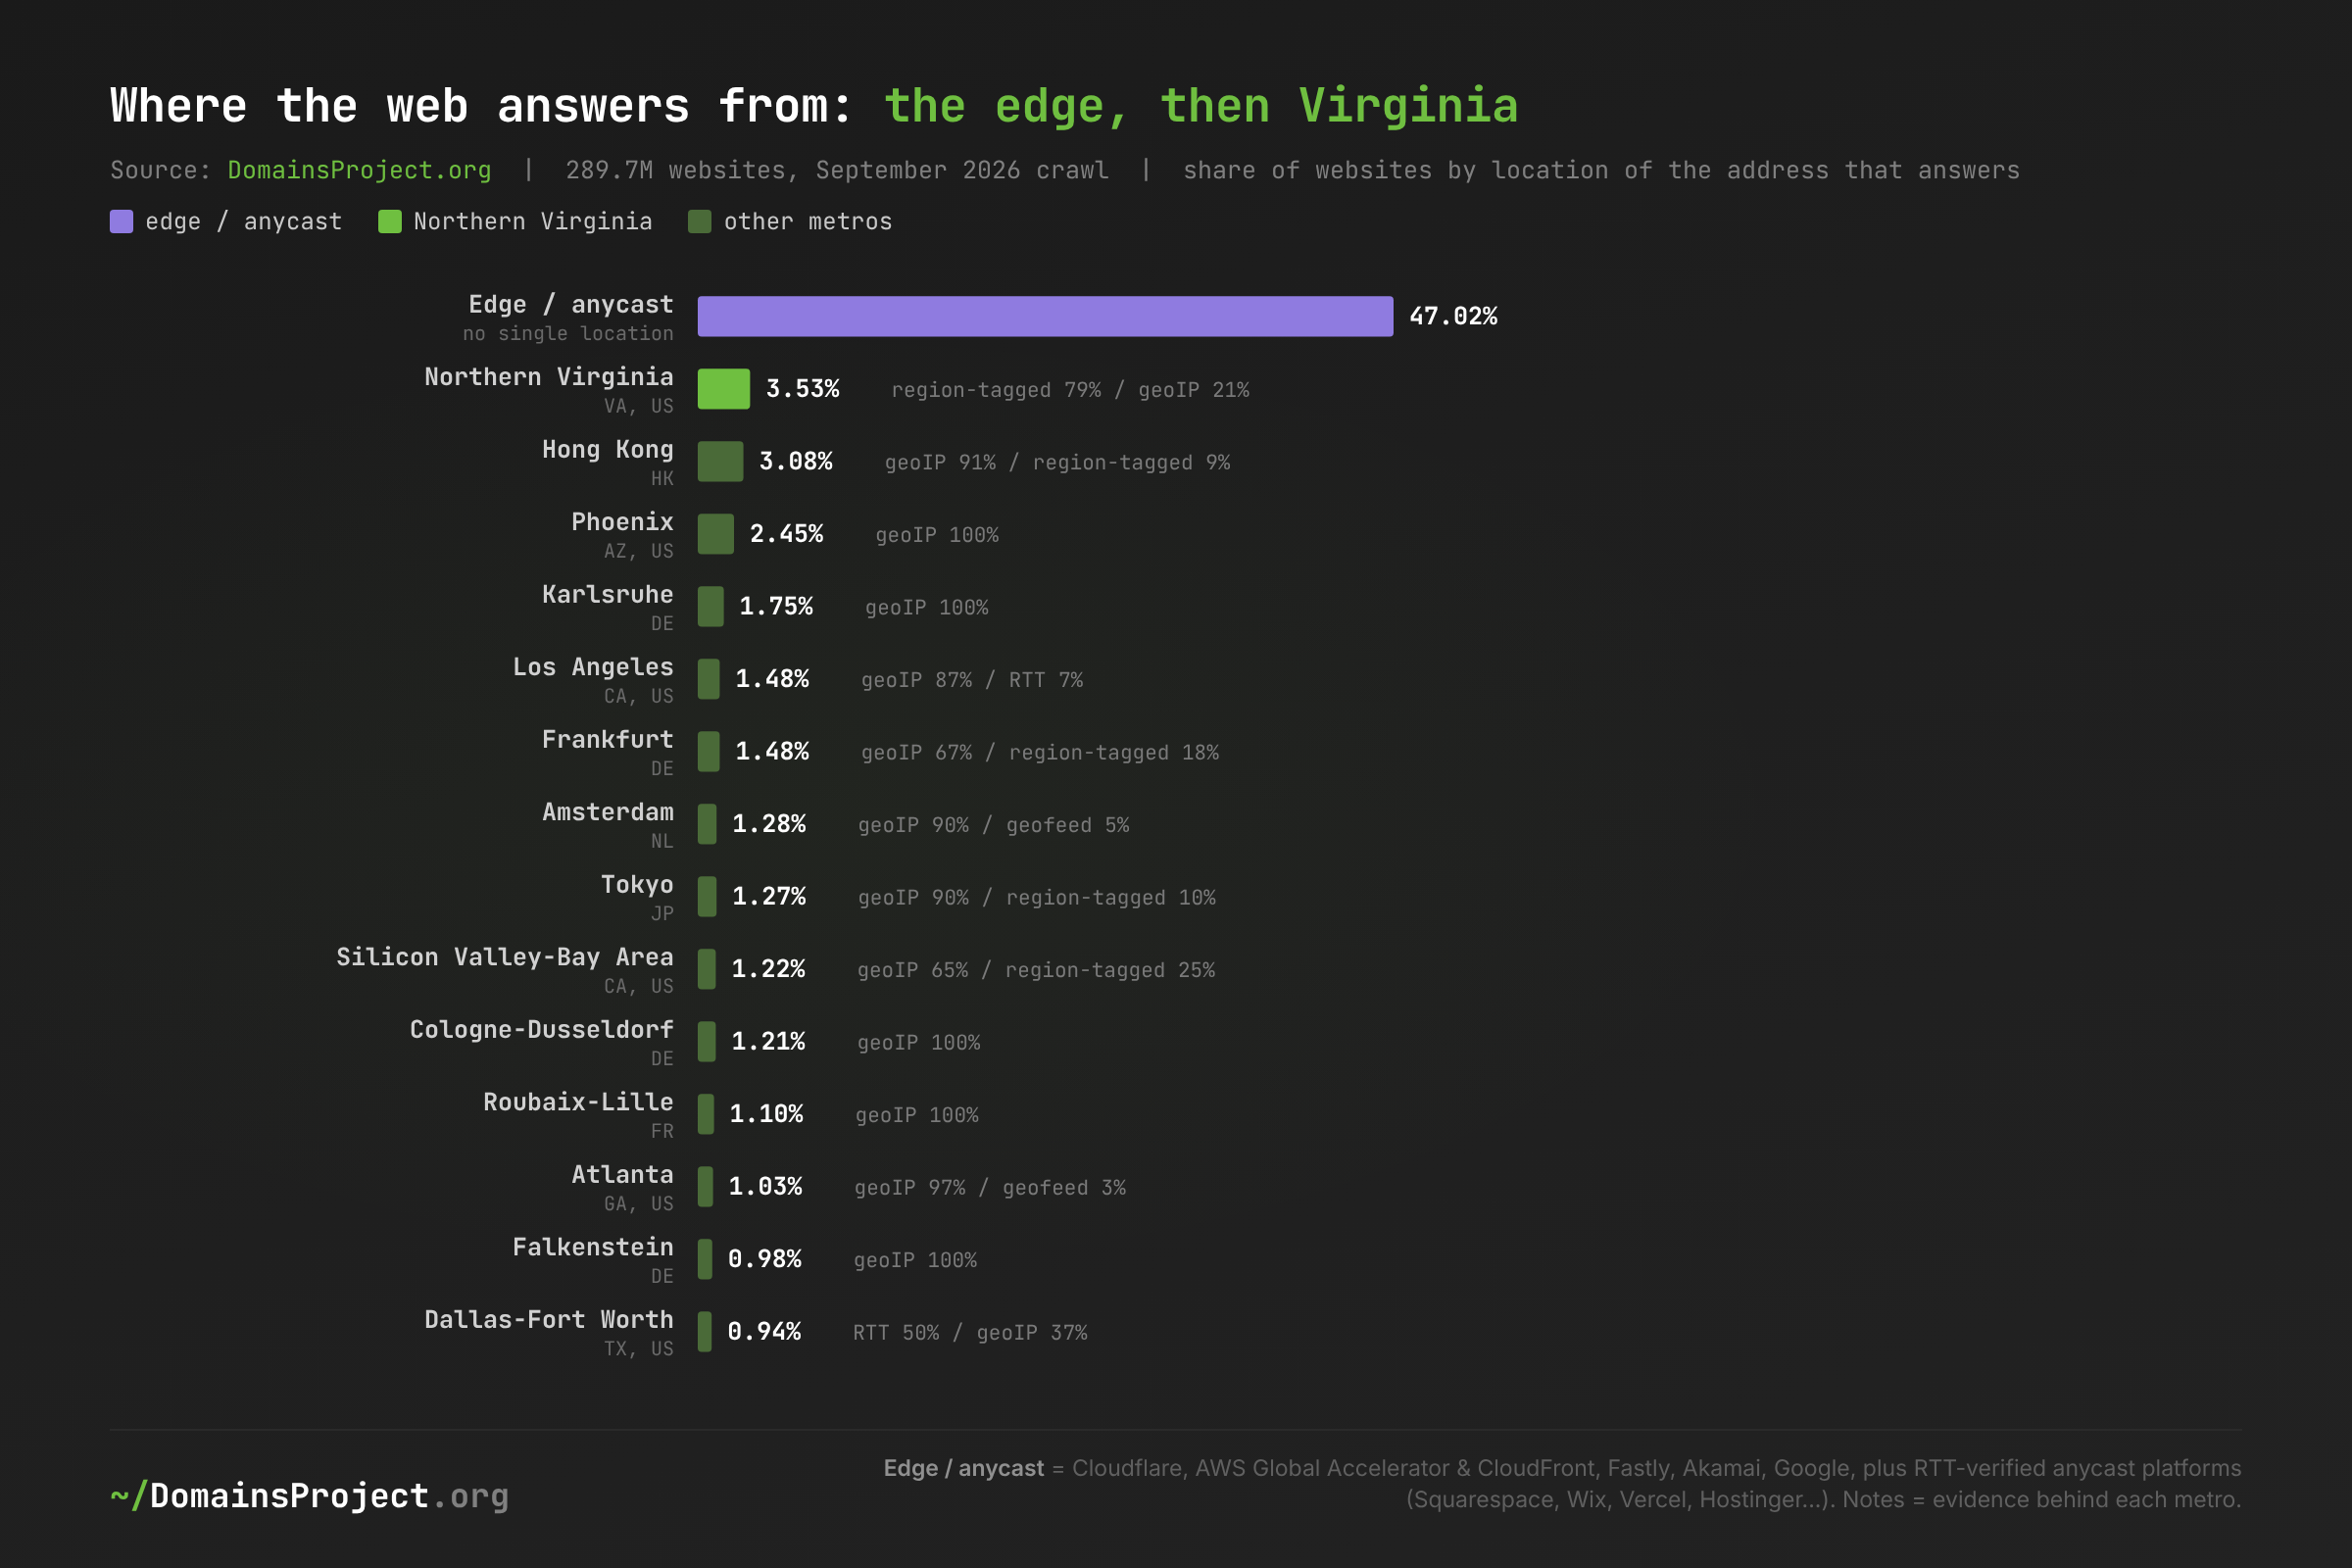
Download: grid-metros.csv — share of 289.7M websites, September 18, 2026 crawl; notes give the evidence tiers behind each metro.
Northern Virginia is first, by a margin smaller than the edge bucket's rounding error. It is also the best-evidenced entry on the list: four-fifths of its weight comes from AWS, Google and Oracle's own region tags, while almost every other metro rests on geoIP. That matters for two of the names below it. New York–New Jersey, which a geoIP-only map would rank second at 3.9%, falls to 0.74% once Squarespace's four addresses are recognised as anycast. Washington DC, which geoIP gives 2.7%, falls to 0.18% once Wix's are.
Ashburn Is Not a Country, But It Beats Most of Them
| Northern Virginia's share of… (Sep 2026) | |
|---|---|
.us websites |
9.34% (23.9% of located) |
.com |
5.65% (12.1% of located) |
.ca |
3.27% |
.ai |
3.19% (10.6% of located) |
.io |
3.12% |
.org |
2.95% |
.net |
2.59% |
.uk |
1.60% |
.nl |
0.82% |
.fr |
0.38% |
.de |
0.22% |
.cn |
0.15% |
Virginia's weight is an American and startup weight. A quarter of the .us websites we can place, and a tenth of located .ai and .com websites, answer from Northern Virginia. European ccTLDs barely touch it: 0.22% of .de websites and 0.38% of .fr answer from there, because Germany and France host their own. Data → inference: the region's footprint follows AWS's default region choice more than any national pattern. Implication: an outage in us-east-1 lands hardest on the American startup and SaaS web, whose names are disproportionately .com, .io and .ai, and hardly at all on the European small-business web.
The Fortune 500 is more exposed than the average website, and moving away. 7.3% of Fortune 500 corporate websites answer from Northern Virginia (7.8% in 2023). Another 2.4% sit in Azure East US, which Microsoft places only in "Virginia". But half of the Fortune 500 (50.4%, up from 32.8%) now answers only from edge networks — Cloudflare 17.9%, Akamai 14.7%, Fastly 6.8% — which hide their origins from DNS.
Virginia's Biggest Web Tenant Is a For-Sale Sign
| Who the websites answering from Northern Virginia belong to | April 2023 | September 2026 |
|---|---|---|
| HugeDomains (for-sale pages, AWS us-east-1) | 9.7% (0.61M) | 33.8% (3.46M) |
| AWS customers not in the front-door registry | 39.1% (2.46M) | 26.4% (2.70M) |
| Atom.com (for-sale, AWS us-east-1) | 3.8% | 8.9% |
| DreamHost (Ashburn data center, RTT-confirmed) | 6.3% | 4.5% |
| Newfold (Bluehost/HostGator family) | 12.1% | 4.2% |
| Netlify (AWS us-east-1) | 0.0% | 3.9% |
| GoDaddy front doors (AWS us-east-1) | 3.3% | 2.3% |
| Google Cloud us-east4 | 0.3% | 2.2% |
| Parked and for-sale, all operators | 16.5% | 44.7% |
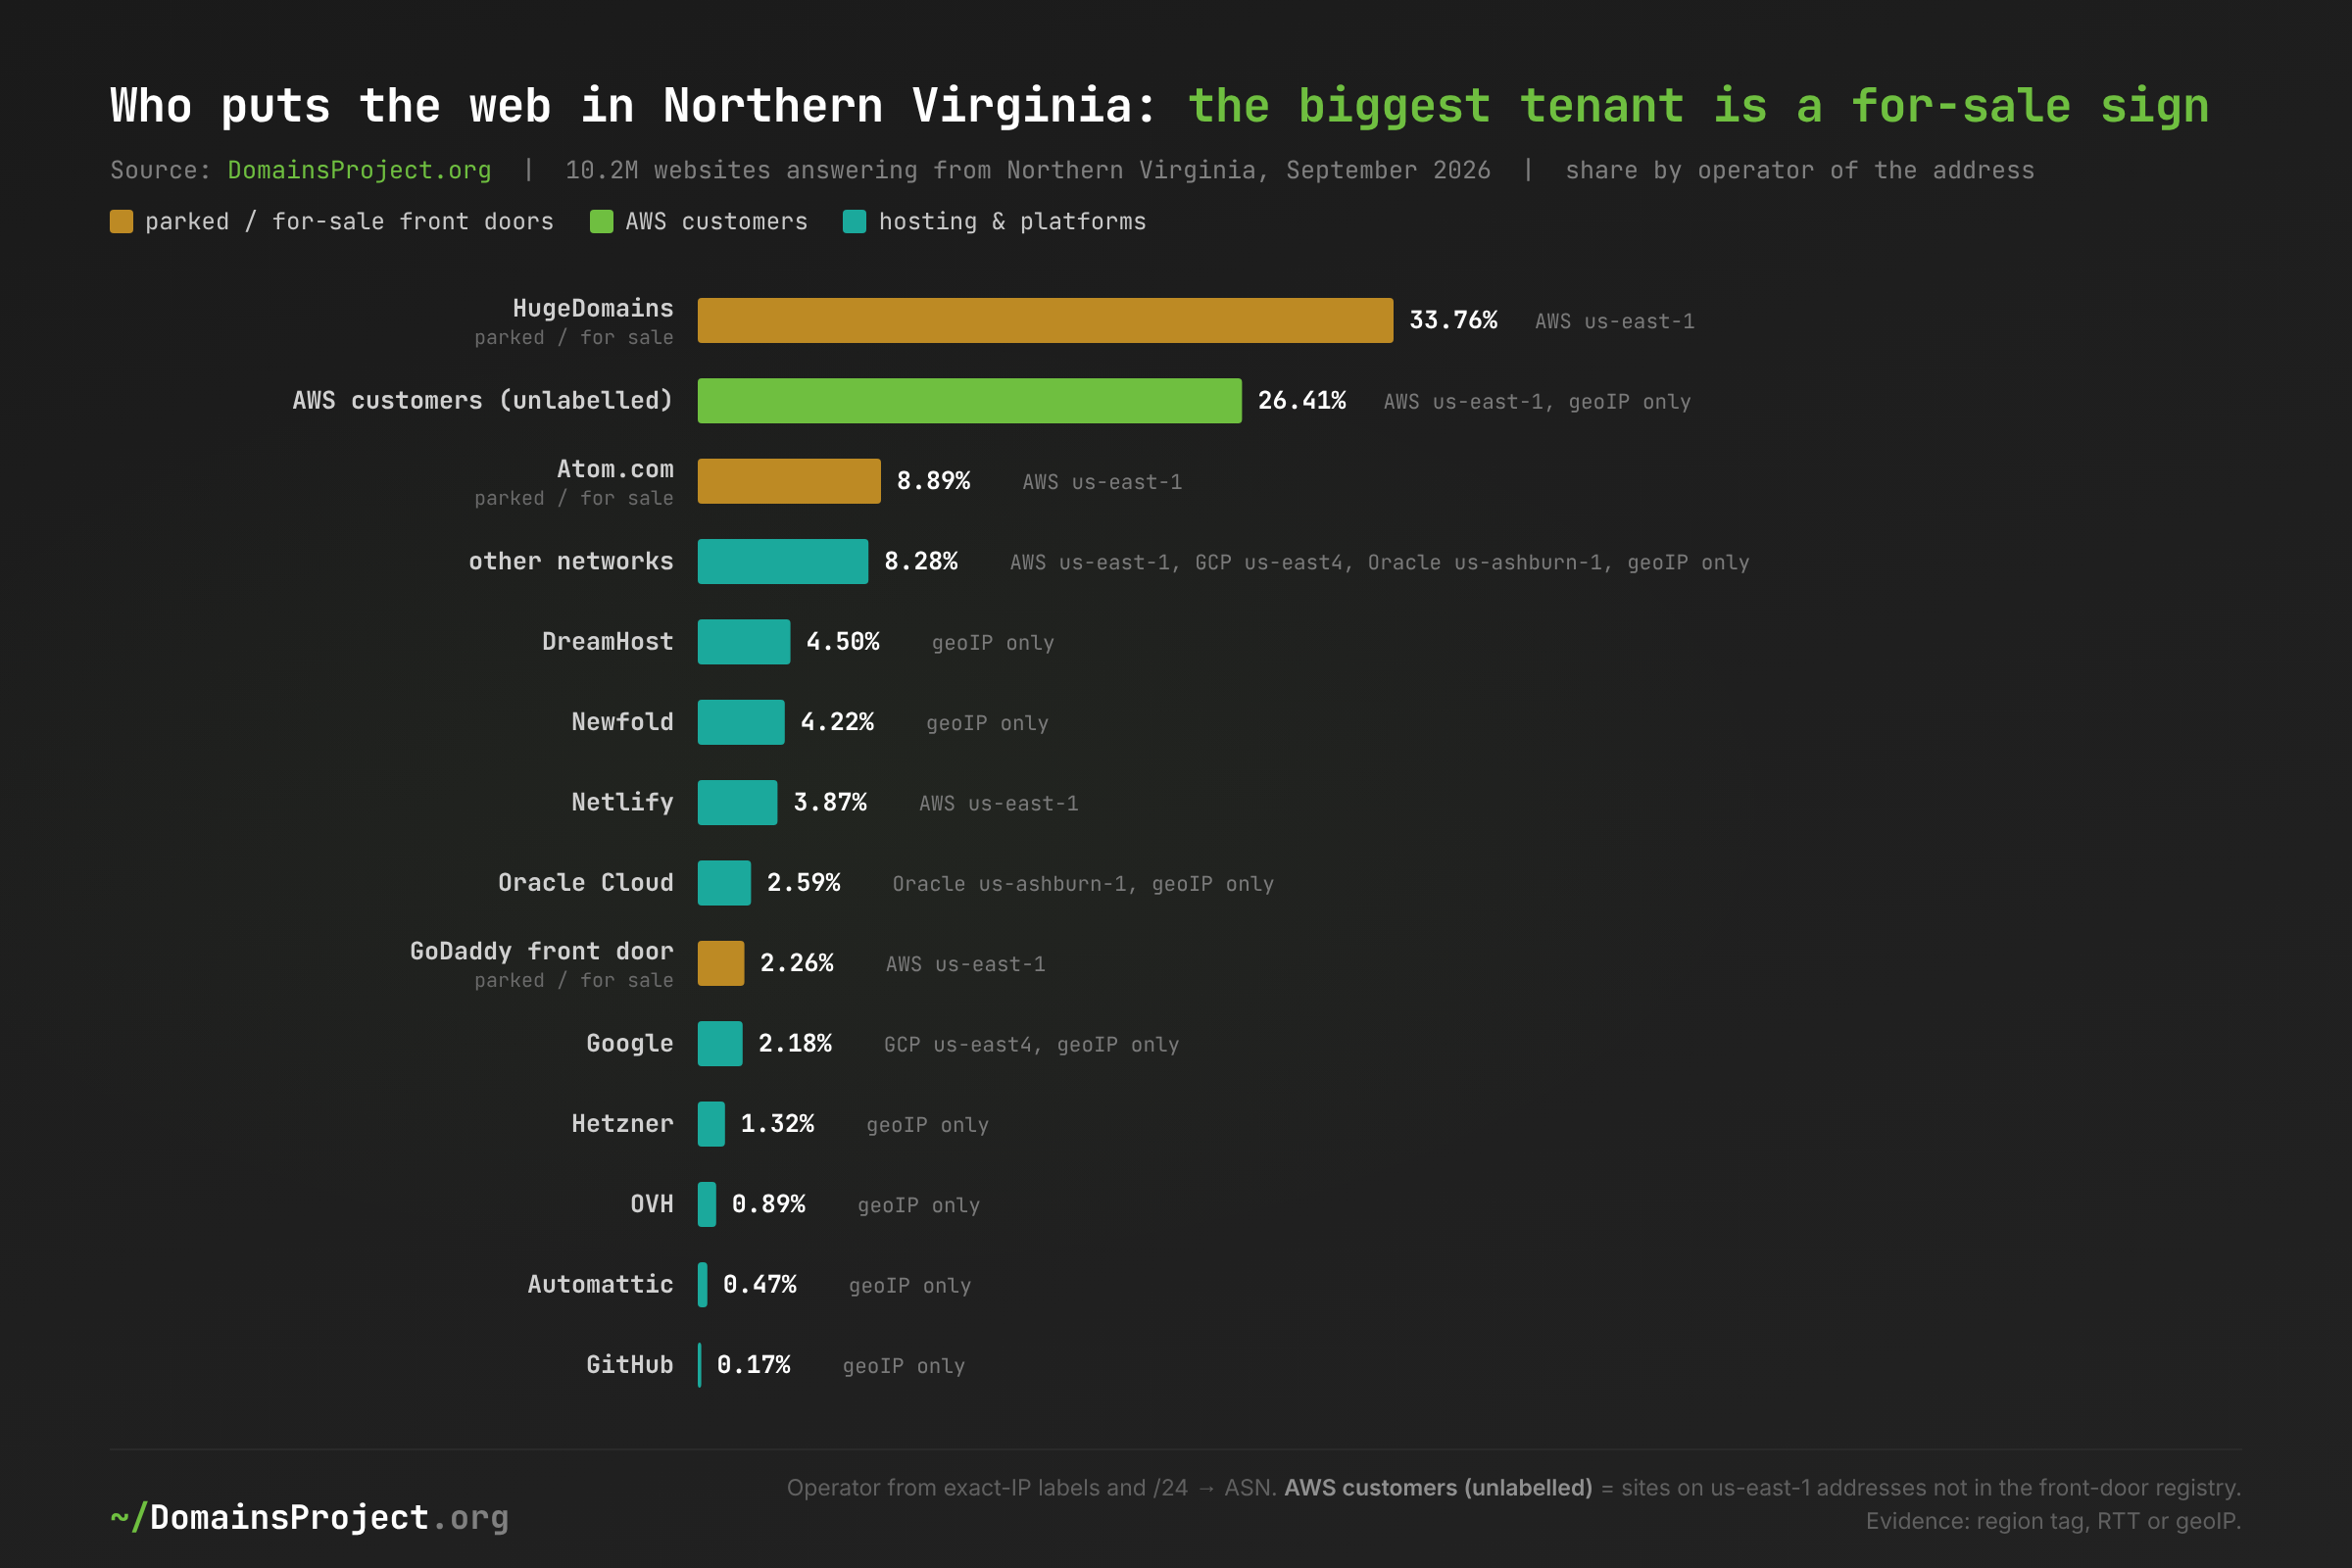
Download: grid-nova-who.csv — share of the 10.2M websites answering from Northern Virginia, September 2026; operator from exact-address labels and /24 → ASN.
The largest single tenant of Northern Virginia's data centers, counted by websites, is a domain-for-sale marketplace. HugeDomains serves 3.46 million for-sale pages from two AWS us-east-1 addresses, up from 0.61 million in 2023. It ran a 12-address EC2 fleet until August 2025 (#98). With Atom.com and GoDaddy's us-east-1 front doors, 44.7% of the websites answering from Northern Virginia are parked or for sale, up from 16.5%. That figure counts each website by its parked classification. The operator shares in the table are per address and sum to 45.0%, because a few websites mix a front-door address with a live one. Meanwhile, websites on AWS us-east-1 addresses outside the front-door registry — the customer web — grew 9.7% in count while the corpus grew 71%.
Data → inference: the growth in Virginia's website count since 2023 is almost entirely inventory, not publishing. Implication: for the grid and ratepayer debate, the web's dependency on Northern Virginia is smaller, and less valuable, than a raw count suggests. For registrars and marketplaces, one region holds a large share of the aftermarket's shop windows.
Did the Web Leave Virginia? Not Overall. Live Sites Did.
| Crawl | All websites | Live web | Parked web | Fixed panel | Live fixed panel | Share of located web |
|---|---|---|---|---|---|---|
| 2023-04-07 | 3.72% | 3.72% | 3.68% | 3.74% | 3.65% | 5.35% |
| 2024-02-14 | 3.36% | 3.44% | 3.04% | 3.81% | 3.69% | 5.21% |
| 2024-12-21 | 4.04% | 3.57% | 5.45% | 3.88% | 3.67% | 6.32% |
| 2025-06-24 | 3.82% | 3.01% | 6.13% | 4.13% | 3.51% | 6.65% |
| 2025-10-24 | 3.61% | 2.77% | 6.02% | 4.06% | 3.39% | 6.39% |
| 2026-04-17 | 3.53% | 2.69% | 5.83% | 4.07% | 3.33% | 6.39% |
| 2026-09-18 | 3.53% | 2.61% | 6.28% | 4.08% | 3.24% | 6.67% |
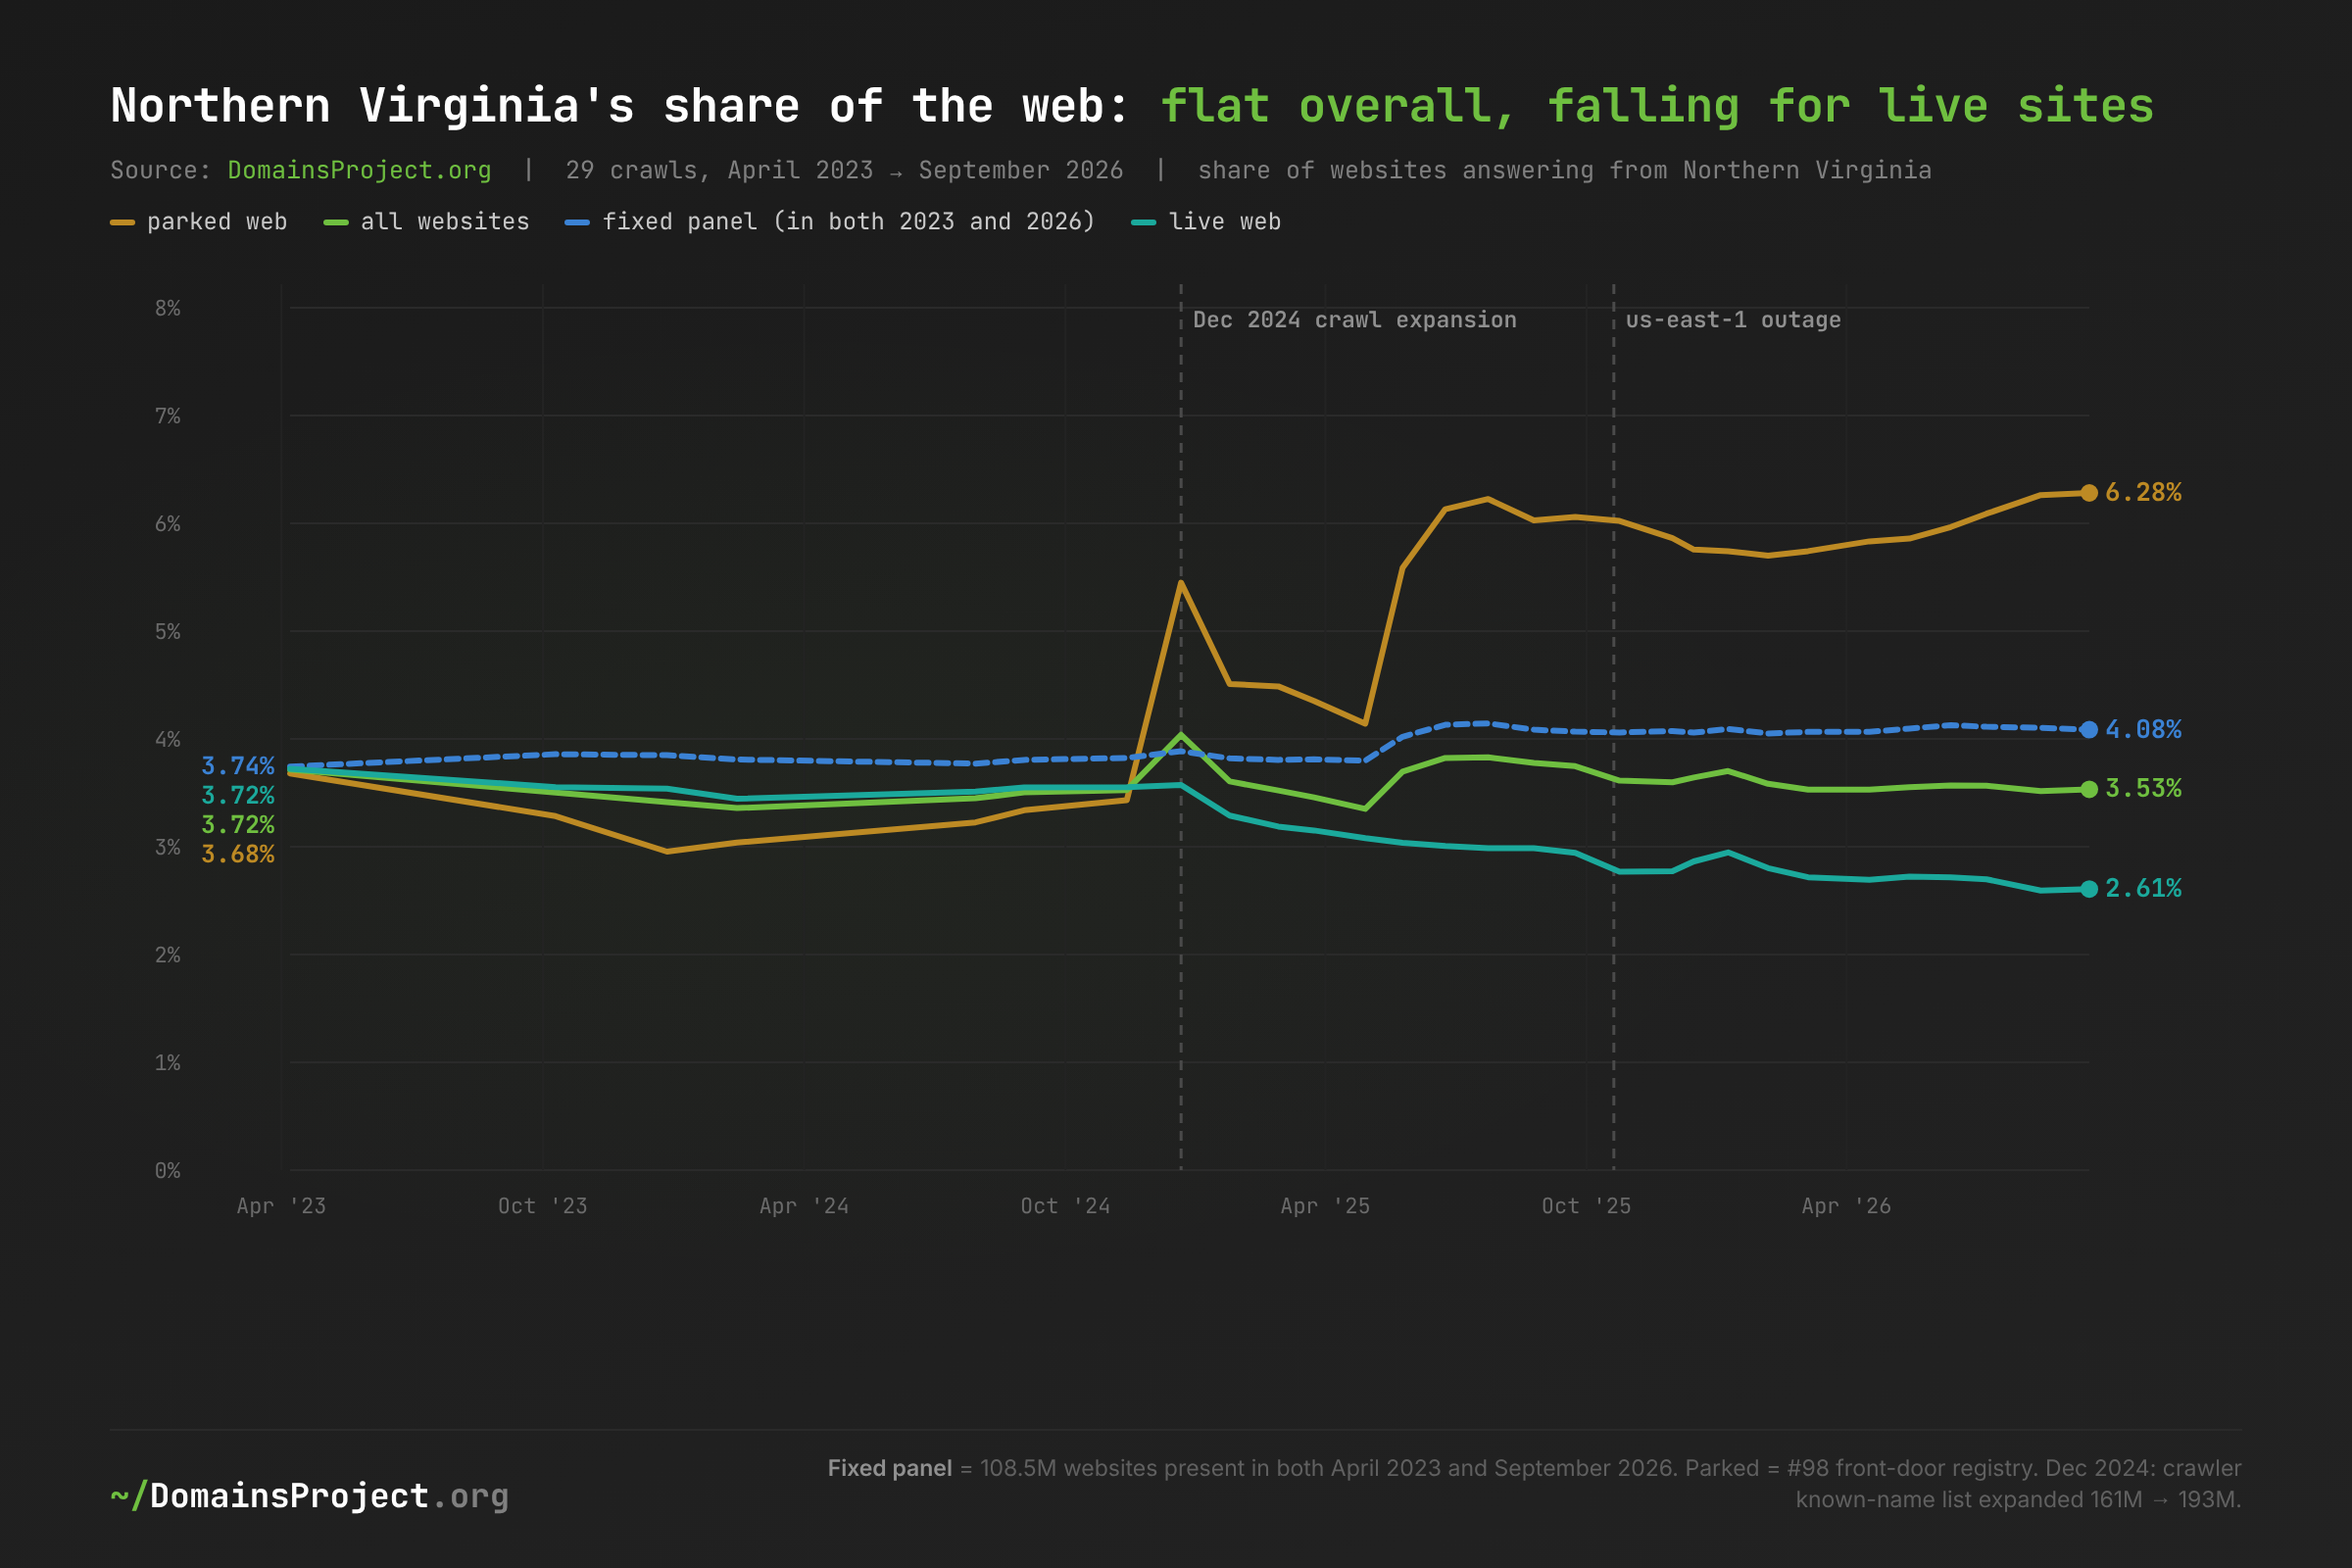
Download: grid-nova-trend.csv — share of websites answering from Northern Virginia per crawl, by group, with the evidence split (AWS / Google / Oracle region tag vs geoIP).
Over three and a half years, the web neither concentrated in Northern Virginia nor left it. The all-websites line never left a 3.35–4.04% band. Its one spike, December 2024, is the crawl expansion: the newly added names were disproportionately parked, and parked pages sit disproportionately in us-east-1. Under that flat line, two opposite movements cancel:
- The live web is leaving. Live websites answering from Northern Virginia fell from 3.72% to 2.61%. The composition-controlled line, live websites present in both 2023 and 2026, fell from 3.65% to 3.24%, so existing websites moved out, not only new ones arriving elsewhere. They did not move to Ohio or Oregon: AWS's regional share of the live web fell from 4.96% to 3.55% overall. They moved to the edge.
- Inventory is arriving. Parked pages in Northern Virginia went from 3.68% to 6.28% of the parked web.
Within AWS, Virginia gained. us-east-1's share of the live websites on AWS regional addresses rose from 35.5% to 42.4%. Counting parked pages, it went from 30.8% to 58.4%. That happened while us-east-1's share of AWS's own EC2 address space fell from 28.1% to 26.9% (AWS ip-ranges.json, March 2023 vs September 2026). The October 2025 outage is not clearly visible. The live share dipped from 2.94% in the crawl before it to 2.77% in the crawl after, and partly recovered by January 2026 (2.95%). That dip is the same size as October 2023's (−0.17 points), which had no outage behind it. With one crawl on each side, we cannot separate a response to the outage from noise. Data → inference: the websites leaving Virginia are leaving hosting-in-a-place altogether, while the websites staying on AWS increasingly stay in its default region. Implication: the concentration risk inside AWS is growing even as Virginia's share of the whole web holds still.
The Web Is Leaving the Map
| Edge network (share of all websites) | April 2023 | September 2026 |
|---|---|---|
| AWS Global Accelerator (mostly GoDaddy parked front doors) | 5.04% | 20.24% |
| Cloudflare | 8.51% | 16.10% |
| Squarespace (RTT-proved anycast) | 2.37% | 3.20% |
| Wix (RTT-proved anycast) | 3.85% | 2.54% |
| Vercel (RTT-proved anycast) | 0.17% | 1.37% |
| Hostinger (RTT-proved anycast) | 0.00% | 1.11% |
| WordPress.com / Automattic (RTT-proved anycast) | 0.87% | 0.53% |
| Fastly | 0.55% | 0.51% |
| AWS CloudFront | 0.29% | 0.40% |
| Google Cloud global load balancing | 6.82% | 0.40% |
| Google front ends (Blogger, Sites) | 1.13% | 0.35% |
| Bodis (RTT-proved anycast; shut down January 31, 2026) | 0.79% | — |
| Render, Nameshift, Akamai, Azure Front Door | 0.16% | 0.27% |
| Total edge / anycast | 30.56% | 47.02% |
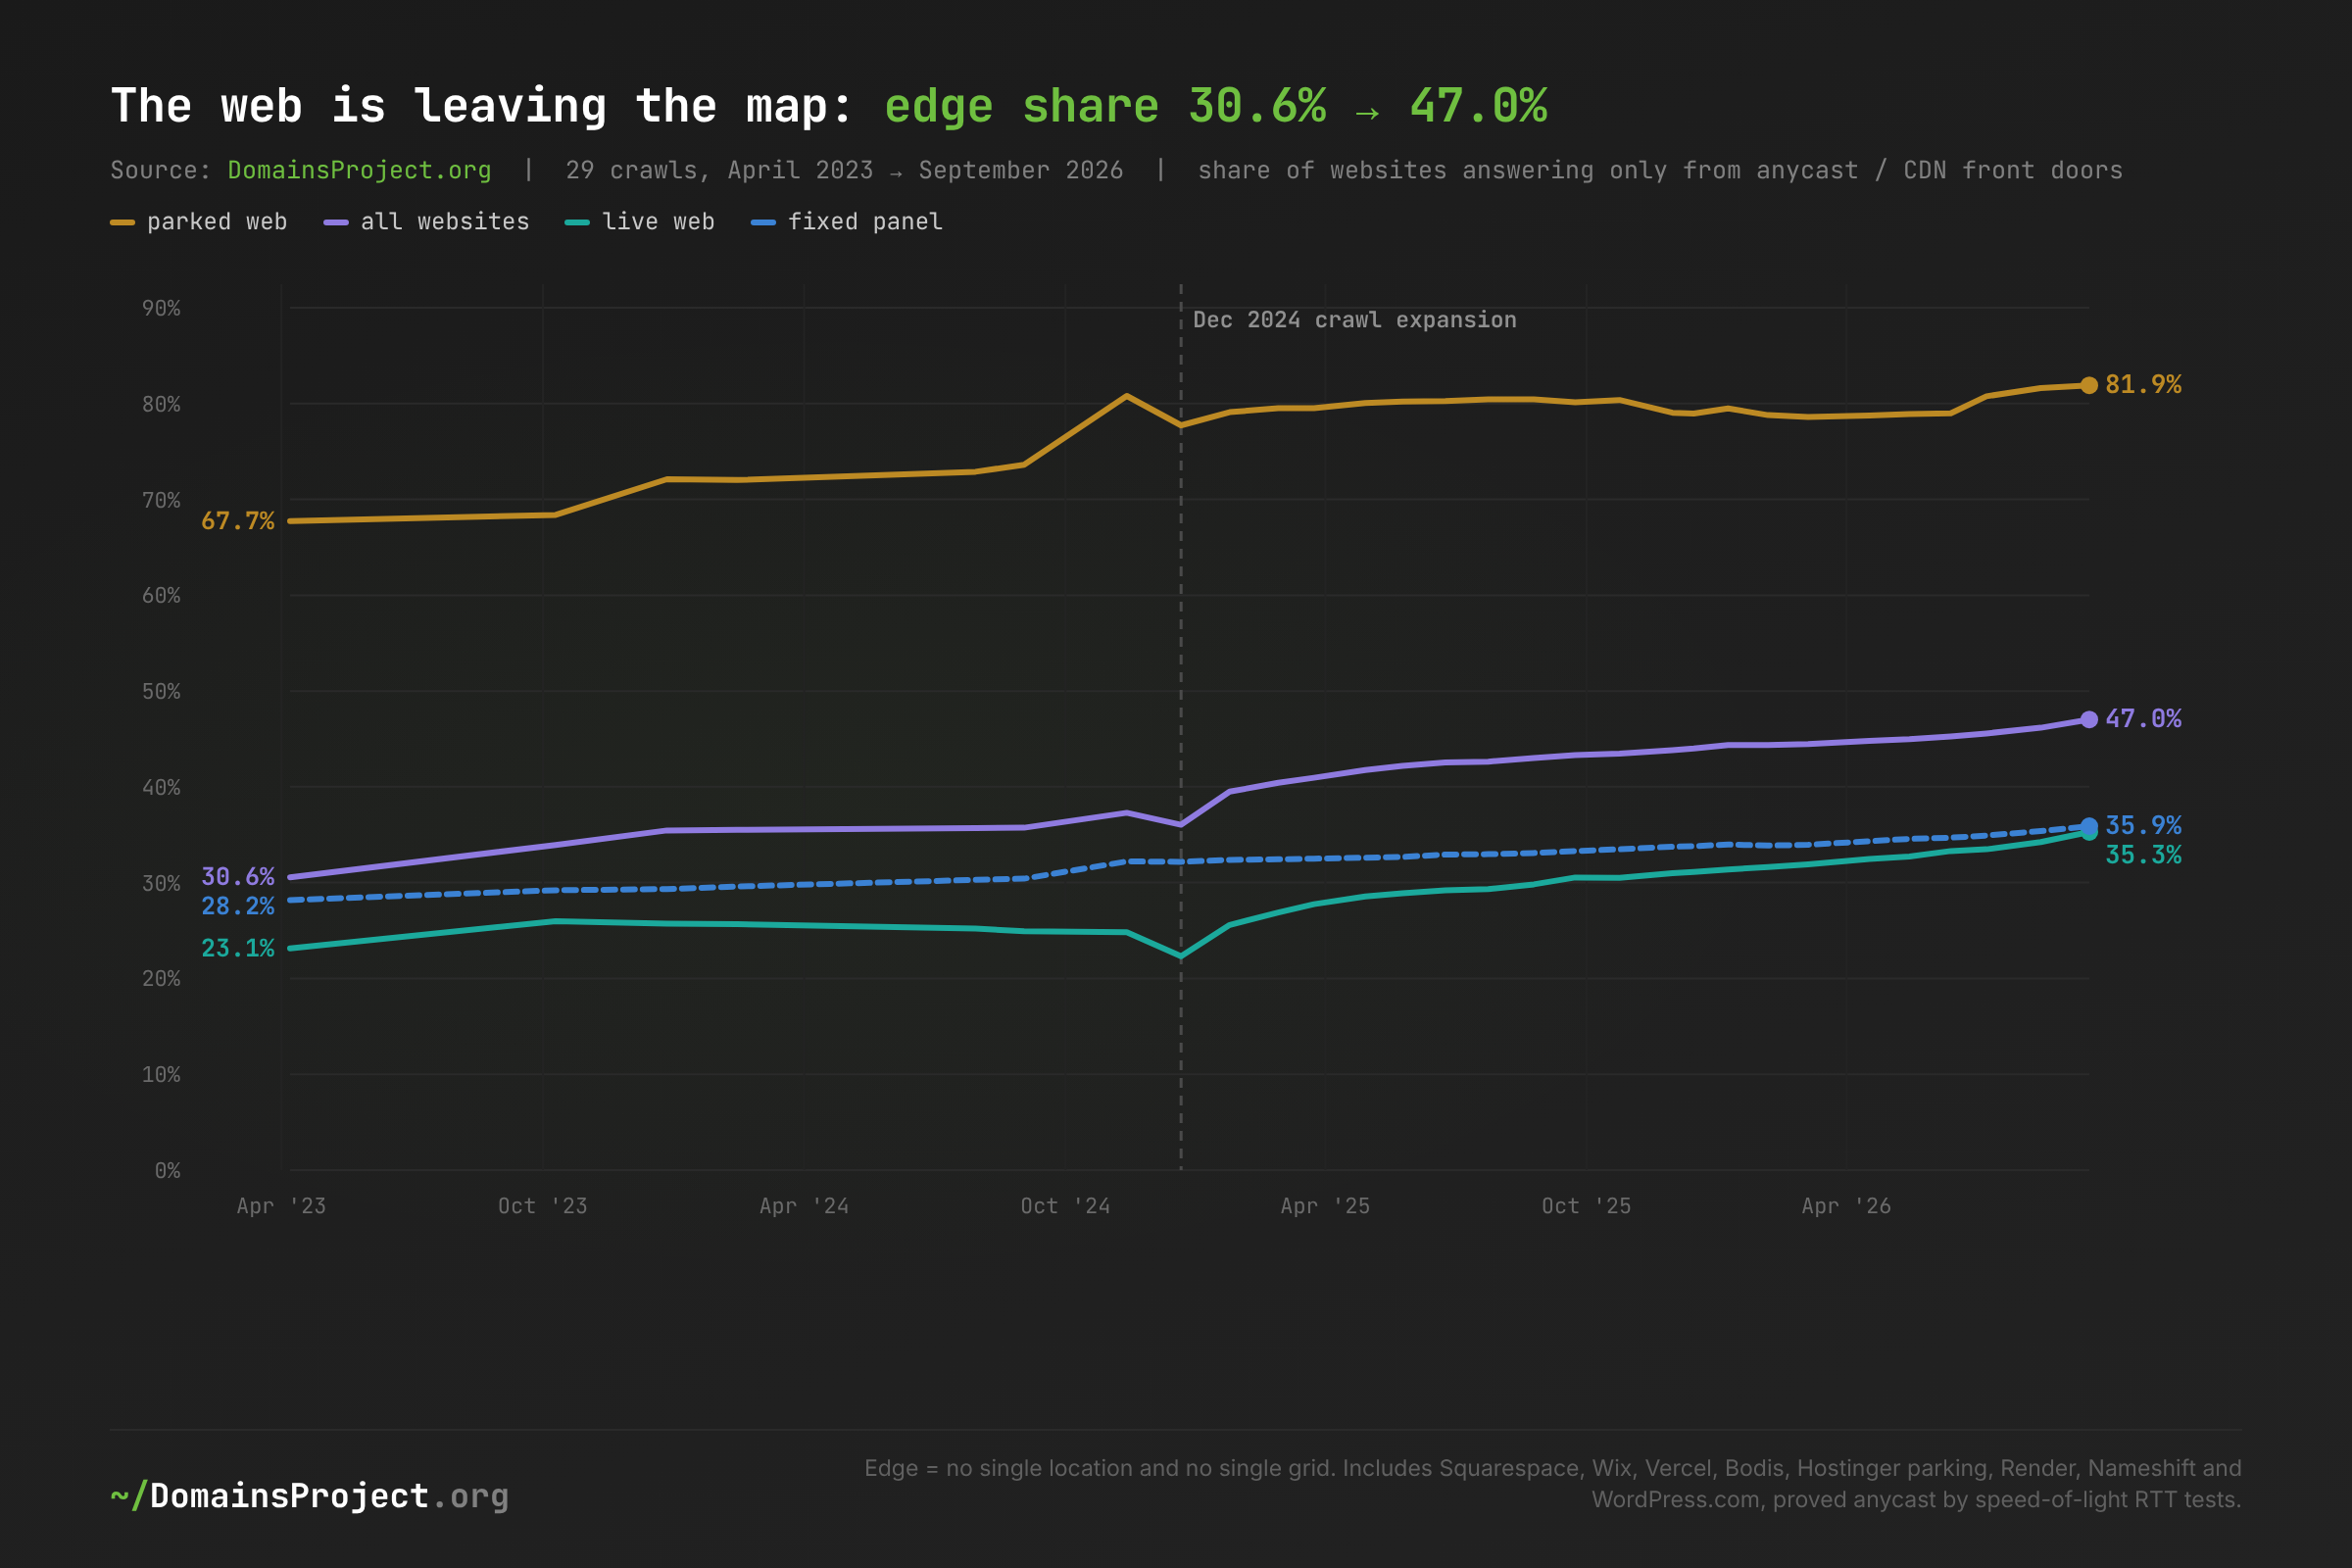
Download: grid-edge-trend.csv — share of websites answering only from edge/anycast front doors per crawl, by group.
Almost half of all websites now answer from networks that have no single location, and therefore no single grid. The share rose from 30.6% to 47.0%. For live websites it rose from 23.1% to 35.3%. On the fixed panel of websites present in both years it rose from 28.2% to 35.9%, so existing sites are switching, not only new ones arriving on edge platforms. Parked pages were already mostly anycast (67.7%) and are now 81.9%, after GoDaddy moved its landers from a Google global load balancer to AWS Global Accelerator in 2023 (#95).
Anycast is not "nowhere". A Cloudflare website is served to Virginia visitors from Ashburn and to Frankfurt visitors from Frankfurt. In an Ashburn power event its Virginia traffic fails over to the next city. What anycast removes is a single grid dependency, not a physical one. Data → inference: the growth of the edge bucket, not any drift between regions, is the dominant change in where the web lives. Implication: "which grid is this website on?" has become the wrong question for half the web. The right one is "where is its origin?", and DNS cannot answer it. The providers can.
The Grid Map: PJM, Germany, and No Grid at All
| Grid (share of all websites) | April 2023 | September 2026 |
|---|---|---|
| No single grid (edge / anycast) | 30.56% | 47.02% |
| Germany (four TSOs) | 11.66% | 8.98% |
| PJM (13 states + DC; Northern Virginia is 65% of it) | 6.25% | 5.40% |
| US West, non-RTO (Phoenix, Oregon, Utah, Washington…) | 5.28% | 4.01% |
| Hong Kong | 1.76% | 3.08% |
| California (CAISO + municipal BAs) | 3.07% | 3.07% |
| Netherlands | 3.23% | 2.32% |
| France | 3.69% | 2.21% |
| US Southeast, non-RTO | 2.38% | 1.83% |
| ERCOT (Texas) | 1.68% | 1.07% |
| MISO | 2.06% | 0.75% |
| ISO-NE | 0.16% | 0.61% |
| SPP | 0.53% | 0.41% |
| NYISO | 0.67% | 0.32% |
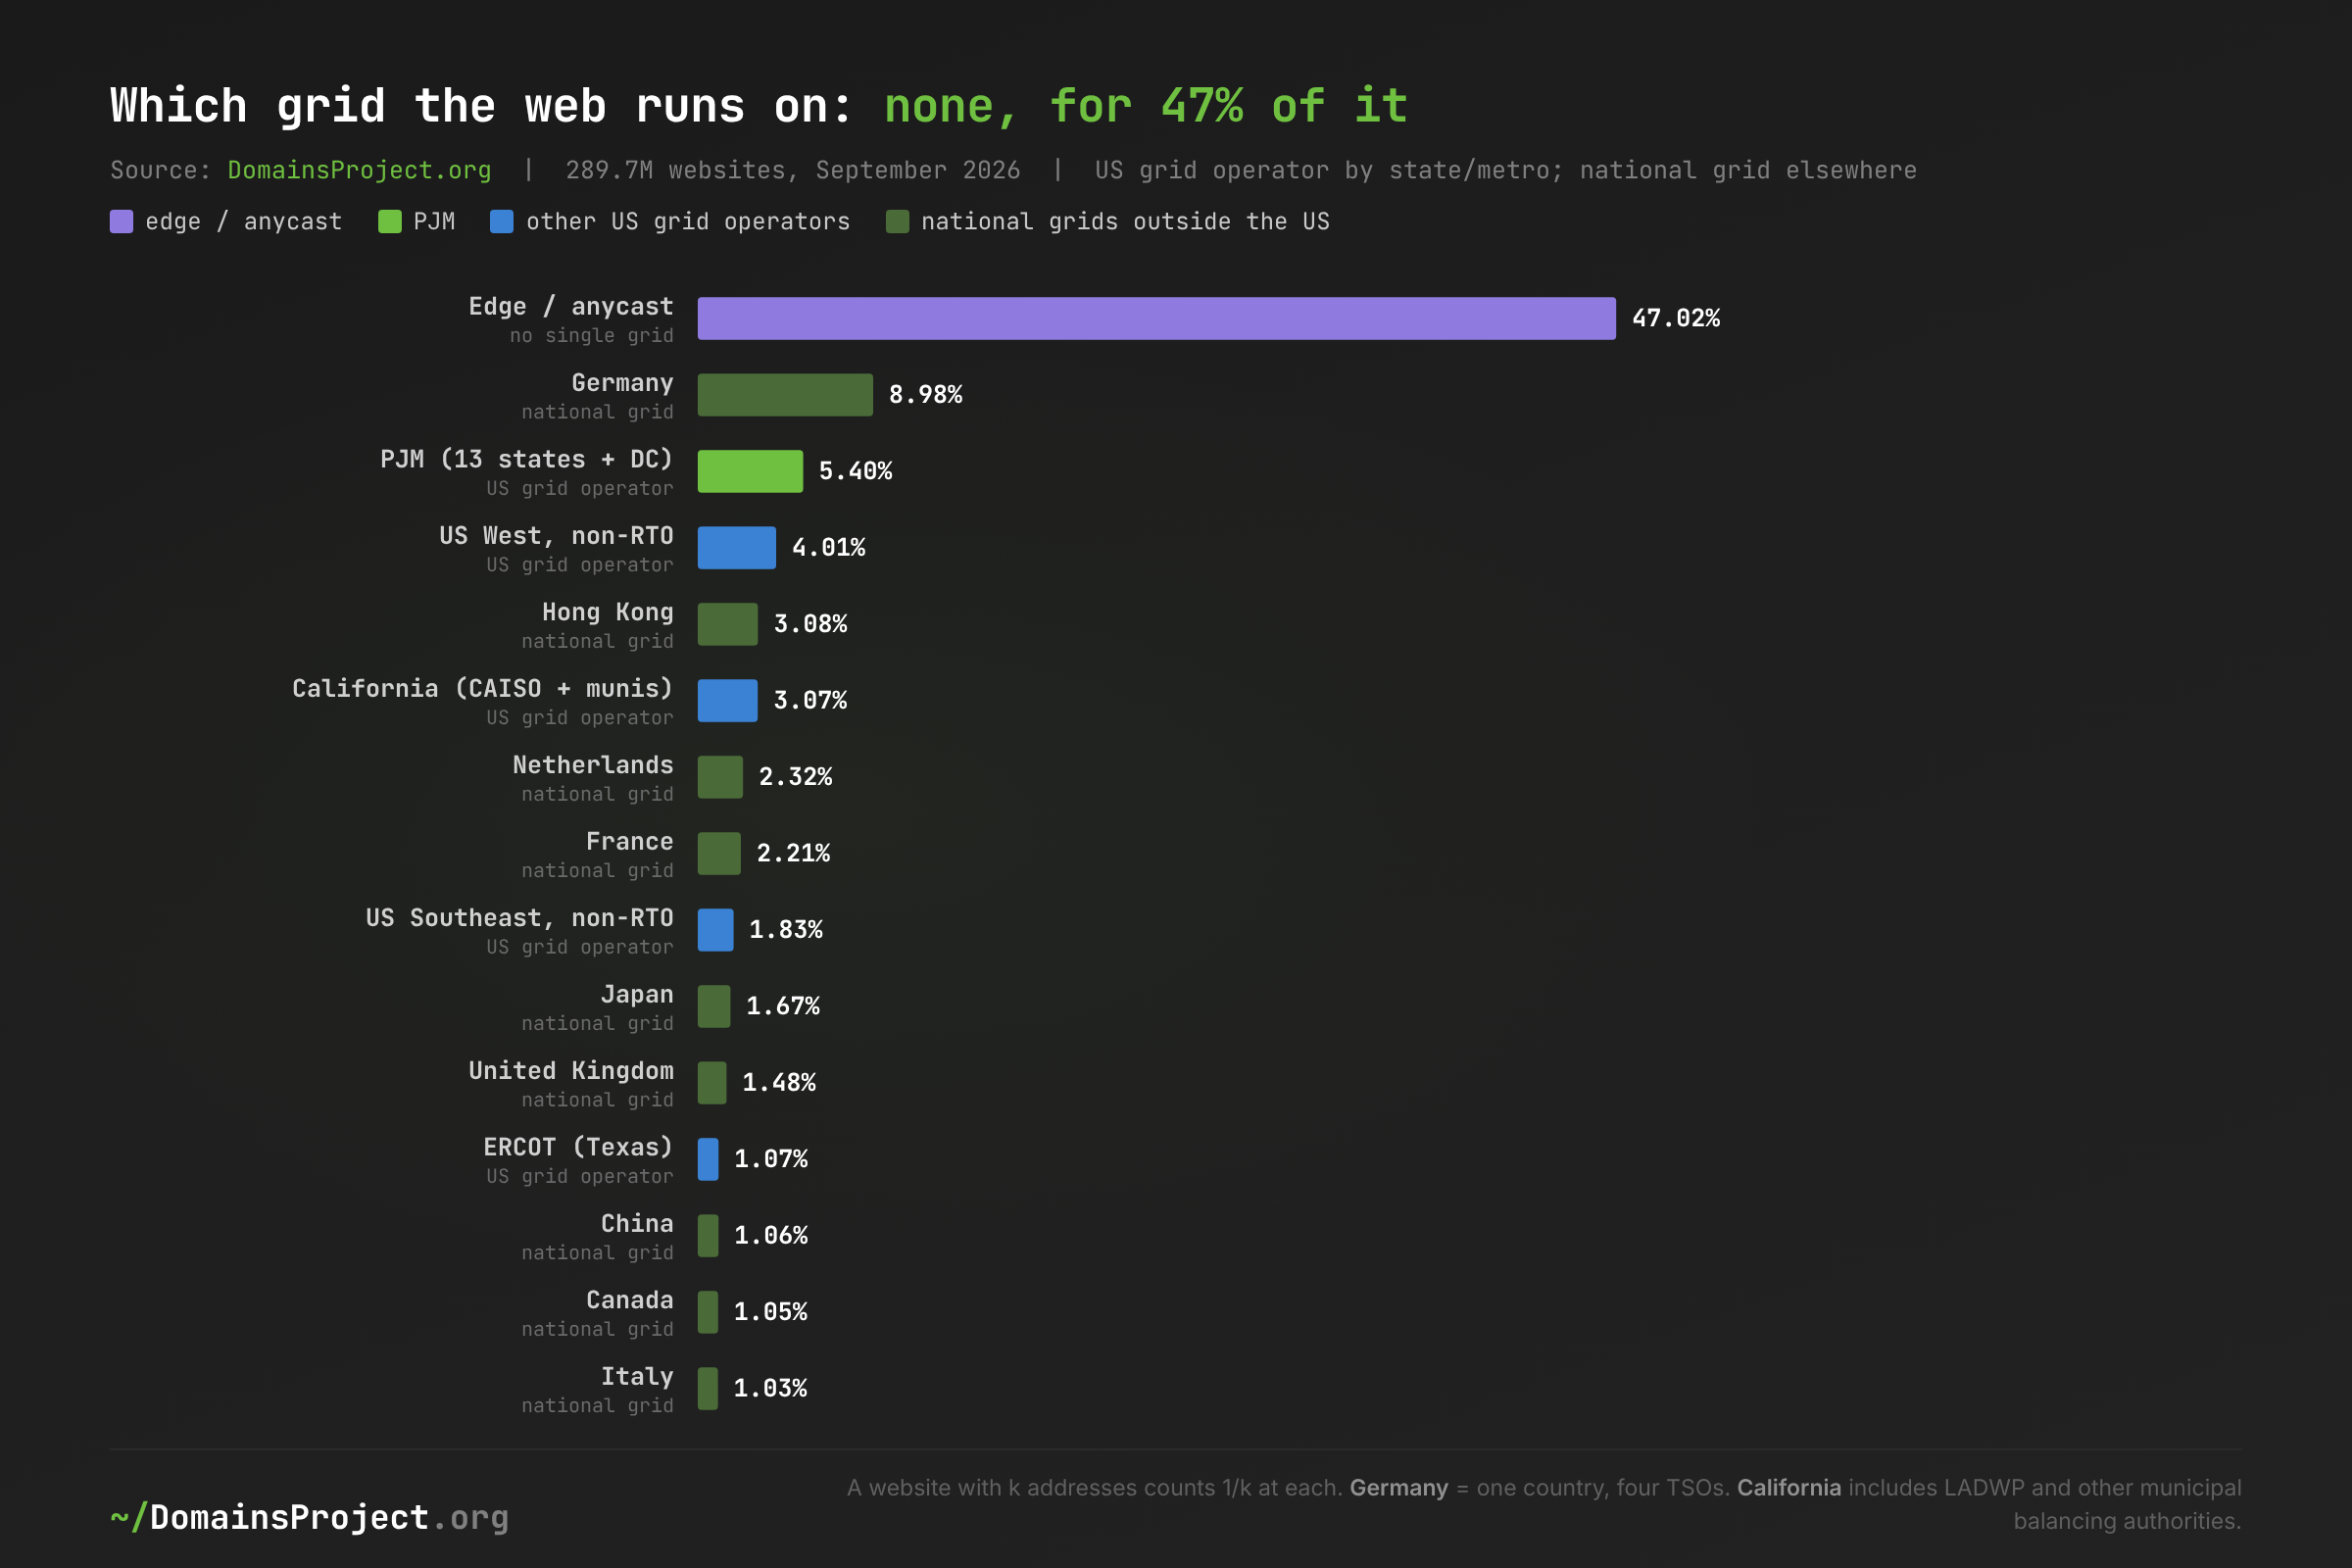
Download: grid-operators.csv — share of 289.7M websites by US grid operator (state/metro rule) or national grid, September 2026.
PJM is the largest US grid for websites, and Germany's grid is larger than any US one. PJM carries 5.40% of all websites, and two-thirds of that is Northern Virginia. Germany carries 8.98%, on Hetzner, IONOS, Strato and the country's many regional hosts. Germany is one country with four transmission operators and PJM is one operator across thirteen states, so the comparison is between grids as a website would experience them, not between organisations. ERCOT, where Texas's data-center boom is sited, carries 1.07% of websites, down from 1.68%. Data → inference: the grids where data-center load is growing fastest are not where the registered web lives; that load is AI training, cloud backends and enterprise workloads, not websites. Implication: ratepayer arguments that invoke "keeping the Internet on" overstate what is at stake for the web itself, and in particular for Texas.
Dublin's Grid Problem Is Not a Web Problem
Ireland's data centres used 23% of the country's metered electricity in 2025, up from 5% in 2015 (CSO). Ireland serves 0.28% of the world's websites, down from 0.96% in April 2023; Dublin (AWS eu-west-1 and Azure North Europe) serves 0.27%, down from 0.93%.
The drop has two identifiable causes. We sampled tenants of Dublin's five busiest AWS addresses in April 2023 and looked them up live:
- Jimdo sites now answer from Cloudflare (
162.159.128.70, the address #97 traced to Jimdo). - Customers of the Dutch host Mijndomein now answer from Mijndomein's own addresses in the Netherlands.
Europe's hub cities shrank as a group: Frankfurt 2.89% → 1.48%, Amsterdam 1.91% → 1.28%, London 1.78% → 0.90%, Paris 0.93% → 0.64%. Data → inference: Ireland's electricity problem is driven by hyperscale workloads that have little to do with serving websites, and the websites it did serve are moving to the edge or home to their own countries. Implication: the European analogue of the Virginia debate is even further removed from the web than the American one.
What's at Stake
- About 10 million websites have no location outside Northern Virginia — 3.48% of the web. A regional event there — power, cooling, a transit cut, or another control-plane failure like October 2025 — has a direct, DNS-visible reach of one website in 29, before counting the backends those websites call. That is large for one place, and small next to the "70% of the Internet" slogan the region's boosters still use.
- Inside AWS, concentration is rising. 42.4% of the live websites on AWS regional addresses are in us-east-1, up from 35.5%. The companies still hosting on AWS increasingly pick its default region. The October 2025 outage did not measurably change that.
- Half the web's grid dependency is invisible. For the 47% on anycast and CDN front doors, the edge fails over, but the origin behind it sits somewhere DNS cannot see. The cloud edge providers know where their customers' origins are; nobody publishes the aggregate. Any statement about "how much of the web depends on Virginia" that ignores this half is guessing.
- Virginia's web growth is inventory. 44.7% of the websites answering from Northern Virginia are parked or for sale, up from 16.5%. Arguments that data-center growth there serves the public web should say which web.
- GeoIP maps of hosting are wrong where it matters most. Nine percent of all websites sit on platform addresses that geoIP pins to one city but that answer from many; one in four of the geoIP-only "Ashburn" addresses we sampled is not in Ashburn. Hosting-geography statistics without a speed-of-light check overstate New York, Washington and Tampa, and misplace whole parking fleets.
What Would Help
1. Policymakers and utility commissions: ask for dependency data, not slogans. The "70% of the world's Internet" figure is still on a county website and in a 2024 legislative-study consultant deck. A measured number exists: 3.5% of websites, 20% of US-located websites, and a rising share of AWS's. Ratepayer and siting decisions should cite measured shares and be explicit that website hosting is a small part of what the new load is for.
2. Cloud providers: publish region shares of customer workloads. AWS, Google and Microsoft publish address ranges by region, and those ranges made this study possible. Publishing the share of customer endpoints or origins per region, even as a coarse annual figure, would let resilience planners measure the concentration this post can only see at the front door. Microsoft could also say which of its "Virginia" regions are in Northern Virginia.
3. CDN and anycast platforms: disclose origin geography in aggregate. For 47% of websites the location that matters is the origin, and only the edge provider knows it. An annual "origins by metro" table from Cloudflare, Squarespace, Wix and Vercel would complete the dependency map, and it would not reveal any individual customer.
4. Measurement researchers: verify geoIP with speed of light before mapping hosting. 132 Globalping measurements of the 100 heaviest unverified addresses moved 9% of all websites from specific cities to the edge and refuted a quarter of sampled "Ashburn" placements. Region tags from the providers themselves are far better than geoIP where they exist. Use the version current at each crawl (the Wayback Machine has them), and use AWS's network_border_group, not region, so Local Zones are not counted as us-east-1.
5. Site owners: know your single points of location. If every address in your website record is in one region, your site shares a fate with that region's grid and control plane. A second region, or an edge provider with a documented origin failover, removes a dependency that 10 million websites still have on Northern Virginia alone.
Methodology: 29 full A-record crawls of the DomainsProject corpus (April 7, 2023 – September 18, 2026), reduced to one website record per ICANN-registrable domain — bare-apex A record, else www — using the same merged tables, exclusions and parked/live classifier as How Many Computers Host the Web?, Where the Web Moves and The Parking Lot. Each address was located by edge list, RTT measurement (132 Globalping measurements of 100 addresses; 14 anycast /24s proved), the AWS/Google/Oracle region file in force at each crawl (Wayback Machine captures) and the current Azure service tags, RFC 8805 geofeeds, then DB-IP City Lite (CC BY 4.0). Registry-wildcard TLDs, private-suffix pseudo-apexes, DNS-filter sinkhole answers and Russian-administered TLDs are excluded from every figure. Data: series, metros, grids, Northern Virginia trend, edge trend, who is in Northern Virginia, TLDs, RTT verdicts. For where the web moved between providers see Where the Web Moves; for the country-level map see Where the Web Lives; browse the corpus on the TLD statistics pages or get the data on the dataset page.