From Copenhagen to Ottawa, 2025 and 2026 were the years governments talked about leaving American technology.
- Denmark: the digital ministry and Copenhagen announced moves off Microsoft. The ministry's pilot reached 38 staff.
- Schleswig-Holstein: the German state moved 44,000 mailboxes off Exchange.
- The ICC: the International Criminal Court's prosecutor lost his Microsoft-hosted mailbox under US sanctions, and the court began moving to a German open-source suite.
- The Netherlands: the government blocked a US takeover of the company that hosts its national login service.
- Canada: on September 25, 2026 Canada opened a sovereign-cloud call that admits only companies Canadian-owned up to the ultimate parent.
- The EU: the Commission proposed a Cloud and AI Development Act and scored sovereign-cloud bids on a new "SEAL" scale.
This post measures the other side of the ledger. Last week's Home Advantage Index measured how much of each country's namespace is run at home; the Canada post took one country through ten sovereignty tests. Readers asked for the reverse: how much of the rest of the world runs on American infrastructure, whether anyone is actually leaving, and who should.
The scope: 77 national namespaces outside the US, the 78 countries of the index minus the US itself, plus .eu as a reference.
- The per-domain join: for every one of the 65,545,050 live websites in the September 2026 crawl, we joined three layers, domain by domain:
- where the website is hosted, and which company owns the network;
- who runs its mail (MX);
- who runs its DNS (NS).
- Direction of travel: we followed mail and DNS switching from April 2025 to September 2026.
- Fieldwork, October 5:
- Routing: 3,088 RIPE Atlas traceroutes between countries of six regions.
- Latency: the full RIPE Atlas anchor mesh, 1,104 anchors pinging each other, which gives the round trip from each country to 52 hosting hubs.
- CDNs: 756 Globalping requests to see where Cloudflare, CloudFront and Fastly answer each country from.
- TLS: 31,200 handshakes to read who issued each website's certificate.
- Registries: a lookup of who operates every ccTLD's own nameservers.
- Institutions: live mail and DNS checks of 25,651 institutions in 13 sectors and 211 countries and territories, from ministries and central banks to hospitals and newsrooms.
The headline: of the 51.5 million live websites in the 77 national namespaces whose three layers we could attribute, 43.9% have at least one layer — web, mail or DNS — run by a US-headquartered company, or are hosted on US soil.
- Spread: from 89.5% in the Dominican Republic and 89.3% in Mexico to 25.6% in Germany and 11.9% in Iran. In 40 of the 77 countries it is a majority.
- Direction: the sovereignty debate did not reverse the flow. From April 2025 to September 2026, for every domain that moved its mail off a US-headquartered operator, 2.8 moved onto one; for DNS, 2.4. No national namespace moved its mail away from US operators on balance.
- Europe: EU members moved toward US operators 3.1 times as often as away, among the most lopsided regions. The only places where customers left US mail providers on balance were in South Asia and Africa, and they went to Zoho (India) and Hostinger (Lithuania).
- Two dependencies: physical US hosting is small and falling (7.3% of live websites, median 7.8% → 6.5% since 2023). What grows is US companies serving the world from local edges, regions and tenants.
- Two fixes: they need different remedies.
- Leaving US soil is a cheap, no-regret move for the 3 million US-hosted websites whose audiences are 100–250 ms away, in South Asia, Africa, South America and Southeast Asia.
- Leaving US companies matters most for the institutions that hold state, financial and personal data. Nearly four in five central banks carry a Microsoft 365 footprint, and 97.9% of TLS certificates come from US-headquartered authorities.
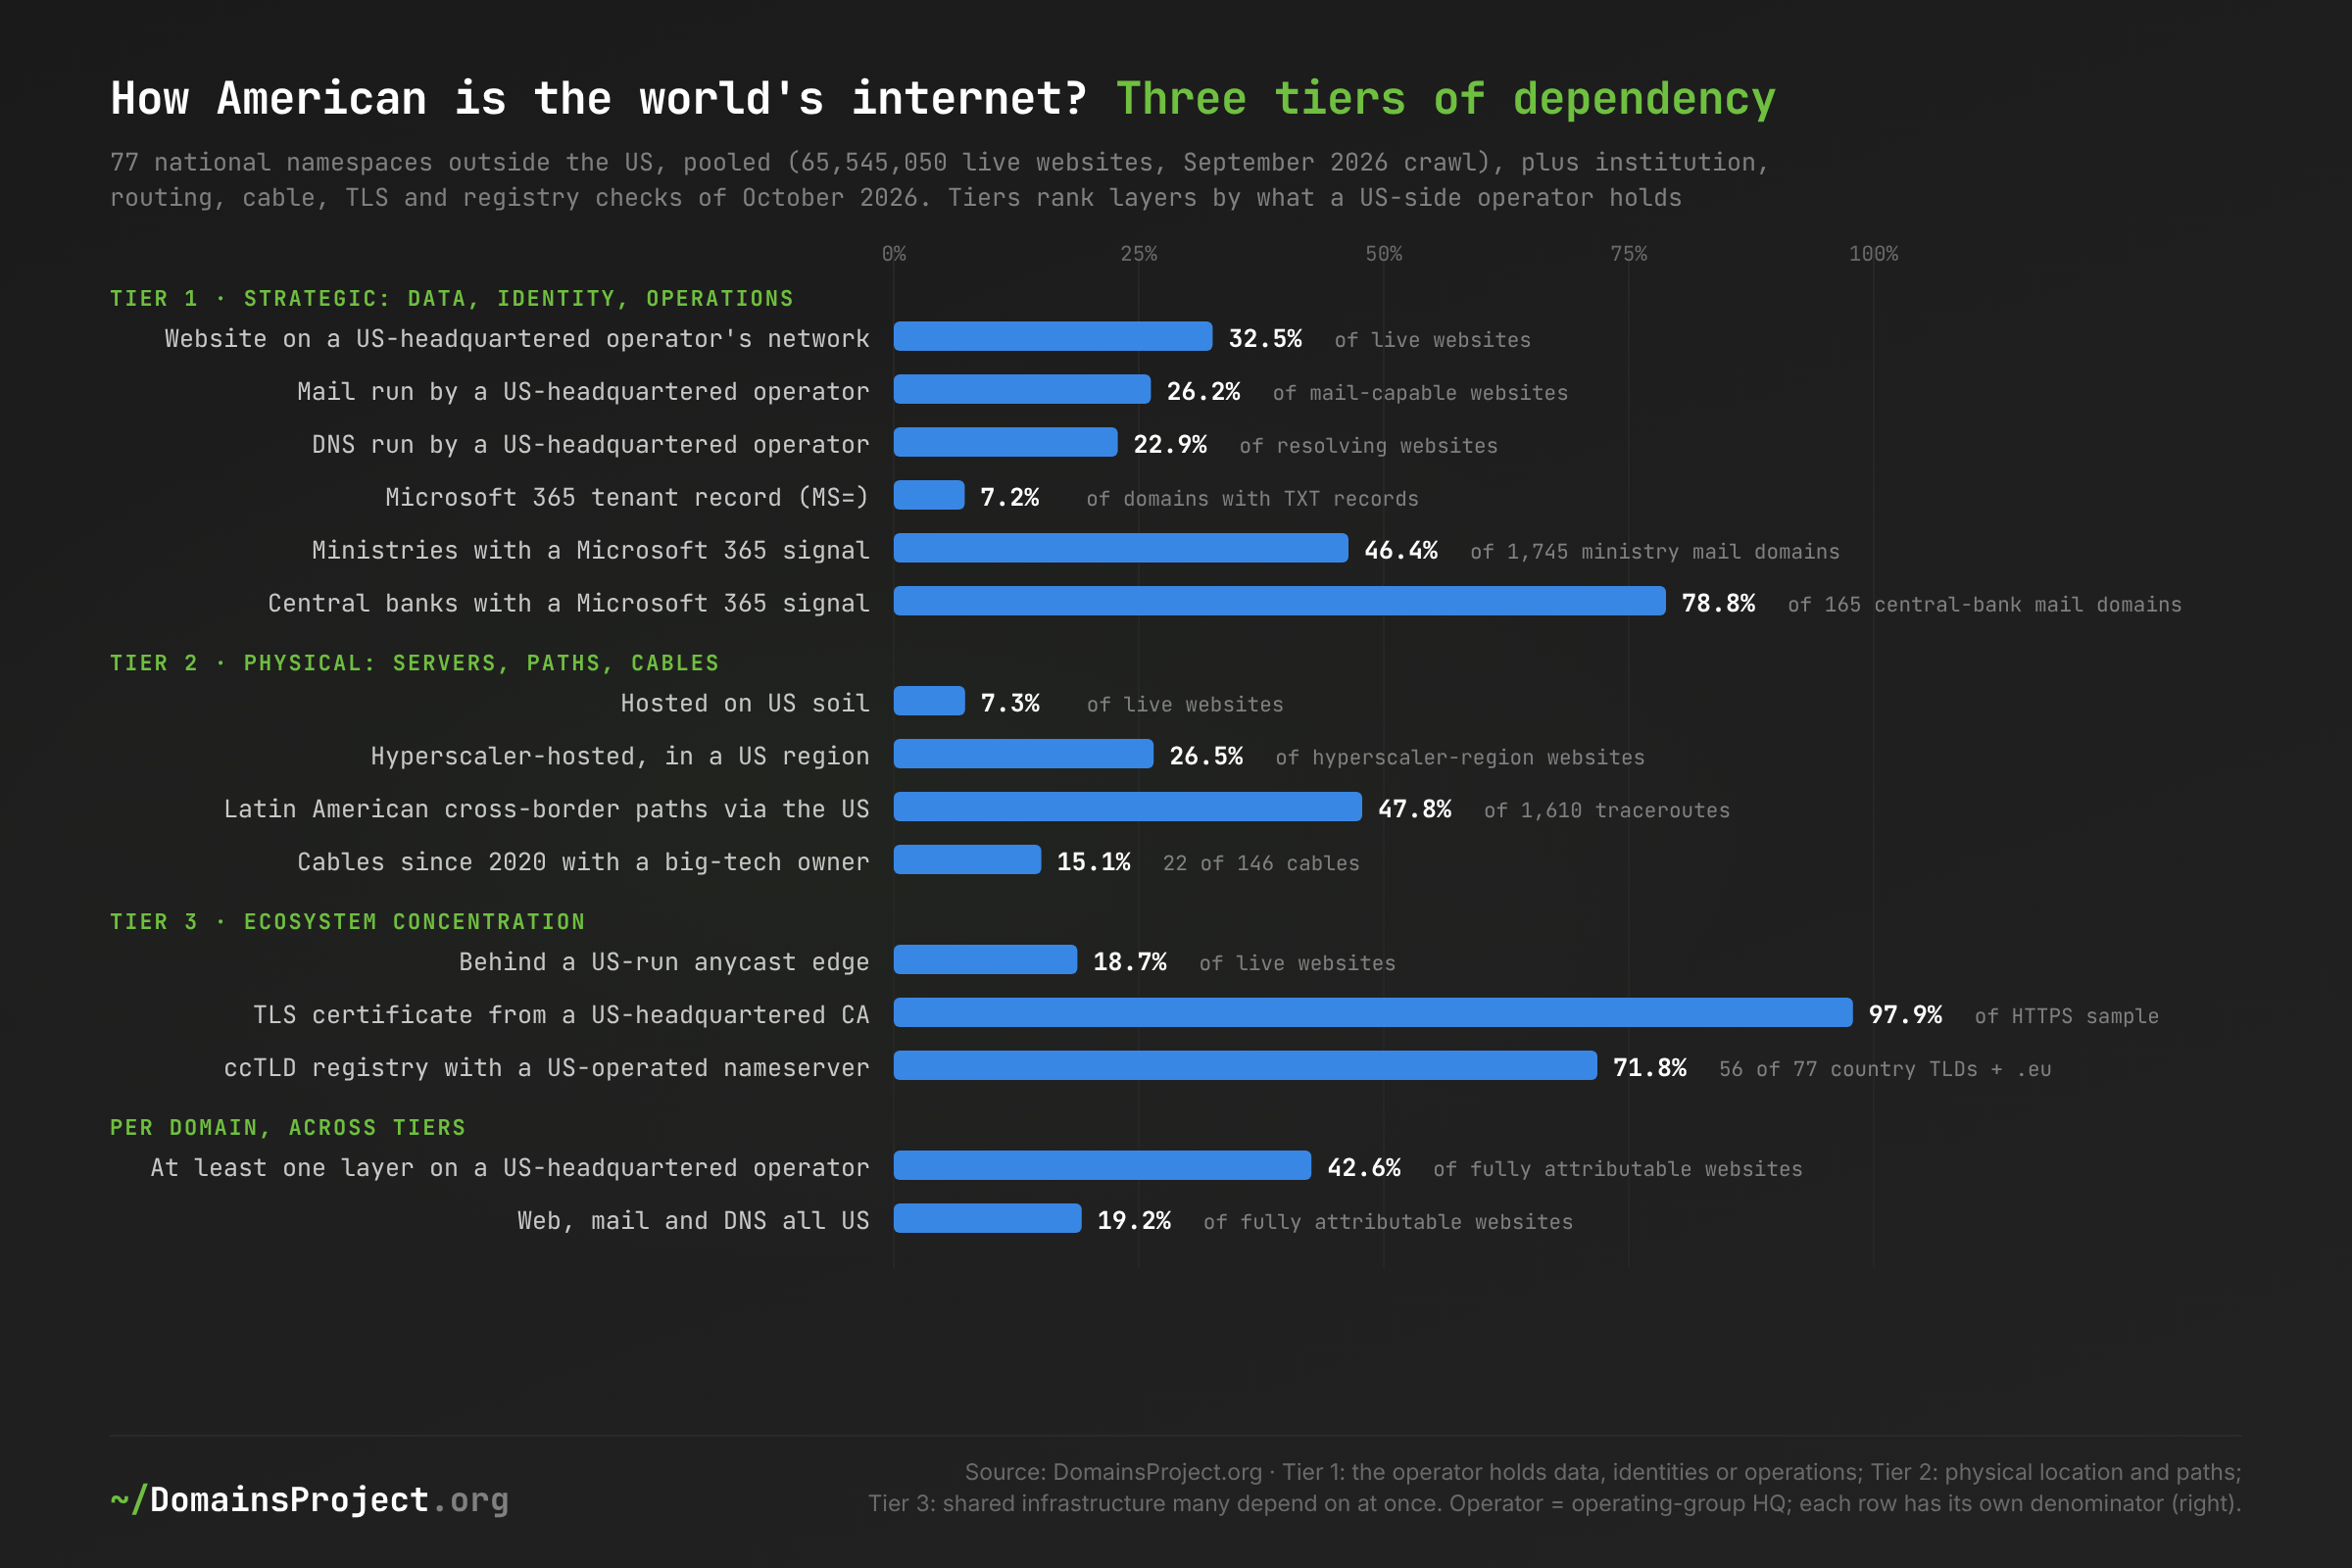
Download: usdep-layers.csv — each row has its own denominator; September 2026 crawl for the website layers, October 5 2026 fieldwork for the deeper layers
What this post does and does not measure.
- What it measures: the public, observable layers of national namespaces.
- where websites answer from and which company's network that is;
- who runs mail and DNS;
- who issues certificates;
- which networks carry traffic between countries.
- What it does not see: contracts, encryption keys, backups, the application behind a front door, or where mailbox contents are finally stored.
- How ownership is attributed: to the headquarters of the operating group, as an approximation of exposure to that country's legal process. It is not a legal opinion.
- "US-exposed" is a description, not a verdict. For most websites, US exposure is a reasonable trade for price, performance and security. The final sections separate the cases where it is not.
The Data
| Value | |
|---|---|
| National namespaces measured | 77 countries outside the US (the Home Advantage Index panel), plus .eu and a 1-in-10 sample of .com/.net/.org as references |
| Live websites, September 17, 2026 crawl (parked excluded) | 65,545,050 in the 77 national namespaces; 2,120,667 in .eu; 11,232,708 in the gTLD sample |
| Websites with all three layers attributable (per-domain tests) | 51,527,515 (78.6%) |
| Hosting location and ownership | address → location (edge lists, RTT checks, cloud region tags, geofeeds, DB-IP) and → origin AS (RouteViews, Sep 17) → operating group (CAIDA as2org + hand review of the 400 largest networks) |
| Mail and DNS | September 2026 MX and NS crawls, joined per domain; operator attribution of the Home Advantage Index |
| Switching flows | April 10, 2025 → September 2026: 38.3 million domains with attributable mail in both crawls, 47.6 million with attributable DNS |
| Trend | 29 hosting crawls (April 2023 → September 2026), 12 mail and 10 DNS crawls (April 2025 → September 2026) |
| Fieldwork, October 5, 2026 | 3,088 RIPE Atlas traceroutes; 1,104-anchor RIPE Atlas ping mesh; 756 Globalping CDN requests; 31,200 TLS handshakes; nameservers of 242 ccTLDs; live DNS for 25,651 institutions |
| External facts | law, policy, market shares, outages and provider ownership from primary sources (statutes, court rulings, regulators, company filings), cross-checked with Gemini |
What counts. A website is the live site of a registrable domain under a national ccTLD. Parked domains, registry wildcards and private-suffix pseudo-domains are excluded, as in the index. A national ccTLD is a proxy for a country's web: in many countries a large share of businesses use .com, which is why the gTLD sample is shown alongside. At 74.2% US-exposed, the gTLD sample is more American than 60 of the 77 national namespaces.
Methodology
Unit and denominators.
- Unit: the live website of a registrable domain (apex) under a national ccTLD, from the September 17, 2026 crawl. Parked domains are excluded.
- Coverage: every row of the 77 national namespaces and
.eu, plus a 1-in-10 systematic sample of the apex-sorted.com,.netand.orgtables as a reference for the generic web. - Denominators:
- Web layer: all live websites.
- Mail layer: websites with mail (null MX, no MX and parking MX excluded).
- DNS layer: websites with a nameserver answer.
- Per-domain tests: websites whose web, mail and DNS operators are all attributable.
- At least one layer US: the hosting network, mail or DNS is run by a US-headquartered company.
- All three US: all three are (for websites without mail, web and DNS); US soil is not required.
- US-exposed: at least one layer US, or the server is on US soil.
- US-free: neither.
US soil and US company are measured separately.
- US soil: the website's majority address is located in the United States. The evidence order is the one used in the Web on the Grid and Home Advantage Index posts:
- anycast-edge lists;
- RTT overrides from Globalping/RIPE Atlas checks;
- cloud region tags (AWS by network border group, GCP, Azure, Oracle);
- provider geofeeds;
- DB-IP City Lite.
- US company: the operating group behind the layer is headquartered in the US.
- Web: the origin AS of the address (RouteViews, September 17), mapped to CAIDA's AS-to-organisation table. We hand-reviewed the 400 largest hosting networks, which with the anycast edges cover 89.9% of live websites, so that each counts at its operating group's headquarters.
- Examples of the group rule: Hostinger → Lithuania; Google Ireland → US; the Host Europe and Heart Internet brands → US (GoDaddy); TransIP, Loopia, Register.it and Natro → Belgium (team.blue); Contabo's US and Asian networks → Germany.
- Group-rule corrections:
- World Host Group, which owns hosting.com and A2 Hosting, has its parent in Luxembourg and is run from London. It counts as British, not American.
- US-incorporated hosts that mostly serve Hong Kong (PEG Tech, CNServers, GNET) count as American.
- Mail and DNS: the Home Advantage Index attribution: census labels → operating-group HQ → hand review → ccTLD heuristic → concentration rule. This post adds one correction: domainFactory's mail and DNS platforms (
ispgateway.de,namespace4you.de), Host Europe's and Heart Internet's own domains count as GoDaddy, i.e. US. - Self-run mail and DNS take the owner and location of the domain's own website, as in the index.
- The four combinations: US company on US soil; non-US company on US soil; US company elsewhere (including anycast edges); non-US company elsewhere.
Switching flows.
- Method: a merge-join of the April 10, 2025 and September 2026 mail (MX) and DNS (NS) crawls, domain by domain. Operator HQ is held at its September 2026 state, so only customer moves count.
- Directions: a move "to the US" goes from a domestic, other-foreign, self-run or unattributed operator to a US-headquartered one; a move "away" is the reverse.
- Robustness: we also report operator-to-operator moves only, which excludes self-run and unattributed.
Fieldwork, October 5, 2026.
- Latency: the RIPE Atlas anchoring mesh, i.e. pings between all 1,104 anchors with an ongoing IPv4 mesh measurement. It is public and costs no credits.
- Matrix: the median over a country's anchors of each anchor's best RTT to the nearest anchor in each of 52 hosting hubs.
- Filter: measurements faster than light in fibre (RTT < 80% of great-circle km/100) were dropped, and with them one anchor that violated the bound repeatedly.
- Routing: 3,088 one-off ICMP Paris traceroutes from 245 RIPE Atlas probes in 70 countries to 60 anchors in six regions. Hops were placed by PeeringDB exchange LANs and router names, with the same speed-of-light check.
- Edge: 756 Globalping HTTPS requests from eyeball probes in 66 countries to sites on Cloudflare, CloudFront and Fastly, with the PoP read from the response header.
- TLS: handshakes with 400 random live websites per national namespace (31,200 sampled, 27,406 completed), issuer mapped to the operating CA.
- Registry: live
digof every ccTLD's nameservers, with each address mapped to its announcing network. - Institutions: Wikidata official websites for 13 sectors, then live MX/NS/TXT/A lookups. Where a class mixes levels, only bodies whose jurisdiction (P1001) is a country are kept.
What the attribution cannot see.
- MX shows the first hop of mail. A domain behind a filtering gateway is attributed to the gateway, which is why the institutions section adds SPF and
MS=tenant records. - Origin-AS ownership names the network, not the customer. A Mexican host renting racks in a Dallas colocation facility counts as the facility's operator. That is why we report US soil separately, and why "non-US company on US soil" undercounts such tenants.
- Operating-group HQ approximates exposure to that country's legal process. It is not a legal opinion, and US private-equity ownership of a non-US operator (Contabo, Teraco, ST Telemedia) is not counted as US.
- A national ccTLD is a proxy for a country's web. In many countries, businesses use
.com.
Validation.
- Self-run mail: the index's per-domain imputation was checked on 2,742 live hosts in 14 countries; the mail host was in the website's country for 95.9% of them.
- Hosting HQ table: cross-checked with Gemini, which led to the corrections listed above.
- External facts: compiled in a sourced research file and cross-checked with Gemini.
Reproducibility. Every chart has its CSV; the full per-country table is in usdep-scorecard.csv and the switching flows in usdep-flows-by-country.csv. Russian-territorial TLDs, Russian providers and institutions in Russia and Belarus are excluded from every count.
The Scorecard: Twelve Tests
The Canada post answered ten questions readers asked about one country. The same questions, plus two the world panel makes possible, give twelve tests. "77 pooled" weights countries by their number of websites; the median treats each country equally.
| # | Test | What we measured | 77 countries | Most exposed | Least exposed |
|---|---|---|---|---|---|
| 1 | Web hosting company | Live websites on a US-headquartered company's network | 32.6% pooled, 37.7% median | Dominican Rep. 75.0%, Mexico 69.3%, Sri Lanka 69.2% | Iran 7.2%, Hungary 14.1%, Slovakia 14.6% |
| 2 | US soil | Live websites whose server is in the US | 7.3% pooled, 6.5% median, falling since 2023 | Dominican Rep. 47.0%, Mexico 46.3%, Ecuador 44.3% | Iran 0.6%, Slovakia 1.2%, Czechia 1.4% |
| 3 | Cloud regions | Hyperscaler-hosted websites served from a US region | 26.5% in US regions, 29.6% in-country | Argentina 82.8%, Mexico 82.4%, Uruguay 81.4% | Ukraine 8.1%, Korea 9.5%, Czechia 9.8% |
| 4 | Edge / CDN | Live websites behind a US-run anycast edge; where US CDNs answer from | 18.7%; Cloudflare answers from inside the requester's country for 82% of requests | Nepal 49.5%, Azerbaijan 38.7%, Indonesia 37.4% | Iran 6.5%, Germany 9.0%, Hungary 9.0% |
| 5 | DNS | DNS run by a US-headquartered operator | 22.9% pooled, 25.0% median; switching 2.4× toward US | Nepal 61.3%, Canada 56.4%, Azerbaijan 51.5% | Switzerland 8.2%, Czechia 8.3%, Slovakia 8.4% |
| 6 | Mail run by a US-headquartered operator | 26.3% pooled, 30.9% median; switching 2.8× toward US | Dominican Rep. 68.1%, Mexico 62.9%, Australia 61.3% | Iran 2.8%, China 7.6%, Slovakia 10.2% | |
| 7 | Productivity tenancy | Domains with a Microsoft 365 tenant record (MS=) |
7.2% of domains with TXT records | New Zealand 21.0%, Iceland 19.5%, Ireland 18.0% | Iran 0.1%, Nigeria 1.5%, Pakistan 1.9% |
| 8 | TLS certificates | Certificates issued by a US-headquartered CA | 97.9% | 99%+ in most countries | Italy 66.5%, Poland 81.2%, Japan 84.9% |
| 9 | Registry and root | ccTLDs with a nameserver on a US operator's network; root letters run by US organisations | 56 of 78 (77 + .eu); 10 of 13 root letters |
.au 4 of 5 nameservers |
22 with none |
| 10 | Routing and cables | Traceroutes between countries of a region that pass through the US | 47.8% in Latin America; ≈1% elsewhere | Haiti 91%, Jamaica 77%, Dominican Rep. 76%, Mexico 75% | Paraguay 18% (Latin America); Africa, Asia, Oceania ≈0% |
| 11 | Government and critical institutions | Mail domains with a Microsoft 365 signal / mail through a US operator | Central banks 78.8% / 43.6%; ministries 46.4% / 27.6% | Banks 73.4%, stock exchanges 62.6% | Hospitals 38.3%, news media 38.0% |
| 12 | Direction of travel | Domains switching to vs away from US operators, Apr 2025 → Sep 2026 | Mail 2.8×, DNS 2.4× toward the US | East & Southeast Asia (mail 3.7×), Oceania (3.3×), EU members (3.1×) | South Asia (1.3×); five countries net away on operator-to-operator mail |
The tests split into two groups.
- Physical layers (US soil, routing, and where CDNs answer from) show the US shrinking. The share of live websites on US soil fell in 65 of the 77 countries since April 2023, mostly as websites moved behind anycast edges, and it is large only in the Americas and parts of Africa and South Asia.
- Corporate layers (hosting company, edge operator, mail, DNS, productivity tenant, certificate authority) show the US large and growing almost everywhere.
The sovereignty debate is mostly about the second group. The fixes that move numbers fastest are in the first.
Seventy-Seven Countries: From the Dominican Republic to Iran
A website is "US-exposed" when at least one of its three layers is run by a US-headquartered company, or its server sits on US soil.
- Fully attributable websites: across them, the share runs from 89.5% in the Dominican Republic to 11.9% in Iran.
- Pooled: 43.9% for the 77 national namespaces.
- Median: 52.9%, because many smaller namespaces are more exposed than the large European ones that dominate the pooled count.
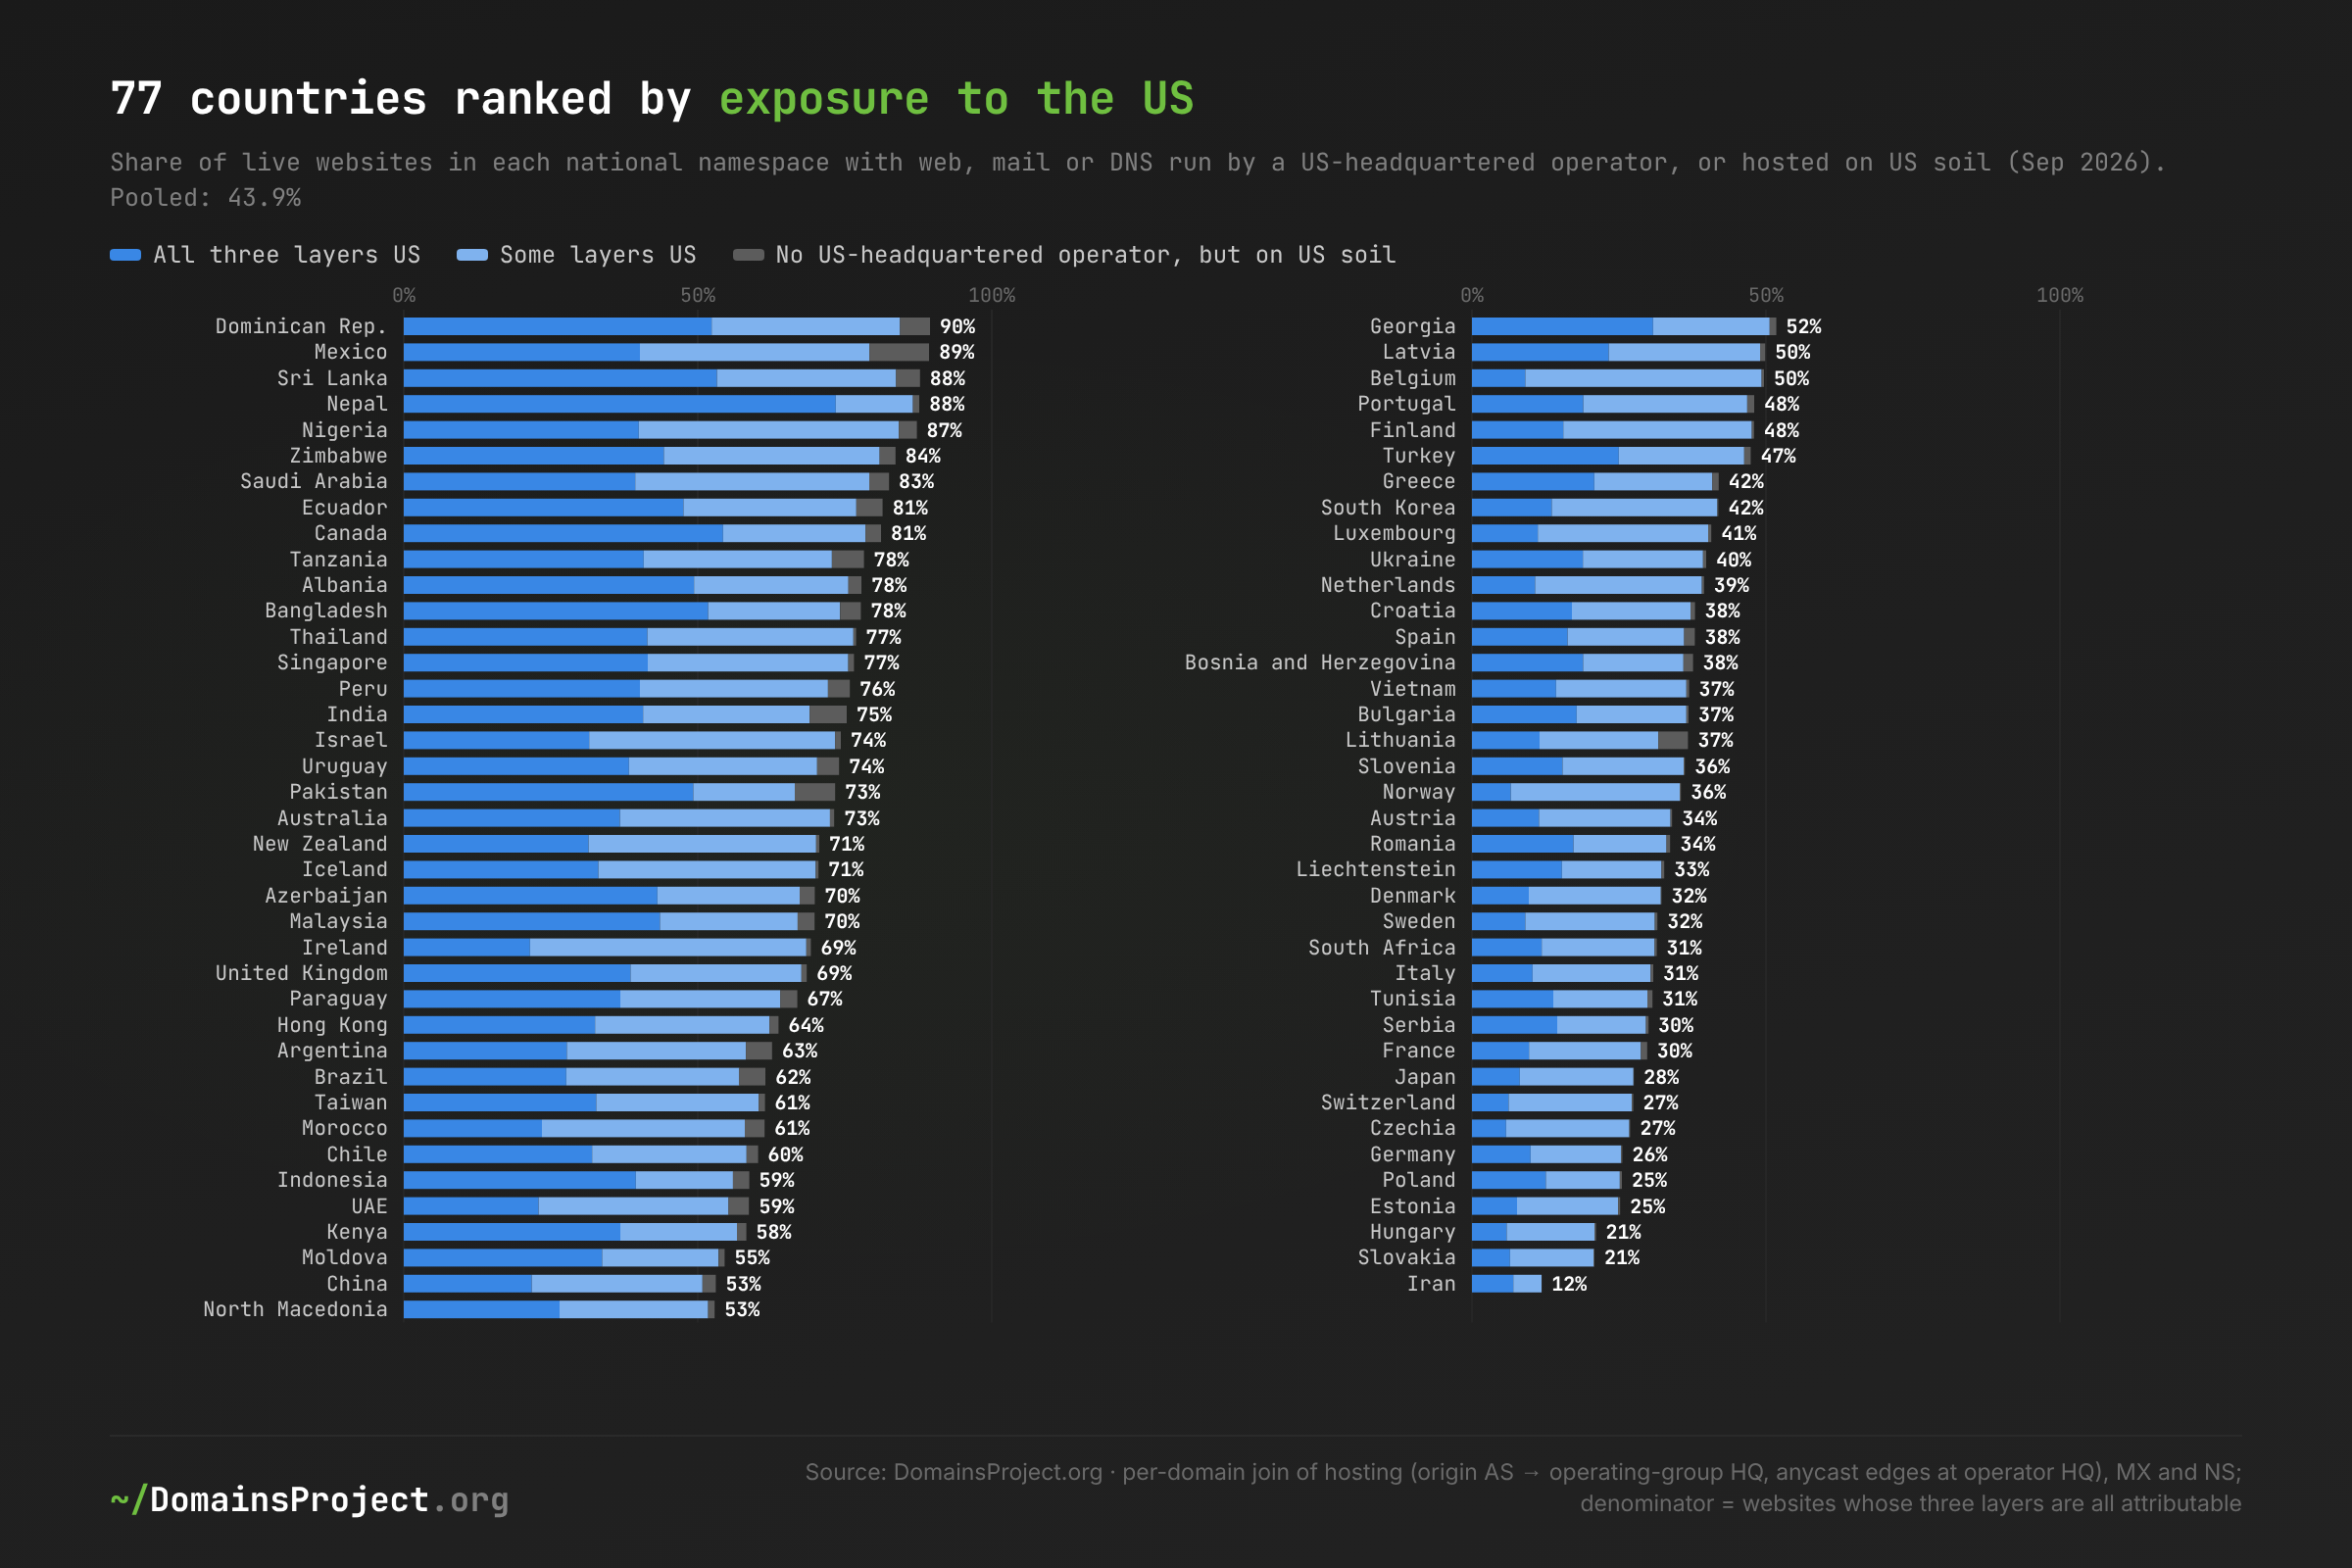
Download: usdep-scorecard.csv — September 2026 crawl; per-domain join of hosting, MX and NS; denominator = websites whose three layers are all attributable
| Country | Live websites | US-exposed | All three US | On US soil | US share: web · mail · DNS |
|---|---|---|---|---|---|
| 1. Dominican Republic | 22,404 | 89.5% | 53.0% | 47.0% | 75.0 · 68.1 · 46.5% |
| 2. Mexico | 614,443 | 89.3% | 40.5% | 46.3% | 69.3 · 62.9 · 39.8% |
| 3. Sri Lanka | 51,909 | 87.8% | 53.5% | 31.5% | 69.2 · 54.9 · 48.8% |
| 4. Nepal | 84,097 | 87.7% | 73.5% | 11.3% | 63.1 · 36.8 · 61.3% |
| 5. Nigeria | 121,207 | 87.3% | 40.1% | 36.9% | 63.9 · 51.4 · 30.3% |
| 6. Zimbabwe | 35,143 | 83.6% | 44.3% | 33.1% | 63.8 · 54.8 · 35.1% |
| 7. Saudi Arabia | 58,600 | 82.5% | 39.6% | 23.2% | 61.4 · 59.7 · 39.7% |
| 8. Ecuador | 34,494 | 81.5% | 48.2% | 44.3% | 60.3 · 57.3 · 32.8% |
| 9. Canada | 1,860,851 | 81.2% | 54.6% | 27.5% | 66.3 · 60.7 · 56.4% |
| 10. Tanzania | 29,605 | 78.2% | 41.1% | 41.6% | 54.9 · 50.8 · 25.2% |
| 11. Albania | 24,430 | 77.9% | 49.7% | 15.4% | 55.0 · 45.0 · 46.9% |
| 12. Bangladesh | 37,231 | 77.7% | 51.9% | 16.8% | 46.9 · 36.0 · 38.6% |
| 13. Thailand | 58,972 | 77.0% | 41.6% | 2.8% | 41.6 · 46.3 · 37.0% |
| 14. Singapore | 114,889 | 76.6% | 41.7% | 10.9% | 53.9 · 54.2 · 34.3% |
| 15. Peru | 98,820 | 75.9% | 40.6% | 43.5% | 58.6 · 55.7 · 31.6% |
| 16. India | 1,840,026 | 75.3% | 40.8% | 19.1% | 57.8 · 46.2 · 44.6% |
| 17. Israel | 203,429 | 74.4% | 31.6% | 7.0% | 56.9 · 51.9 · 36.0% |
| 18. Uruguay | 55,815 | 74.0% | 38.5% | 43.0% | 62.0 · 56.3 · 31.7% |
| 19. Pakistan | 133,443 | 73.4% | 49.4% | 24.3% | 57.1 · 38.4 · 42.3% |
| 20. Australia | 2,064,797 | 73.2% | 36.8% | 9.5% | 55.2 · 61.3 · 40.5% |
| 21. New Zealand | 477,447 | 70.7% | 31.5% | 9.3% | 53.4 · 61.0 · 35.5% |
| 22. Iceland | 60,581 | 70.5% | 33.1% | 11.5% | 55.2 · 58.0 · 39.0% |
| 23. Azerbaijan | 32,021 | 69.9% | 43.2% | 11.5% | 51.0 · 30.9 · 51.5% |
| 24. Malaysia | 308,431 | 69.9% | 43.6% | 10.4% | 45.6 · 36.5 · 37.2% |
| 25. Ireland | 223,926 | 69.3% | 21.5% | 10.8% | 49.8 · 44.6 · 22.6% |
| 26. United Kingdom | 5,234,993 | 68.5% | 38.6% | 10.2% | 54.0 · 45.0 · 43.7% |
| 27. Paraguay | 25,735 | 66.9% | 37.2% | 39.2% | 57.5 · 53.2 · 35.9% |
| 28. Hong Kong | 115,698 | 63.7% | 32.7% | 11.6% | 40.1 · 39.4 · 30.4% |
| 29. Argentina | 454,754 | 62.7% | 27.8% | 23.4% | 43.5 · 38.4 · 36.0% |
| 30. Brazil | 3,298,954 | 61.5% | 27.7% | 14.5% | 50.7 · 38.4 · 36.2% |
| 31. Taiwan | 251,543 | 61.4% | 32.8% | 9.6% | 45.8 · 40.6 · 34.3% |
| 32. Morocco | 78,111 | 61.4% | 23.5% | 13.6% | 47.6 · 39.7 · 23.0% |
| 33. Chile | 468,526 | 60.3% | 32.2% | 22.7% | 48.4 · 46.6 · 32.9% |
| 34. Indonesia | 423,211 | 58.8% | 39.5% | 6.1% | 46.2 · 33.6 · 41.3% |
| 35. United Arab Emirates | 172,258 | 58.7% | 23.1% | 16.5% | 44.9 · 37.8 · 24.8% |
| 36. Kenya | 93,476 | 58.3% | 37.1% | 15.1% | 37.2 · 27.4 · 23.9% |
| 37. Moldova | 32,271 | 54.6% | 33.8% | 6.3% | 37.9 · 23.8 · 36.8% |
| 38. China | 4,774,701 | 53.1% | 21.8% | 13.5% | 39.0 · 7.6 · 31.9% |
| 39. North Macedonia | 28,547 | 52.9% | 26.6% | 7.2% | 34.7 · 27.4 · 25.7% |
| 40. Georgia | 45,720 | 51.8% | 30.9% | 6.5% | 37.7 · 32.7 · 36.7% |
| 41. Latvia | 102,370 | 49.9% | 23.3% | 5.1% | 37.9 · 29.6 · 27.6% |
| 42. Belgium | 1,128,180 | 49.7% | 9.1% | 2.9% | 23.8 · 39.5 · 11.9% |
| 43. Portugal | 313,719 | 48.0% | 19.0% | 5.1% | 31.4 · 25.3 · 19.9% |
| 44. Finland | 417,666 | 48.0% | 15.6% | 3.3% | 30.1 · 31.8 · 18.6% |
| 45. Turkey | 549,902 | 47.4% | 25.0% | 2.6% | 31.0 · 19.2 · 27.6% |
| 46. Greece | 415,138 | 42.0% | 20.9% | 5.0% | 30.6 · 24.8 · 25.0% |
| 47. South Korea | 565,947 | 41.9% | 13.6% | 1.8% | 34.3 · 17.4 · 15.6% |
| 48. Luxembourg | 75,828 | 40.7% | 11.2% | 6.4% | 26.0 · 30.2 · 14.0% |
| 49. Ukraine | 346,382 | 39.8% | 18.9% | 1.4% | 28.9 · 16.1 · 21.6% |
| 50. Netherlands | 3,864,419 | 39.5% | 10.8% | 2.5% | 23.4 · 24.4 · 13.1% |
| 51. Croatia | 109,633 | 37.9% | 17.0% | 3.9% | 21.9 · 24.7 · 19.6% |
| 52. Spain | 1,311,418 | 37.9% | 16.3% | 4.6% | 28.0 · 17.1 · 18.5% |
| 53. Bosnia and Herzegovina | 27,975 | 37.6% | 18.9% | 6.2% | 25.8 · 23.4 · 23.7% |
| 54. Vietnam | 335,010 | 36.9% | 14.3% | 1.9% | 22.3 · 32.3 · 19.1% |
| 55. Bulgaria | 72,090 | 36.8% | 17.8% | 2.8% | 27.1 · 20.4 · 21.1% |
| 56. Lithuania | 173,477 | 36.7% | 11.5% | 7.2% | 23.1 · 18.0 · 16.6% |
| 57. Slovenia | 128,038 | 36.2% | 15.5% | 3.5% | 23.3 · 23.9 · 16.6% |
| 58. Norway | 606,018 | 35.5% | 6.6% | 3.0% | 24.3 · 30.1 · 8.9% |
| 59. Austria | 1,015,699 | 34.0% | 11.4% | 1.9% | 22.2 · 21.0 · 12.9% |
| 60. Romania | 489,875 | 33.7% | 17.3% | 3.1% | 23.9 · 19.9 · 21.8% |
| 61. Liechtenstein | 48,339 | 32.7% | 15.3% | 6.9% | 25.5 · 18.8 · 17.5% |
| 62. Denmark | 835,927 | 32.3% | 9.7% | 2.2% | 21.0 · 22.9 · 13.0% |
| 63. Sweden | 1,178,161 | 31.5% | 9.1% | 2.8% | 21.2 · 25.8 · 11.4% |
| 64. South Africa | 1,006,161 | 31.4% | 11.9% | 4.3% | 21.6 · 21.2 · 14.4% |
| 65. Italy | 2,495,243 | 30.8% | 10.3% | 5.8% | 26.7 · 16.9 · 12.9% |
| 66. Tunisia | 37,998 | 30.7% | 13.9% | 3.3% | 31.5 · 11.9 · 14.9% |
| 67. Serbia | 127,007 | 30.0% | 14.6% | 3.8% | 21.8 · 19.4 · 16.2% |
| 68. France | 3,570,902 | 29.8% | 9.7% | 2.7% | 20.8 · 12.7 · 12.2% |
| 69. Japan | 1,352,617 | 27.6% | 8.2% | 2.4% | 20.3 · 15.6 · 11.8% |
| 70. Switzerland | 1,946,523 | 27.4% | 6.2% | 2.3% | 18.7 · 16.9 · 8.2% |
| 71. Czechia | 1,138,381 | 26.9% | 5.8% | 1.4% | 19.7 · 13.0 · 8.3% |
| 72. Germany | 11,691,835 | 25.6% | 10.0% | 1.6% | 19.6 · 13.8 · 11.9% |
| 73. Poland | 1,957,670 | 25.5% | 12.6% | 1.6% | 18.1 · 12.2 · 16.2% |
| 74. Estonia | 163,610 | 25.2% | 7.7% | 2.5% | 17.0 · 16.6 · 10.2% |
| 75. Hungary | 711,803 | 21.1% | 5.9% | 1.4% | 14.1 · 12.9 · 8.6% |
| 76. Slovakia | 402,031 | 20.8% | 6.5% | 1.2% | 14.6 · 10.2 · 8.4% |
| 77. Iran | 686,549 | 11.9% | 7.0% | 0.6% | 7.2 · 2.8 · 9.6% |
| All 77 pooled | 65,545,050 | 43.9% | 19.2% | 7.3% | 32.6 · 26.3 · 22.9% |
| Median of 77 | 52.9% | 23.3% | 6.5% | 37.7 · 30.9 · 25.0% | |
.eu (reference) |
2,120,667 | 31.1% | 13.8% | 3.0% | 23.1 · 17.8 · 16.4% |
.com/.net/.org sample (reference) |
11,232,708 | 74.2% | 53.1% | 25.4% | 63.8 · 54.8 · 53.2% |
Four groups stand out:
- US end to end: in five countries a majority of websites run all three layers on US companies — Nepal 73.5%, Canada 54.6%, Sri Lanka 53.5%, the Dominican Republic 53.0% and Bangladesh 51.9%. Here the US is not a supplier but the default stack.
- Western Hemisphere neighbours: Mexico, the Dominican Republic, Ecuador, Peru, Uruguay and Paraguay keep 39–47% of their websites physically in the US. They are joined by Tanzania (41.6%), Nigeria (36.9%) and Sri Lanka (31.5%).
- Anglosphere tenants: Australia, New Zealand, Ireland, the UK and Iceland host mostly at home or behind local edges (US soil 9–12%) but run 45–61% of their mail on US companies, mostly Microsoft 365 and Google Workspace.
- The least exposed: Central Europe, the German-speaking countries, Japan and France keep two-thirds to four-fifths of their websites free of any US layer. They are the namespaces with large domestic hosting industries — Hetzner, IONOS, Strato, OVHcloud, Aruba, GMO, Sakura, Xserver.
Iran is the outlier for reasons of its own: under US sanctions and domestic filtering, 78.7% of .ir websites run all three layers at home.
US Soil and US Companies Are Different Dependencies
Most US dependence is not physical. Of the 77 namespaces' live websites, only 7.3% sit on US soil, and most of those (5.7 points) on US companies' networks. The larger share, 26.9%, is US companies serving the world from elsewhere: anycast edges (18.7%) and data centres outside the US (8.2%).
| Country | US co., US soil | Non-US co., US soil | US-run edge | US co. abroad | Non-US edge | Non-US co. abroad |
|---|---|---|---|---|---|---|
| Mexico | 35.1% | 11.2% | 26.8% | 7.4% | 4.4% | 15.1% |
| Dominican Republic | 37.9% | 9.0% | 33.7% | 3.4% | 2.8% | 13.2% |
| Ecuador | 36.4% | 7.8% | 20.3% | 3.5% | 2.2% | 29.7% |
| Peru | 35.0% | 8.4% | 20.3% | 3.3% | 1.8% | 31.1% |
| Tanzania | 33.6% | 8.0% | 14.9% | 6.4% | 1.0% | 36.1% |
| Nigeria | 32.5% | 4.4% | 25.4% | 6.0% | 0.7% | 31.0% |
| India | 12.7% | 6.3% | 31.0% | 14.0% | 5.9% | 30.1% |
| Brazil | 9.4% | 5.1% | 26.4% | 14.9% | 6.7% | 37.5% |
| Canada | 23.8% | 3.7% | 35.4% | 7.1% | 7.7% | 22.3% |
| Australia | 8.2% | 1.3% | 35.0% | 12.0% | 6.9% | 36.7% |
| United Kingdom | 9.0% | 1.3% | 31.8% | 13.2% | 7.3% | 37.4% |
| Germany | 1.3% | 0.3% | 9.0% | 9.3% | 1.6% | 78.5% |
| Japan | 2.3% | 0.1% | 11.2% | 6.9% | 1.3% | 78.2% |
| 77 pooled | 5.7% | 1.6% | 18.7% | 8.2% | 3.0% | 62.8% |
US company = operating group of the origin network (or of the anycast edge) headquartered in the US. Shares of live websites, September 2026.
A million websites sit on US soil without a US company in the stack.
- Who they are: 1.02 million of the 4.77 million US-hosted websites in the 77 namespaces run on non-US companies' networks in American data centres. Hostinger (Lithuania) alone hosts at least 581,000 of them, including:
- 30% of all US-hosted
.inwebsites; - 29% of all US-hosted
.brwebsites; - a tenth of US-hosted
.mxwebsites.
- 30% of all US-hosted
- Same pattern, other providers: IONOS (Germany) and Contabo (Germany) do the same for Mexico.
- Mexico's largest US host is Mexican: 19.6% of US-hosted
.mxwebsites sit in a TierPoint data centre in Dallas, and the servers we sampled there carry the reverse-DNS names of Neubox, a Mexican hosting company.
For these customers, leaving US soil means choosing a different data centre from the same provider, not changing provider.
The physics are lopsided.
- Far from the US: for India, Sri Lanka, Pakistan, Kenya, Tanzania and the Gulf, the US metros where their US-hosted websites sit are 200–250 ms away. The same anchors reach a domestic anchor in under 1–15 ms and a regional hub (Mumbai, Dubai, Nairobi, Johannesburg) in 20–55 ms.
- Close to the US: for Mexico and the Dominican Republic, the US is close. Their US-hosted websites are 43–50 ms away, Dallas is 28 ms from Mexican anchors, Miami 18 ms from Dominican ones, and the nearest non-US hub abroad is farther than the US.
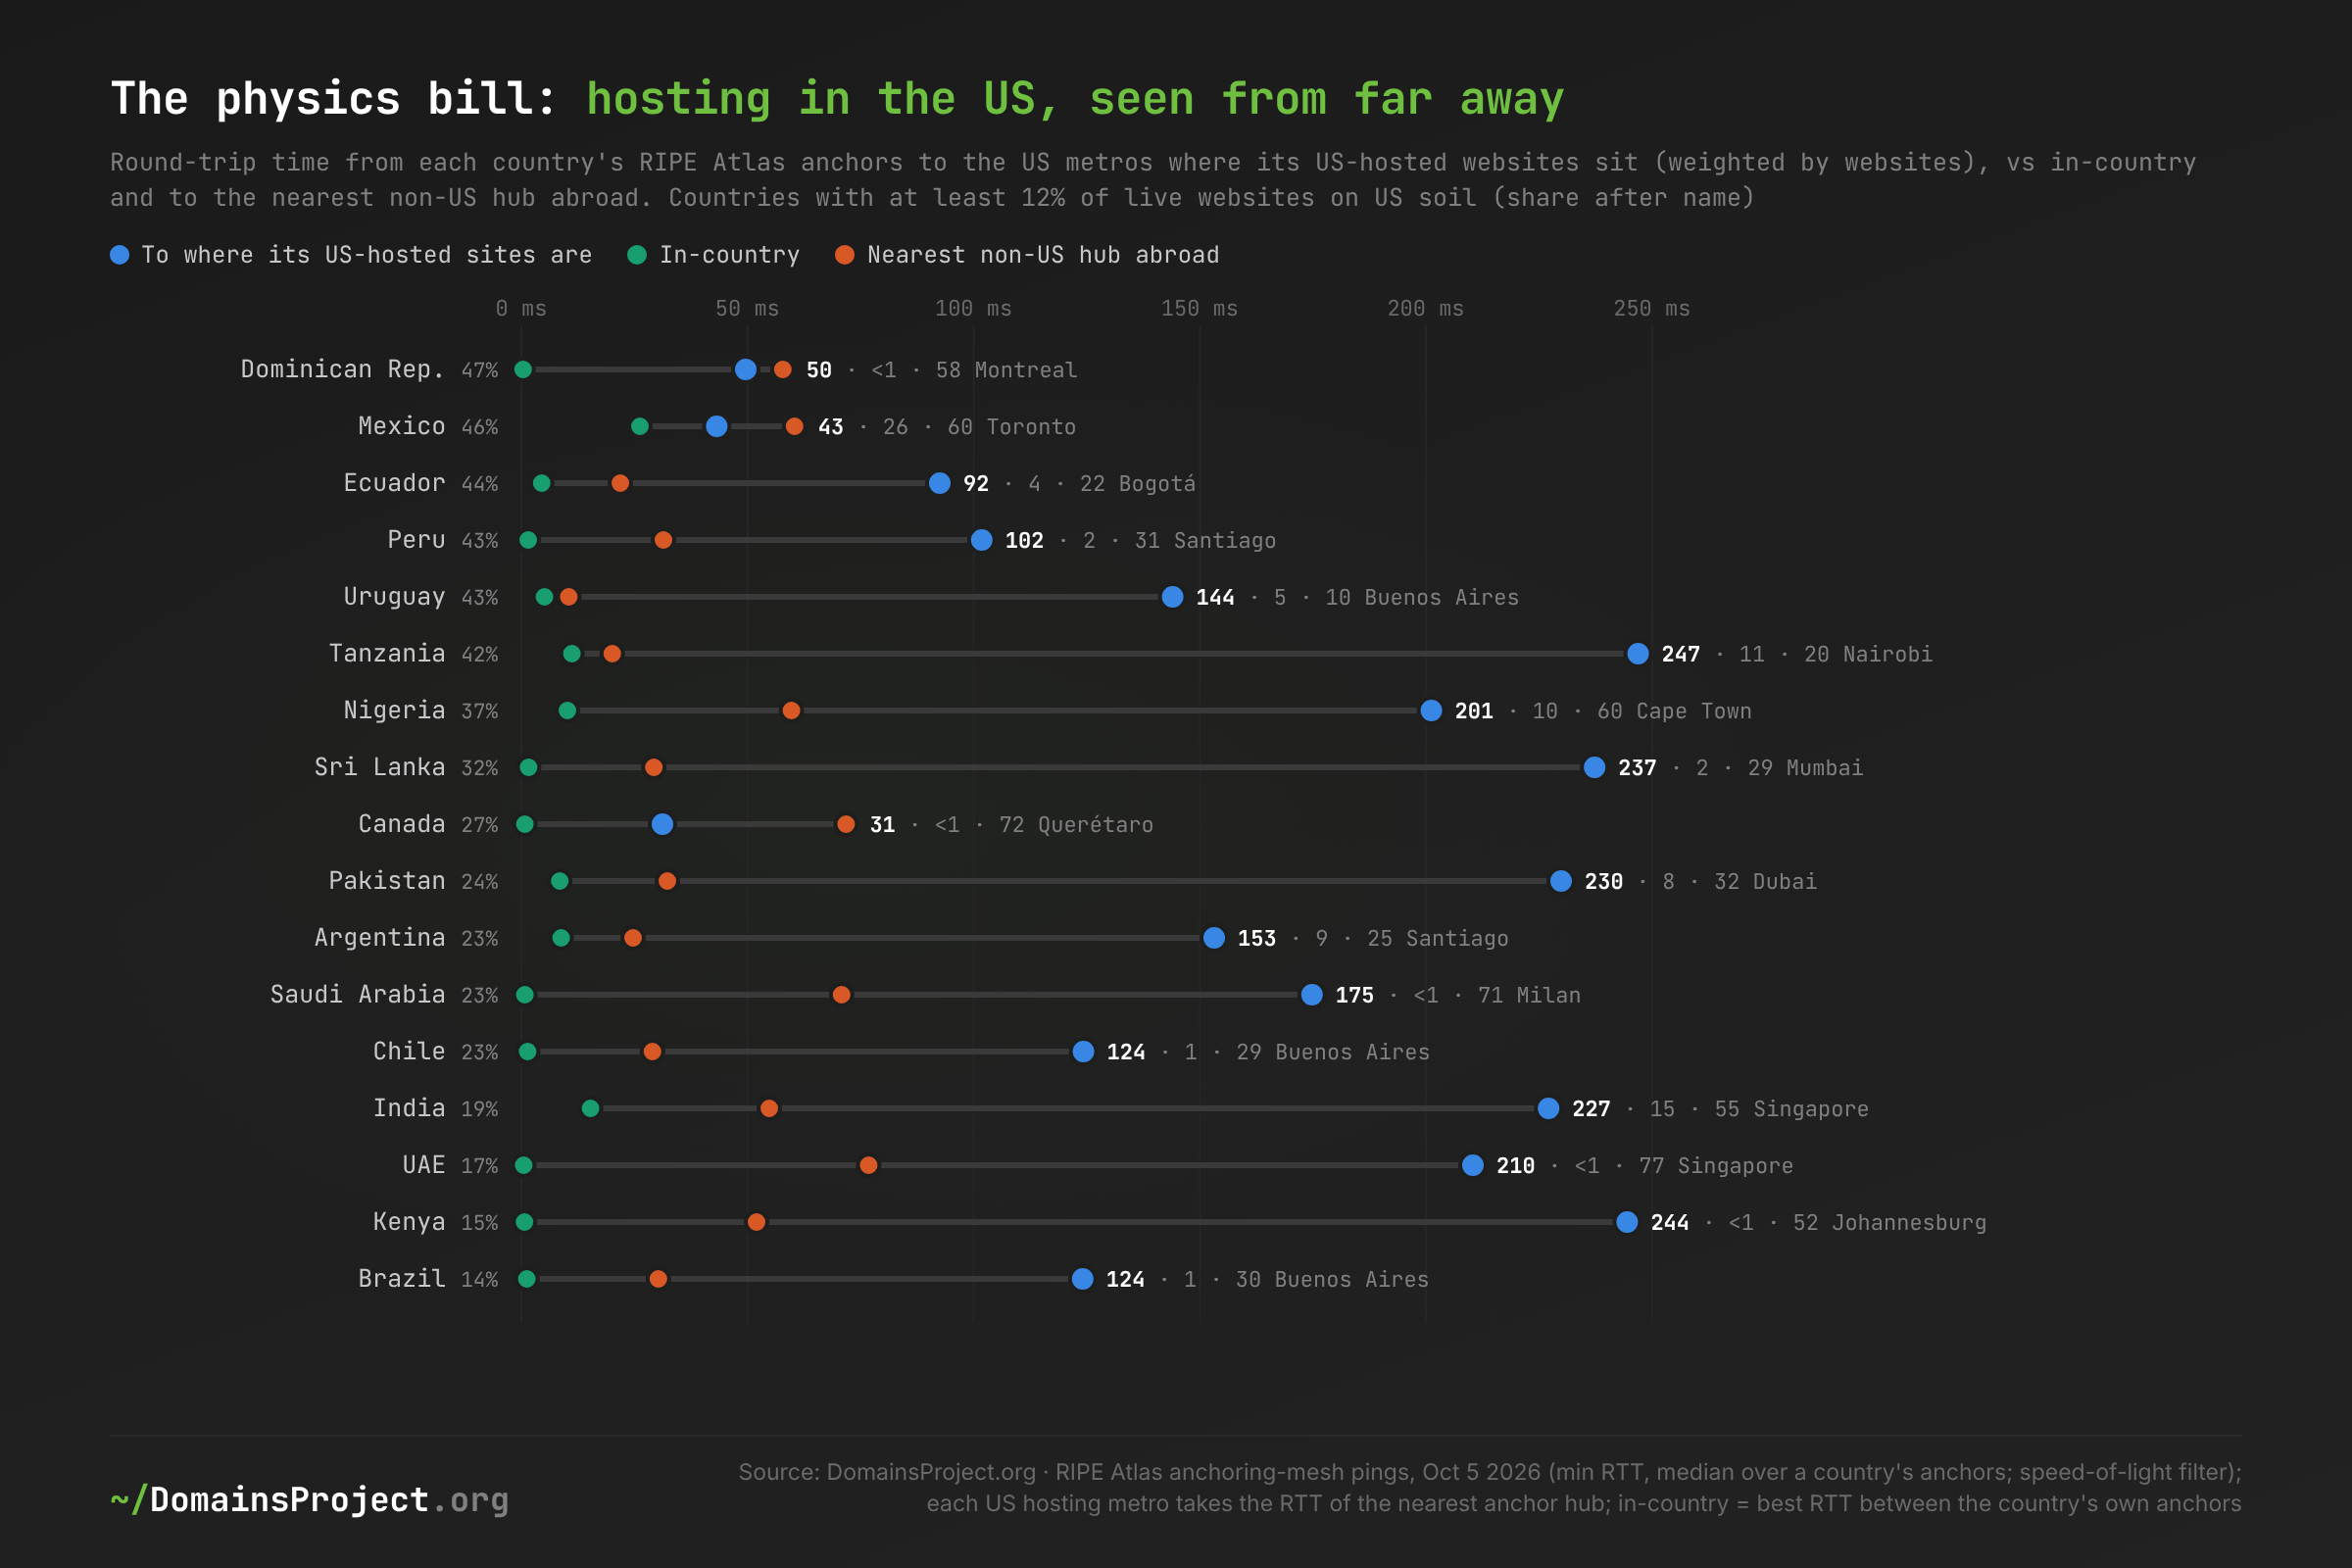
Download: usdep-latency.csv — RIPE Atlas anchoring-mesh pings, October 5 2026 (min RTT; median over a country's anchors); hosting metros from the September 2026 crawl
3.04 million US-hosted websites — 63.8% of the 4.77 million — belong to 58 countries where the US round trip is more than 100 ms longer than a domestic or nearby non-US alternative.
- Why it matters: a page that needs four round trips before its first byte (DNS, TCP, TLS, request) loses 0.4–0.9 seconds to distance alone.
- External check: WonderNetwork's public ping data, September 21 – October 6, agrees on the order of magnitude: Mumbai–Washington 206–215 ms, Johannesburg–Nairobi 52 ms, Buenos Aires–São Paulo 30 ms against 134 ms to Miami.
- Where Atlas and WonderNetwork disagree: Mumbai–Singapore was about 153 ms on WonderNetwork's servers against 55 ms between Atlas anchors. Regional routing depends heavily on the network, which is why the recommendations below point to domestic hosting first and regional hubs second.
Direction of Travel: The Switching Ran Toward the US
If the world were leaving American providers, it would show first in mail and DNS, the two layers a domain owner can change in an afternoon. We joined the April 10, 2025 and September 2026 crawls domain by domain:
- 38.3 million domains in the 77 namespaces and
.euhad attributable mail in both crawls; - 47.6 million had attributable DNS.
Operator headquarters were held at their September 2026 state, so a company changing hands does not count as a move.
| Mail (MX) | DNS (NS) | |
|---|---|---|
| Domains that moved onto a US-headquartered operator | 643,195 | 1,511,710 |
| Domains that moved off one | 232,737 | 624,930 |
| Ratio | 2.8× | 2.4× |
| Operator-to-operator moves only (self-run and unattributed excluded) | 304,081 vs 139,313 (2.2×) | 1,235,326 vs 521,039 (2.4×) |
| Domestic operator → US vs US → domestic | 193,939 vs 71,710 (2.7×) | 888,370 vs 360,938 (2.5×) |
| US-headquartered share of these domains | 21.2% → 22.2% | 21.2% → 23.0% |
Download: usdep-flows-by-country.csv — per country, all moves and operator-to-operator moves, both layers
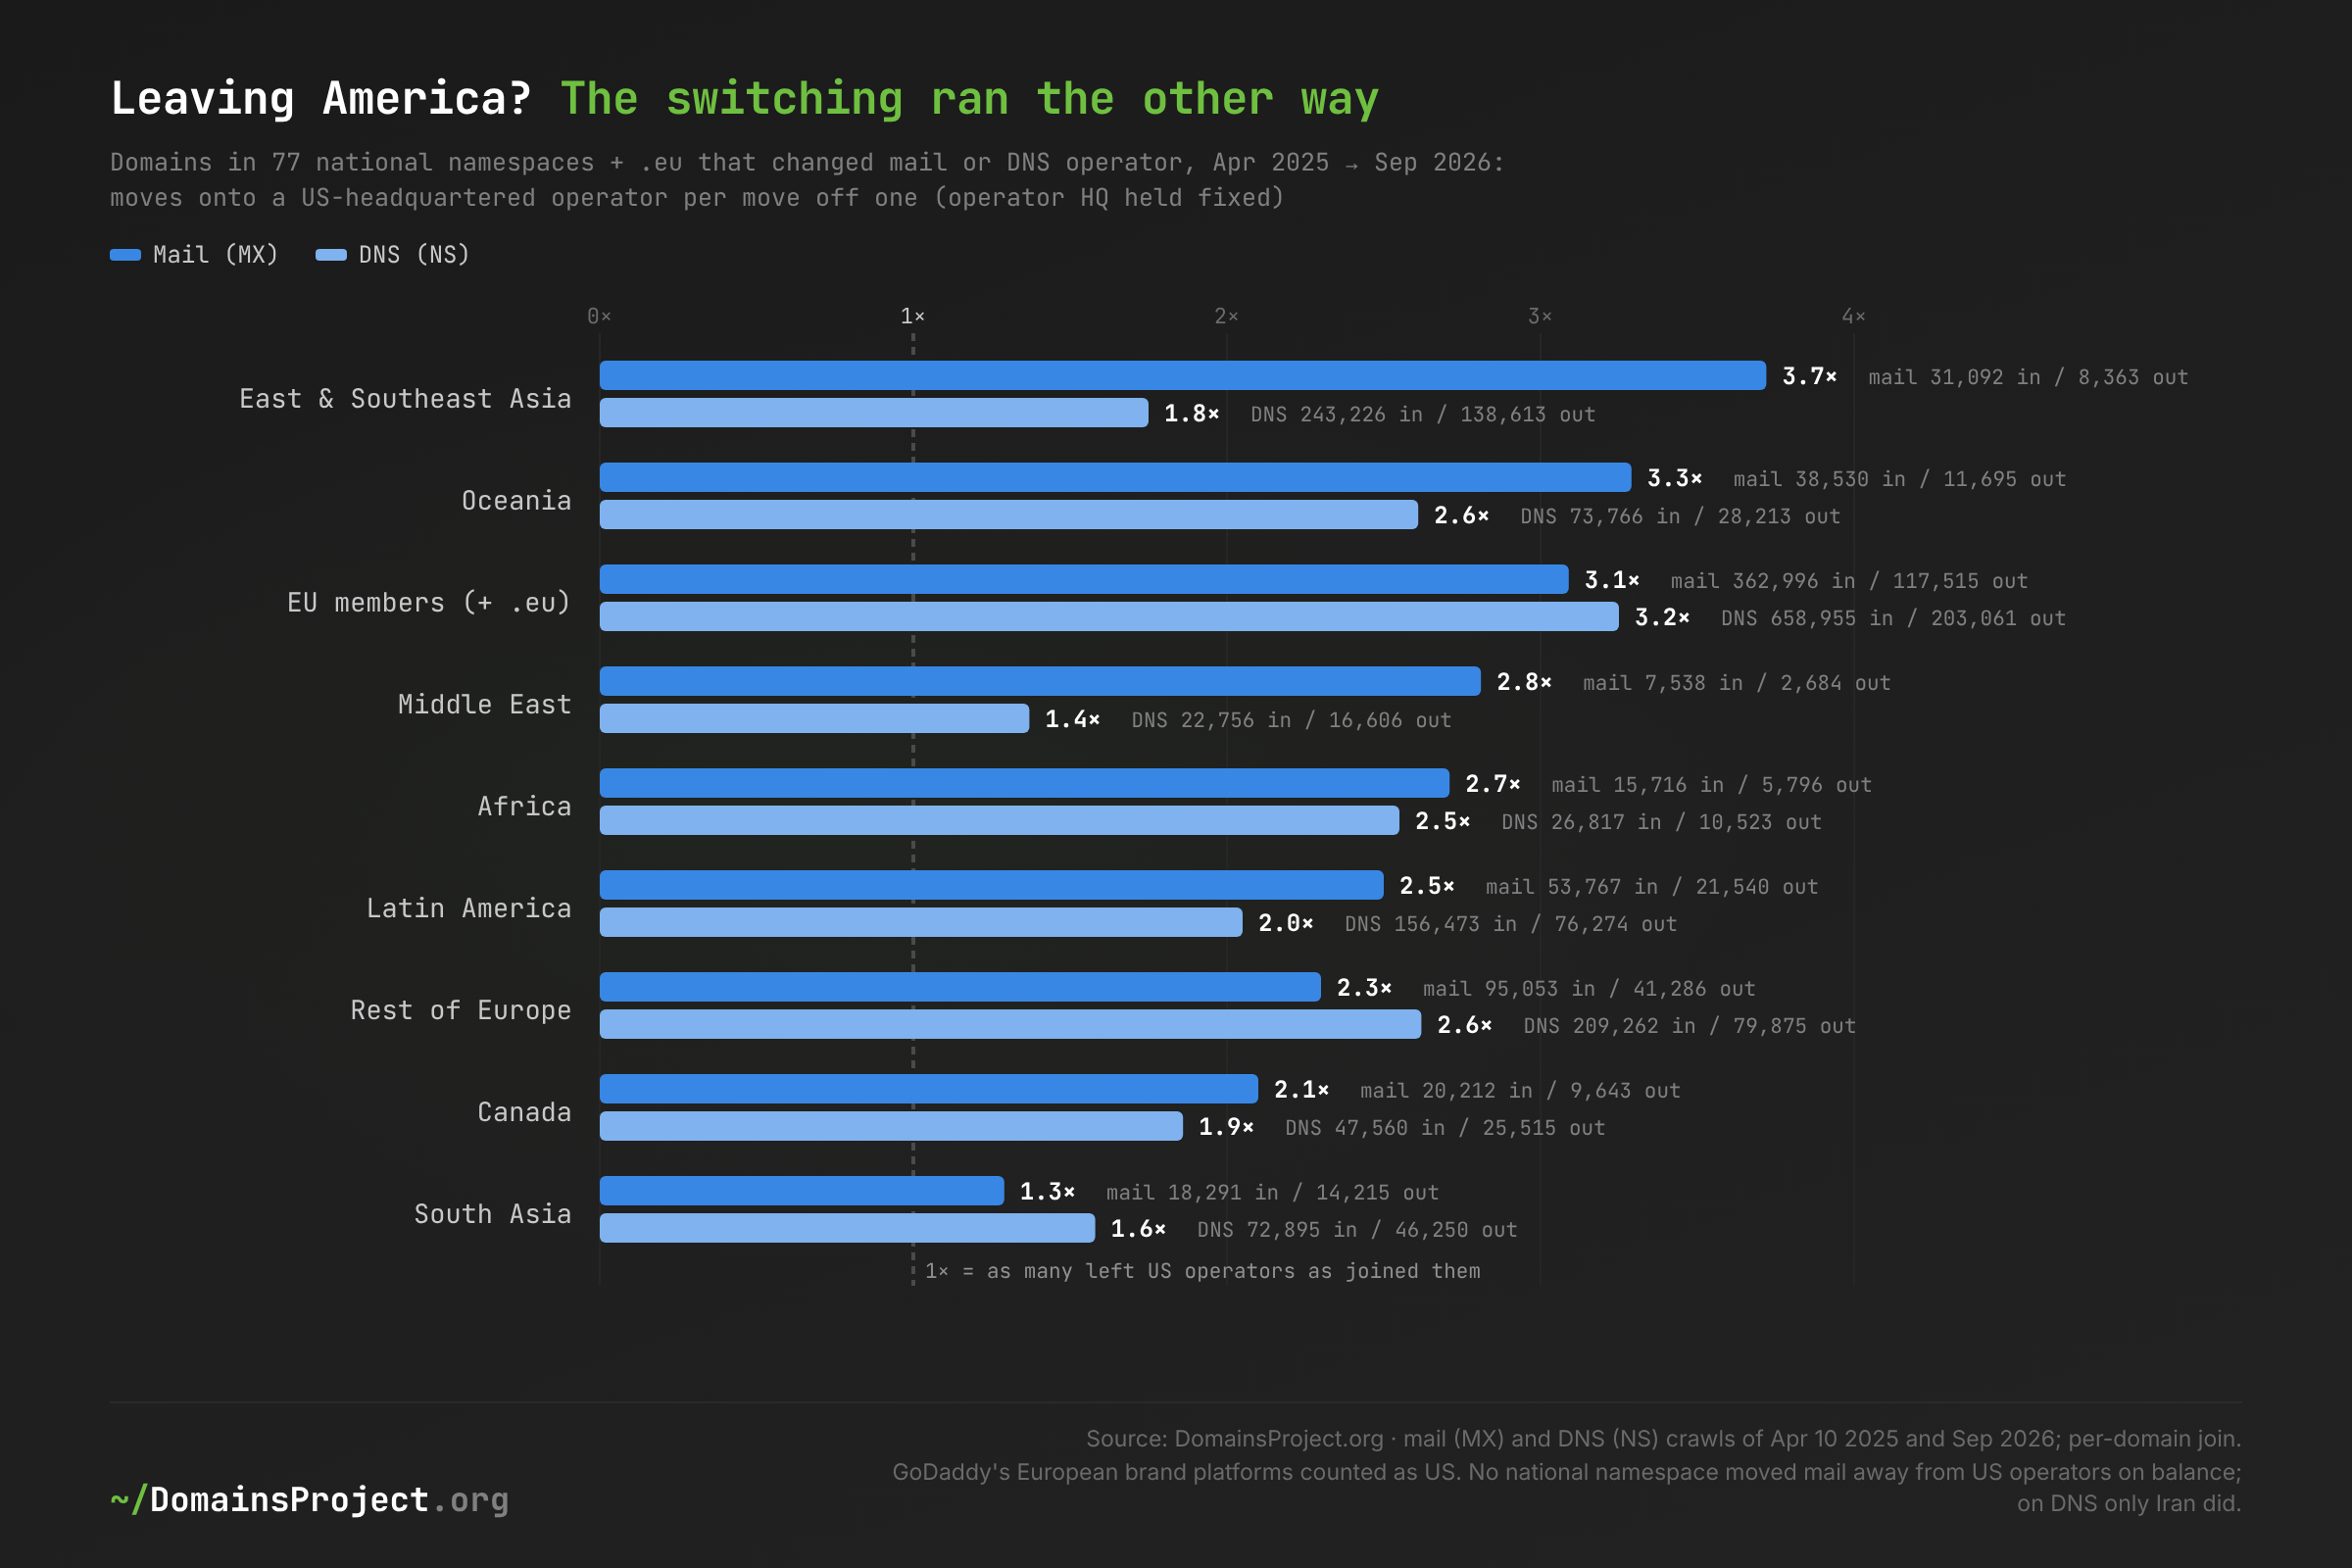
Download: usdep-flows.csv — 77 national namespaces + .eu; GoDaddy's European brand platforms counted as US
Counting all moves, including from self-run mail, no national namespace moved its mail away from US operators on balance. On DNS only Iran did (6,415 moves onto US operators, 10,983 off).
Europe was among the most lopsided regions:
- EU members and
.eu: 3.1 mail moves onto US operators for every move off, and 3.2 for DNS. - France: 3.4 for mail and 4.5 for DNS.
- The Netherlands: 2.3 and 4.8.
- Denmark, whose digital ministry announced a move off Microsoft: 2.7 and 3.8.
The individual moves show how.
- French DNS: the largest stream was customers of OVHcloud moving their nameservers to Cloudflare (19,390 domains), followed by customers of o2switch, Netim and Gandi.
- German mail: the largest stream was self-run mail moving to Microsoft 365 (63,496 domains), followed by IONOS and Strato customers doing the same.
- German DNS: IONOS, Strato and All-Inkl customers moved to Cloudflare.
- What drives it: most of these look like customer choices, not platform migrations — customers choosing a US product (mostly a free CDN and DNS, and the dominant office suite) over the one their European host bundled.
Some of the movement is providers', not customers'. GoDaddy, which owns the German host domainFactory, moved domainFactory's mail customers to Microsoft 365 from 2024 (Borncity). That moves German data into Microsoft's cloud without any customer choosing it. Because domainFactory already belongs to a US group, we count it as US before and after: it is not in the ratios above. Counted as German, as the index's attribution did, it would add 45,000 German "moves" to the US.
The only exodus is in South Asia and Africa, and only partly toward home.
- Who: counting operator-to-operator moves only, mail left US providers on balance in India, Pakistan, Bangladesh, Nigeria and Kenya.
- Where it went: India's largest streams were Google Workspace → Zoho (1,876 domains), GoDaddy → Hostinger (1,757), Google Workspace → Hostinger (1,520) and GoDaddy → Zoho (953).
- Why it qualifies: Zoho is Indian, so India's moves to Zoho are a move home. The moves to Hostinger, which is Lithuanian, are not. DNS data cannot tell us why customers chose either.
The stock moved the same way as the flows. Across the index's crawls, the median share of a country's live websites served from US soil or a US-run edge rose from 18.4% (April 2023) to 32.4% (September 2026). Meanwhile the share on US soil alone fell from 7.8% to 6.5%. The median US share of mail rose from 26.6% to 28.4% and of DNS from 25.5% to 31.7% (April 2025 → September 2026).
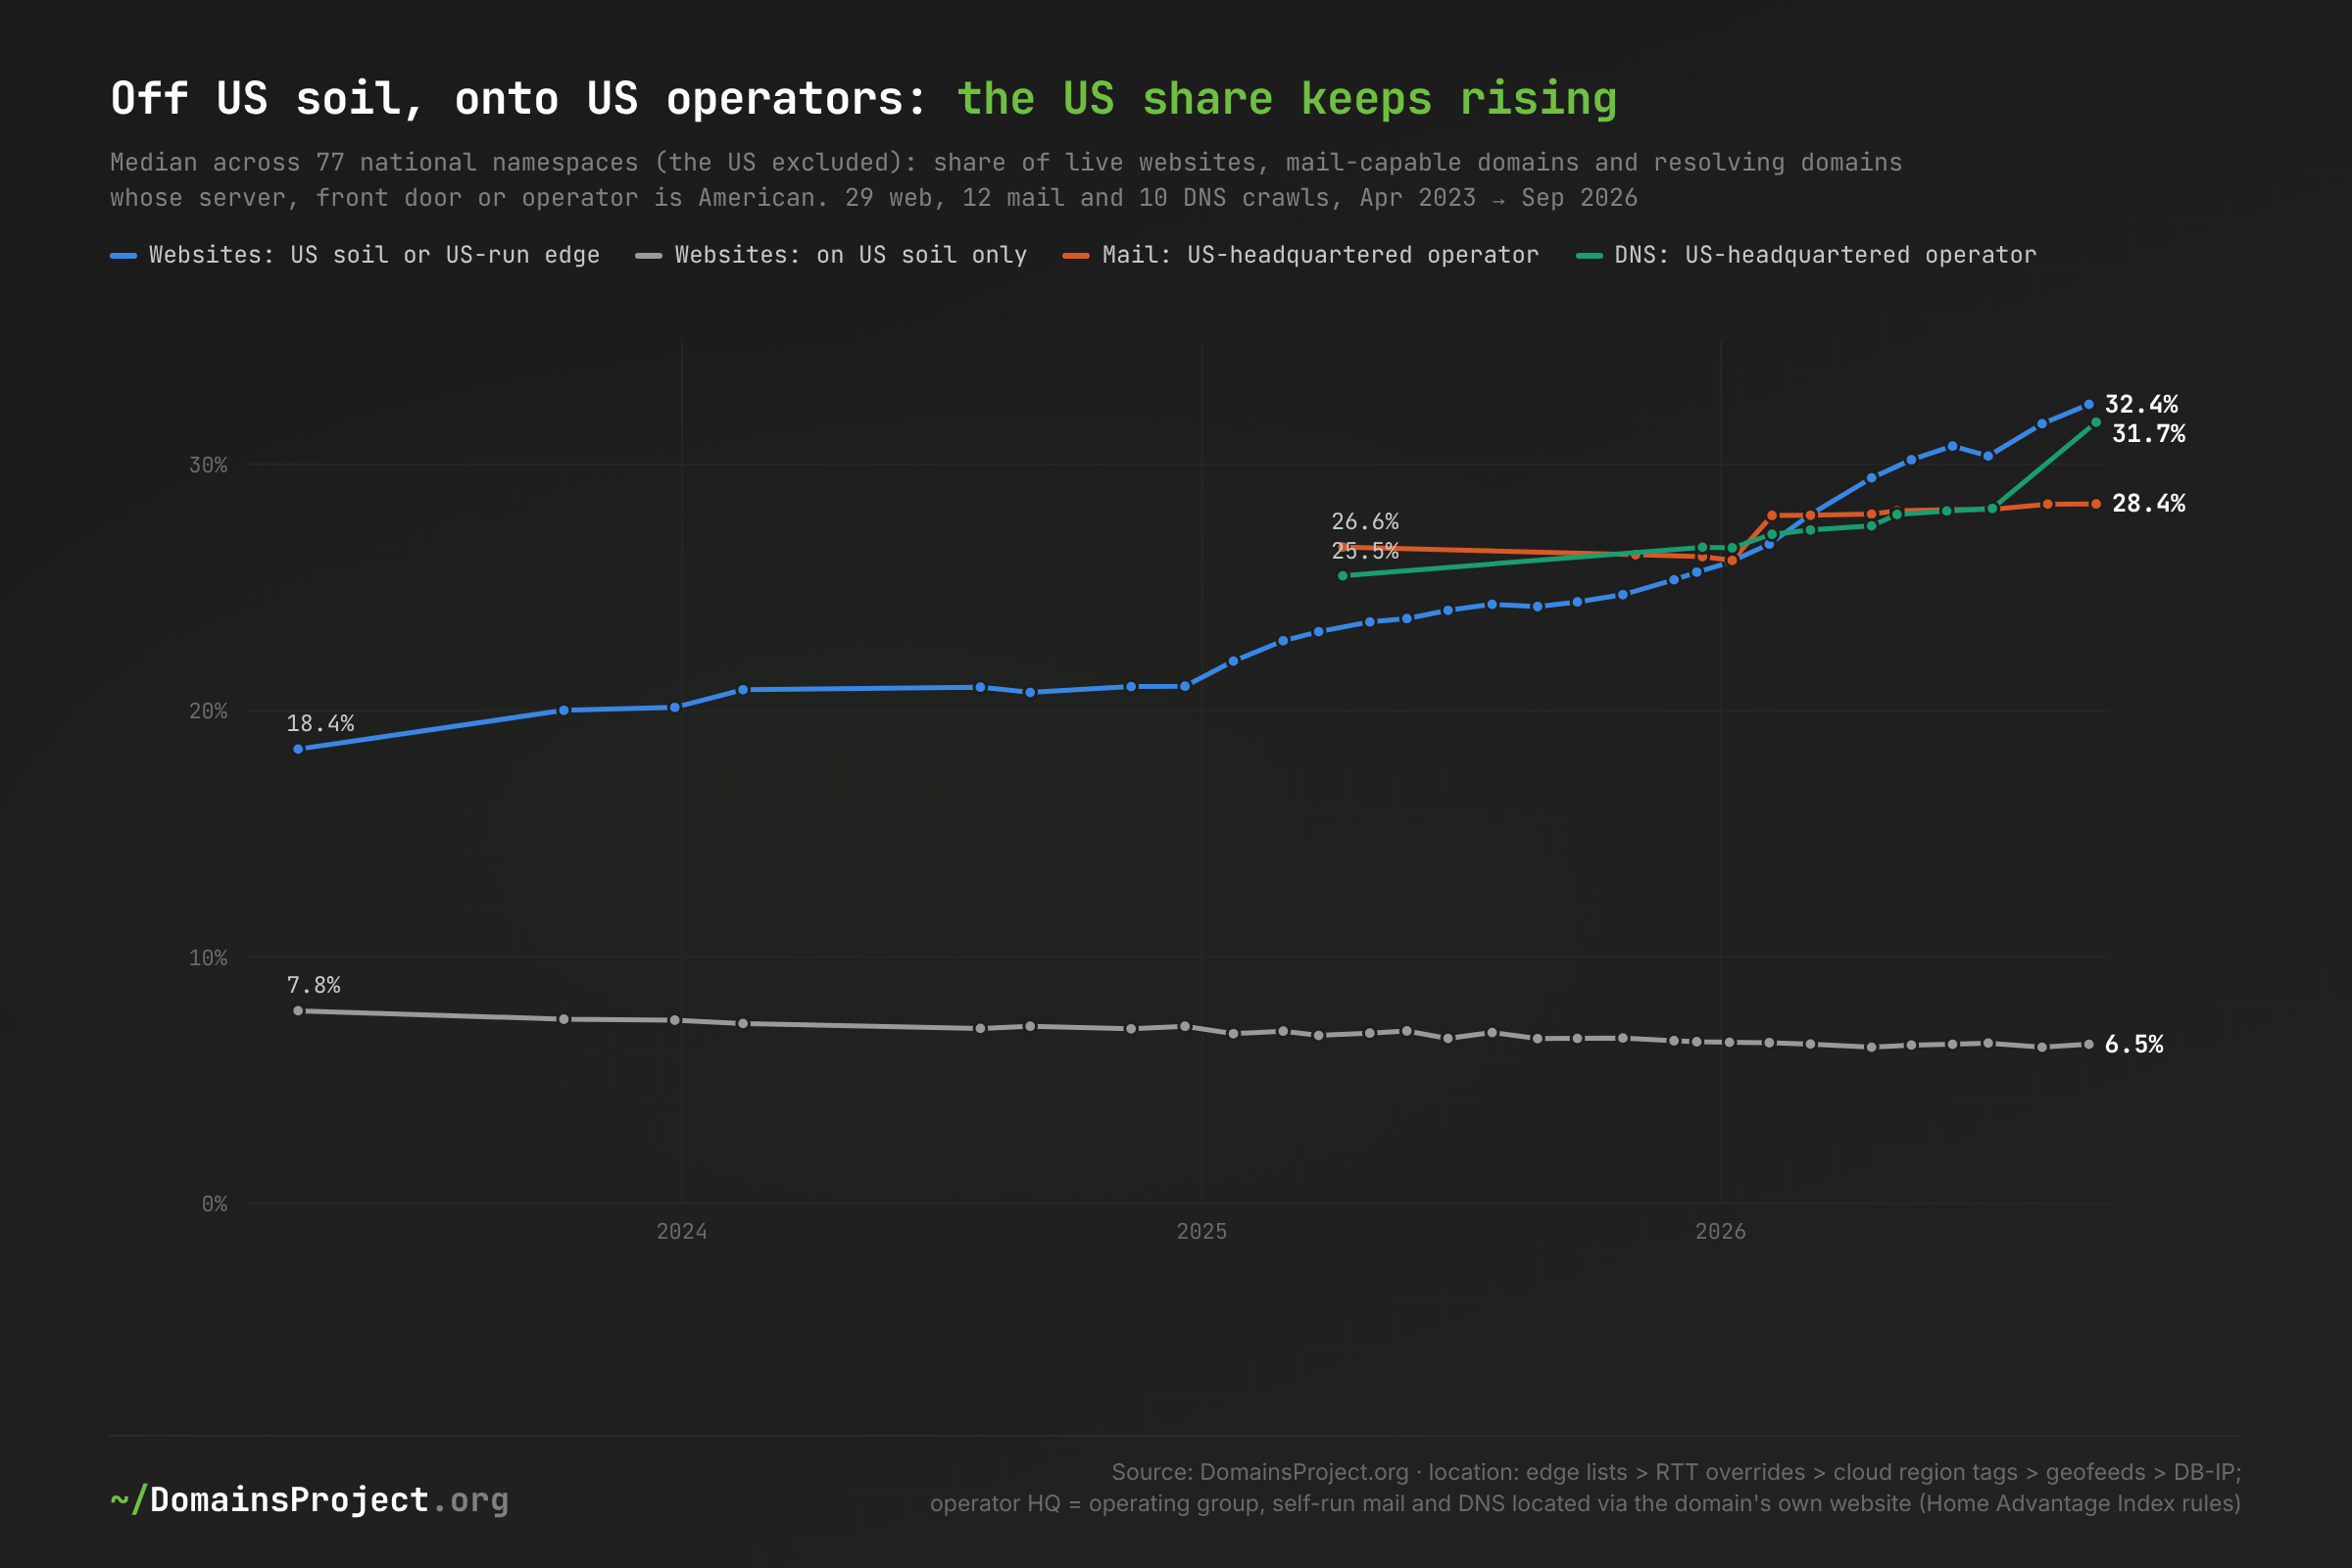
Download: usdep-trend.csv — Home Advantage Index series (29 hosting, 12 mail, 10 DNS crawls); mail and DNS shares over all domains with an MX or NS record, self-run located via the domain's own website
This is consistent with what the Canada post found after the 2025 tariff shock: sentiment moved, the namespace did not. We cannot say why any one customer moved; the crawls record what changed, not the motive. Whatever the reasons, the sovereignty debate did not change the direction of private customers' choices in these 17 months. The exceptions are the institutions in the sections below, where some governments are now writing ownership into procurement rules.
Cloud: The Regions Exist; Most Customers Outside Europe and East Asia Don't Use Them
4.8% of live websites in the 77 namespaces are served directly from an AWS, Google Cloud, Azure or Oracle region (not through an edge). Which region they choose is the cheapest sovereignty decision there is: it changes physical location, latency and data-residency obligations without changing provider.
| Country | Websites served from a hyperscaler region | In-country region | US region | Other foreign region |
|---|---|---|---|---|
| Mexico | 42,806 | 2.2% | 82.4% | 15.4% |
| Argentina | 31,612 | 0.0% | 82.8% | 17.2% |
| Uruguay | 4,679 | 0.0% | 81.4% | 18.6% |
| Peru | 6,881 | 0.0% | 80.7% | 19.2% |
| Canada | 156,753 | 13.4% | 74.7% | 12.0% |
| Chile | 32,283 | 4.3% | 63.0% | 32.7% |
| Brazil | 204,168 | 39.3% | 53.1% | 7.6% |
| South Africa | 27,437 | 24.1% | 48.6% | 27.3% |
| India | 176,870 | 39.5% | 30.3% | 30.2% |
| Israel | 14,960 | 15.2% | 37.8% | 46.9% |
| United Arab Emirates | 9,831 | 16.6% | 30.3% | 53.1% |
| Australia | 200,056 | 63.8% | 22.4% | 13.8% |
| United Kingdom | 383,814 | 45.9% | 23.8% | 30.4% |
| Germany | 265,663 | 37.6% | 14.8% | 47.6% |
| France | 134,004 | 18.3% | 14.8% | 66.9% |
| Netherlands | 233,556 | 59.8% | 15.8% | 24.4% |
| Japan | 90,364 | 85.5% | 10.0% | 4.5% |
| South Korea | 36,158 | 69.5% | 9.5% | 21.0% |
| Singapore | 11,735 | 59.4% | 23.3% | 17.3% |
| Indonesia | 9,138 | 16.7% | 18.6% | 64.7% |
| 77 pooled | 3,138,914 | 29.6% | 26.5% | 43.9% |
Hyperscaler-region websites only (location by the provider's own region tags), September 2026. By provider: AWS 1.72 million websites (24.5% in-country, 31.5% in a US region), Google Cloud 1.09 million (34.4% / 22.2%), Azure 271,000 (36.4% / 14.8%), Oracle 59,000 (61.8% / 15.8%).
Latin American customers default to US regions even where local regions exist.
- Mexico: AWS, Google Cloud and Azure all now run regions in Querétaro (AWS since January 2025), yet 82.4% of
.mxwebsites hosted on hyperscalers are served from the US and 2.2% from Mexico. - Canada: three in four (74.7%) hyperscaler-hosted
.cawebsites use US regions, against 13.4% in Canadian regions. - Argentina, Uruguay, Ecuador and Peru, which have no hyperscaler region of their own, use US regions for 81–83% of hosted websites. São Paulo and Santiago are 25–36 ms from Argentine anchors against 130 ms to Miami.
Japan, Korea, Australia, the Netherlands and Singapore show what happens where local regions are long established: 59–86% of hyperscaler-hosted websites stay in-country.
Region choice is not sovereignty. A Querétaro or Frankfurt region of a US company is still a US company's service, as the next sections show. But the 833,000 websites in the 77 namespaces that sit in US regions are the easiest candidates for a move. 499,000 of them belong to countries 100 ms or more from the US, and moving them does not require changing provider.
The Edge: US Networks Answer From Inside Most Countries
The fastest-growing part of US dependence is also the part that is physically local. A website behind Cloudflare, CloudFront or Fastly is answered by the nearest point of presence (PoP) of a US company, which is usually in the reader's own country. We checked where three US networks actually answer from. Globalping probes on home and office connections in 66 of the 77 countries (two probes per country, two rounds on October 5) requested one site on each network and read the PoP from the response header (cf-ray, x-amz-cf-pop, x-served-by).
| Network | Requests answered | Answered from a PoP in the requester's country | Countries where most requests stayed in-country | Answered from a US PoP |
|---|---|---|---|---|
| Cloudflare | 246 | 81.7% | 57 of 66 | 11 requests (Mexico, Ecuador, China) |
| AWS CloudFront | 248 | 52.4% | 37 of 66 | 13 (Mexico, Canada, Ecuador, China, plus single stray requests from Germany, Ireland and Lithuania) |
| Fastly | 248 | 43.5% | 28 of 66 | 11 (Canada, Ecuador, Vietnam, China) |
Cloudflare is local almost everywhere it is used. Readers in Lagos, Karachi, Dhaka, Kathmandu, Asunción and Tbilisi reached a Cloudflare PoP in their own country. The exceptions show where the edge is regional rather than national: Peru is served from Santiago, Uruguay from Buenos Aires, Luxembourg from Frankfurt, Moldova and North Macedonia from Bucharest and Sofia. China is the one large case served from the US (Los Angeles), because the free global network does not operate inside mainland China. Iranian probes reached all three networks in Frankfurt.
The edge undoes the latency argument for leaving, but not the legal one. For a website behind a US edge, the physical first hop is local, the TLS session terminates on the US company's server, and the company holds the keys. Section "The Legal Layer" below explains why location does not change US reach. This is the same split the Canada post found in Toronto: the front door is often local, the keys are not.
DNS and the Registries: Even the Country Codes Lean on US Operators
For most national namespaces, at least one of the registry's own nameservers runs on a US operator's network. We looked up the authoritative nameservers of every ccTLD on October 5 and mapped each address to the network that announces it (RouteViews, October 3) and its operating group.
ccTLDs (242 ASCII ccTLDs; Russian-territorial, .by, .kz, .kg and .uz excluded) |
The 77 countries + .eu |
|
|---|---|---|
| At least one nameserver on a US-headquartered operator | 181 (75%) | 56 of 78 |
| … of which run at least one PCH server (US non-profit) | 125 | 37 use PCH as their only US operator |
| Majority of nameservers US-operated | 8 (.au .bs .bt .mn .om .pr .sc .ws) |
1 (.au) |
| All nameservers US-operated | 18 (.io .ai .me .tv .cc .ac .sh .us .ag .bz .lc .vc .gi .mm .mu .vu .bm .mp) |
0 |
Download: usdep-registry-ns.csv
The registry layer is resilient by design, not sovereign. Most ccTLDs add PCH's anycast service as one secondary among several, which keeps a TLD answering during an attack. That is a reasonable engineering choice, and losing one secondary would not take a TLD offline. The concentrated cases are different:
- Commercially marketed ccTLDs such as
.io,.ai,.me,.tvand.ccrun every nameserver on US registry back ends (Identity Digital, Verisign). .auruns four of its five on Identity Digital, the US company that operates the Australian registry..ukruns four of eight on Vercara's UltraDNS, which belongs to DigiCert.- Partial hyperscaler hosting:
.gehas two of four nameservers on AWS,.myhas one each on AWS and Oracle, and.twhas one each on Azure and Google Cloud.
One level up, ten of the thirteen root-server letters are operated by US organisations (Verisign A and J, USC-ISI B, Cogent C, the University of Maryland D, NASA E, ISC F, the US Department of Defense G, the US Army Research Lab H, ICANN L). Only I (Netnod, Sweden), K (RIPE NCC, Netherlands) and M (WIDE, Japan) are not. Root service is anycast, though: only about 17% of the roughly 2,048 root instances sit in the US, so the letters' operators and their servers' locations are two different maps.
For customer domains, DNS is the layer that moved fastest. In the median country, a US-headquartered operator now runs DNS for 25.0% of live websites. In the index's pooled DNS data, Cloudflare alone grew from 8.3% to 13.0% of all domains between April 2025 and September 2026. The switching flows below show how that happened: in Germany, France and the Netherlands, the top moves toward US operators were customers of IONOS, Strato, All-Inkl, OVH, o2switch and TransIP pointing their nameservers at Cloudflare.
TLS Certificates: The Layer Every Sovereignty Plan Forgets
Of the TLS certificates presented by a random sample of live websites in 77 countries and .eu, 97.9% were issued by US-headquartered certificate authorities. We sampled 400 live websites per national namespace (US excluded) and completed a TLS handshake with 27,406 of 31,200 on October 5. We recorded the issuing CA and folded reseller brands into the CA they chain to: GoGetSSL and Gehirn chain to Sectigo, and home.pl and nazwa.pl to Certum. Self-signed and hoster-private certificates (1.7%) were set aside.
| Certificate authority | HQ of operating group | Share of publicly trusted certificates |
|---|---|---|
| Let's Encrypt (ISRG, non-profit) | US | 72.9% |
| Google Trust Services | US | 15.8% |
| Sectigo (incl. ZeroSSL, cPanel AutoSSL, resellers) | US (US private-equity owned) | 5.7% |
| DigiCert (incl. RapidSSL, GeoTrust, Thawte) | US | 1.9% |
| Amazon | US | 0.9% |
| Actalis (Aruba) | Italy | 0.5% |
| GlobalSign (GMO) | Japan | 0.5% |
| Certum (Asseco) | Poland | 0.4% |
| GoDaddy / Starfield | US | 0.3% |
Download: usdep-tls.csv
Italy, Poland and Japan are the only large exceptions:
- Italy (66.5% US): Aruba, the country's largest host, issues its customers' certificates through its own CA, Actalis, which covers a third of
.it. - Poland (81.2%): home.pl, nazwa.pl and cyber_Folks resell Certum.
- Japan (84.9%): GlobalSign and domestic CAs.
Everywhere else the figure is above 90%, including Iran (96.5%, with Let's Encrypt alone at 92%). W3Techs puts Let's Encrypt at 67.4% of websites with a known CA (October 5), consistent with our 72.9% for a sample that includes the long tail.
The certificate layer concentrates more than any other we measured, but a CA cannot read traffic. A certificate authority signs a public key and never holds the private key. What a US CA could do, in principle, is stop issuing or revoke. Short lifetimes make that matter more each year: the maximum certificate lifetime fell to 200 days on March 15, 2026 and falls to 47 days in 2029, so a site that loses its issuer has weeks, not years. The non-US alternatives are thin:
- Buypass (Norway) stopped selling TLS certificates in October 2025.
- Among the non-US CAs checked, Actalis is the only one offering free ACME certificates.
- ZeroSSL, despite its Vienna address, is owned from Texas and chains to Sectigo's roots.
Email and the Productivity Tenant: Where the Data Actually Lives
Mail is the layer where US dependence means US custody of content. A hosting company serves pages; a mail provider stores the mailbox. Across the 77 namespaces:
- US operators: run mail for 26.3% of mail-capable live websites (median 30.9%).
- Microsoft 365 and Google Workspace: Microsoft is the first hop for 8.4% and Google Workspace for 7.2%.
- Most dependent: the Dominican Republic (68.1%), Mexico (62.9%), Australia (61.3%), New Zealand (61.1%) and Canada (60.7%).
- Least: Iran (2.8%), China (7.6%), Slovakia (10.2%), Tunisia (11.9%), Poland (12.2%) and France (12.7%).
| Microsoft 365 is first-hop mail for | Google Workspace is first-hop mail for | Domains with a Microsoft 365 tenant record (MS=) |
|
|---|---|---|---|
| Australia | 28.6% | 20.4% | 17.6% |
| New Zealand | 26.8% | 22.3% | 21.0% |
| Iceland | 20.0% | 21.2% | 19.5% |
| Saudi Arabia | 19.9% | 19.1% | 16.3% |
| Norway | 19.2% | 6.6% | 17.4% |
| Finland | 17.1% | 9.1% | 15.6% |
| Ireland | 17.0% | 14.2% | 18.0% |
| Thailand | 10.1% | 25.7% | 12.3% |
| Germany | — | — | 4.9% |
| 77 pooled | 8.4% | 7.2% | 7.2% |
Download: usdep-saas-tokens.csv — first-hop shares of mail-capable live websites (September 2026); MS= tokens among domains with classified TXT records (July 2026 TXT crawl)
The Nordic countries are the surprise. Norway, Sweden, Finland and Denmark have strong domestic hosting (US soil under 4%) but some of the highest Microsoft 365 tenant rates in the panel:
- 14.8–17.4% of domains with TXT records verify a Microsoft tenant.
- Germany: 4.9%. Poland: 2.8%.
Denmark's sovereignty debate is a debate about the office suite, and the data shows why: the hosting is already Danish.
Tenant records reach further than MX. An MS= record means the domain is verified in a Microsoft 365/Entra tenant. That is identity at a minimum, often Teams, SharePoint, OneDrive and mailboxes, even when mail first lands on a domestic filtering gateway. That is why the institutions section uses all three signals. Google's verification token is not a Workspace signal (it is mostly Search Console), so we do not use it.
Routing and Cables: Latin America Talks to Itself Through Miami
Nearly half of the traceroutes between Latin American countries passed through the United States. We ran 3,088 one-off RIPE Atlas traceroutes on October 5, from 245 probes in 70 countries to RIPE Atlas anchors in other countries of the same region, and placed every hop the way the Canada post did. Exchange-point LANs come from PeeringDB, router names from reverse DNS. A US placement is dropped when the hop answered faster than light in fibre allows from the probe.
| Region | Traces reaching the target | Path crossed the US | Median RTT, via US / not via US |
|---|---|---|---|
| Latin America and the Caribbean, between countries | 1,610 | 769 (47.8%) | 129 ms / 106 ms |
| Latin America, within one country | 83 | 12 (14.5%) — Mexico 4 of 8 | 66 ms / 13 ms |
| Africa, between countries | 682 | 9 (1.3%); at least 65 (9.5%) crossed a European exchange | — / 150 ms |
| Middle East | 158 | 1 | — |
| South Asia | 126 | 1 | — |
| East and Southeast Asia | 189 | 2 | — |
| Oceania | 31 | 0 | — |
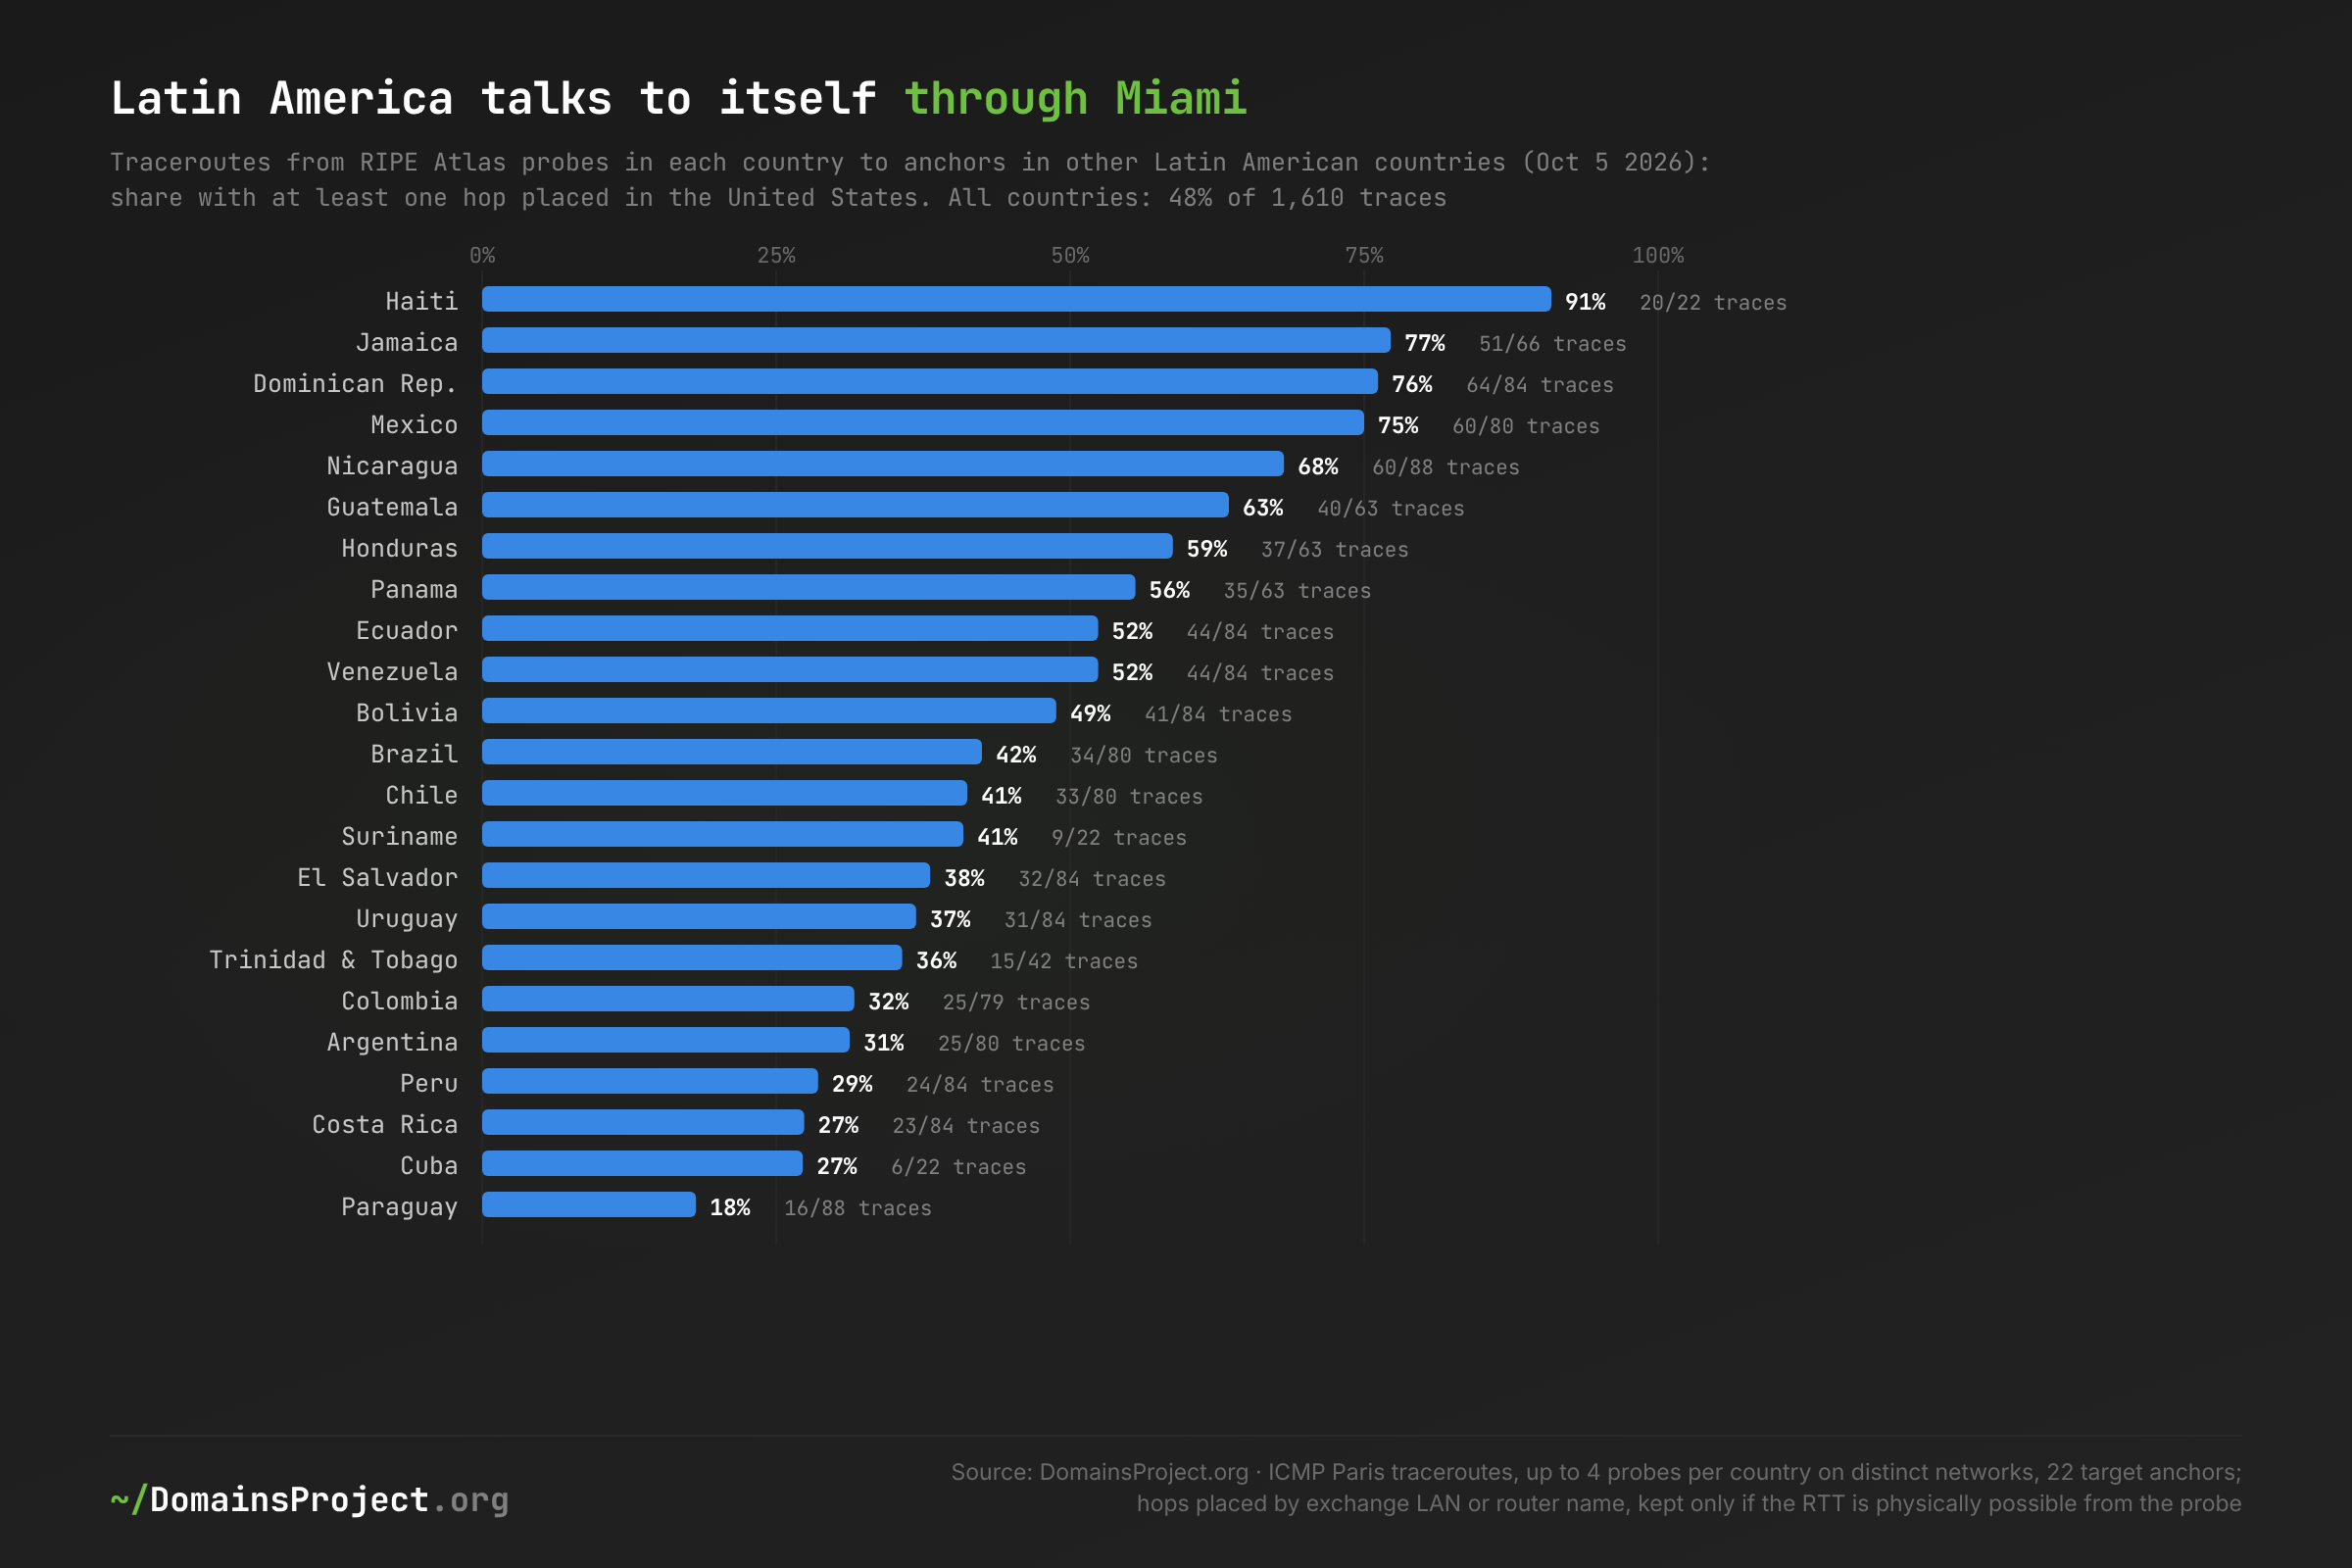
Download: usdep-routing.csv — RIPE Atlas one-off ICMP Paris traceroutes, October 5 2026; up to four probes per country on distinct networks
The detours run through Miami. 71% of the US hops on Latin American detours were placed in Miami, followed by Jacksonville, Atlanta, New York and Dallas.
- Most exposed: the Caribbean and Central America, where Haiti, Jamaica, the Dominican Republic, Nicaragua and Guatemala route 63–91% of regional paths through Florida.
- Mexico: 75% of regional paths and half of its sampled domestic paths leave through the US. That matches the latency matrix in "Latency" below, where Mexican anchors reach Dallas (28 ms) faster than the Querétaro hosting hub (67 ms).
- Southern Cone: fewer detours, because Brazil, Argentina, Chile, Uruguay and Paraguay interconnect more directly. Paraguay has the fewest (18%).
No other region detours through the US. Africa's long paths go through Europe instead: at least one in ten intra-African traceroutes crossed a European exchange, which is a lower bound because European router names were not mapped. The median round trip between African countries was 150 ms. The routing dependence on the US is a Latin American and Caribbean problem, a legacy of the region's cable map. Many systems land in Florida, and regional carriers buy transit there.
Cables tell a related story by ownership.
- Big-tech stakes: of the 607 cables in service in TeleGeography's Submarine Cable Map, 33 have Google, Meta, Amazon or Microsoft among their owners. That includes 22 of the 146 cables that entered service since 2020.
- Wholly owned: 11 cables belong entirely to Google and/or Meta, among them Curie, Dunant, Grace Hopper, Equiano, Firmina and Topaz.
- By country count: they are a quarter or more of the cables landing in Taiwan (8 of 17), Uruguay (2 of 4), Argentina (3 of 8), the Philippines (6 of 22) and Nigeria (2 of 8).
- Count understates traffic: content and cloud providers used "almost three quarters" of international bandwidth in 2024 (TeleGeography). Counting cables understates how much traffic rides on them.
Governments and Critical Institutions: The Microsoft Tenant Layer
Hosting statistics for whole namespaces mix bakeries with ministries. To see the institutions whose data most concerns sovereignty, we took every national body with an official website on Wikidata in 13 sectors. The list runs from ministries and central banks to legislatures, top courts, election bodies, data-protection authorities, public broadcasters, stock exchanges, universities, hospitals, banks and news media. We looked up their mail, DNS and web records live on October 5.
The test. Mail routing alone undercounts Microsoft, because many institutions keep their own gateway in front of Exchange Online, so we report three separate signals:
- Deliver: MX on Exchange Online.
- Send: the domain's SPF authorises Exchange Online to send for it.
- Tenant: an
MS=record verifies the domain in a Microsoft 365/Entra tenant.
Institutions in the US, Russia and Belarus are excluded, and each distinct mail domain counts once per country.
| Sector | Mail domains (countries) | Microsoft 365 signal | MX: US operator | DNS: US operator | Web: US network |
|---|---|---|---|---|---|
| Central banks | 165 (158) | 78.8% | 43.6% | 35.8% | 43.0% |
| Banks | 1,166 (75) | 73.4% | 47.9% | 36.7% | 40.2% |
| Stock exchanges | 123 (85) | 62.6% | 53.7% | 44.7% | 50.4% |
| Election bodies | 52 (50) | 59.6% | 25.0% | 38.5% | 48.1% |
| Public broadcasters | 89 (61) | 58.4% | 49.4% | 39.3% | 51.7% |
| Data-protection authorities | 43 (40) | 55.8% | 30.2% | 32.6% | 32.6% |
| National legislatures | 160 (147) | 48.8% | 31.2% | 30.0% | 36.2% |
| Universities | 5,856 (75) | 47.9% | 64.2% | 27.9% | 31.5% |
| Ministries | 1,745 (181) | 46.4% | 27.6% | 18.5% | 26.2% |
| Supreme courts | 156 (105) | 44.2% | 21.8% | 23.7% | 26.3% |
| Constitutional courts | 55 (52) | 43.6% | 14.5% | 21.8% | 20.0% |
| Hospitals | 5,440 (74) | 38.3% | 27.1% | 18.5% | 24.7% |
| News media | 2,536 (76) | 38.0% | 55.2% | 54.9% | 59.9% |
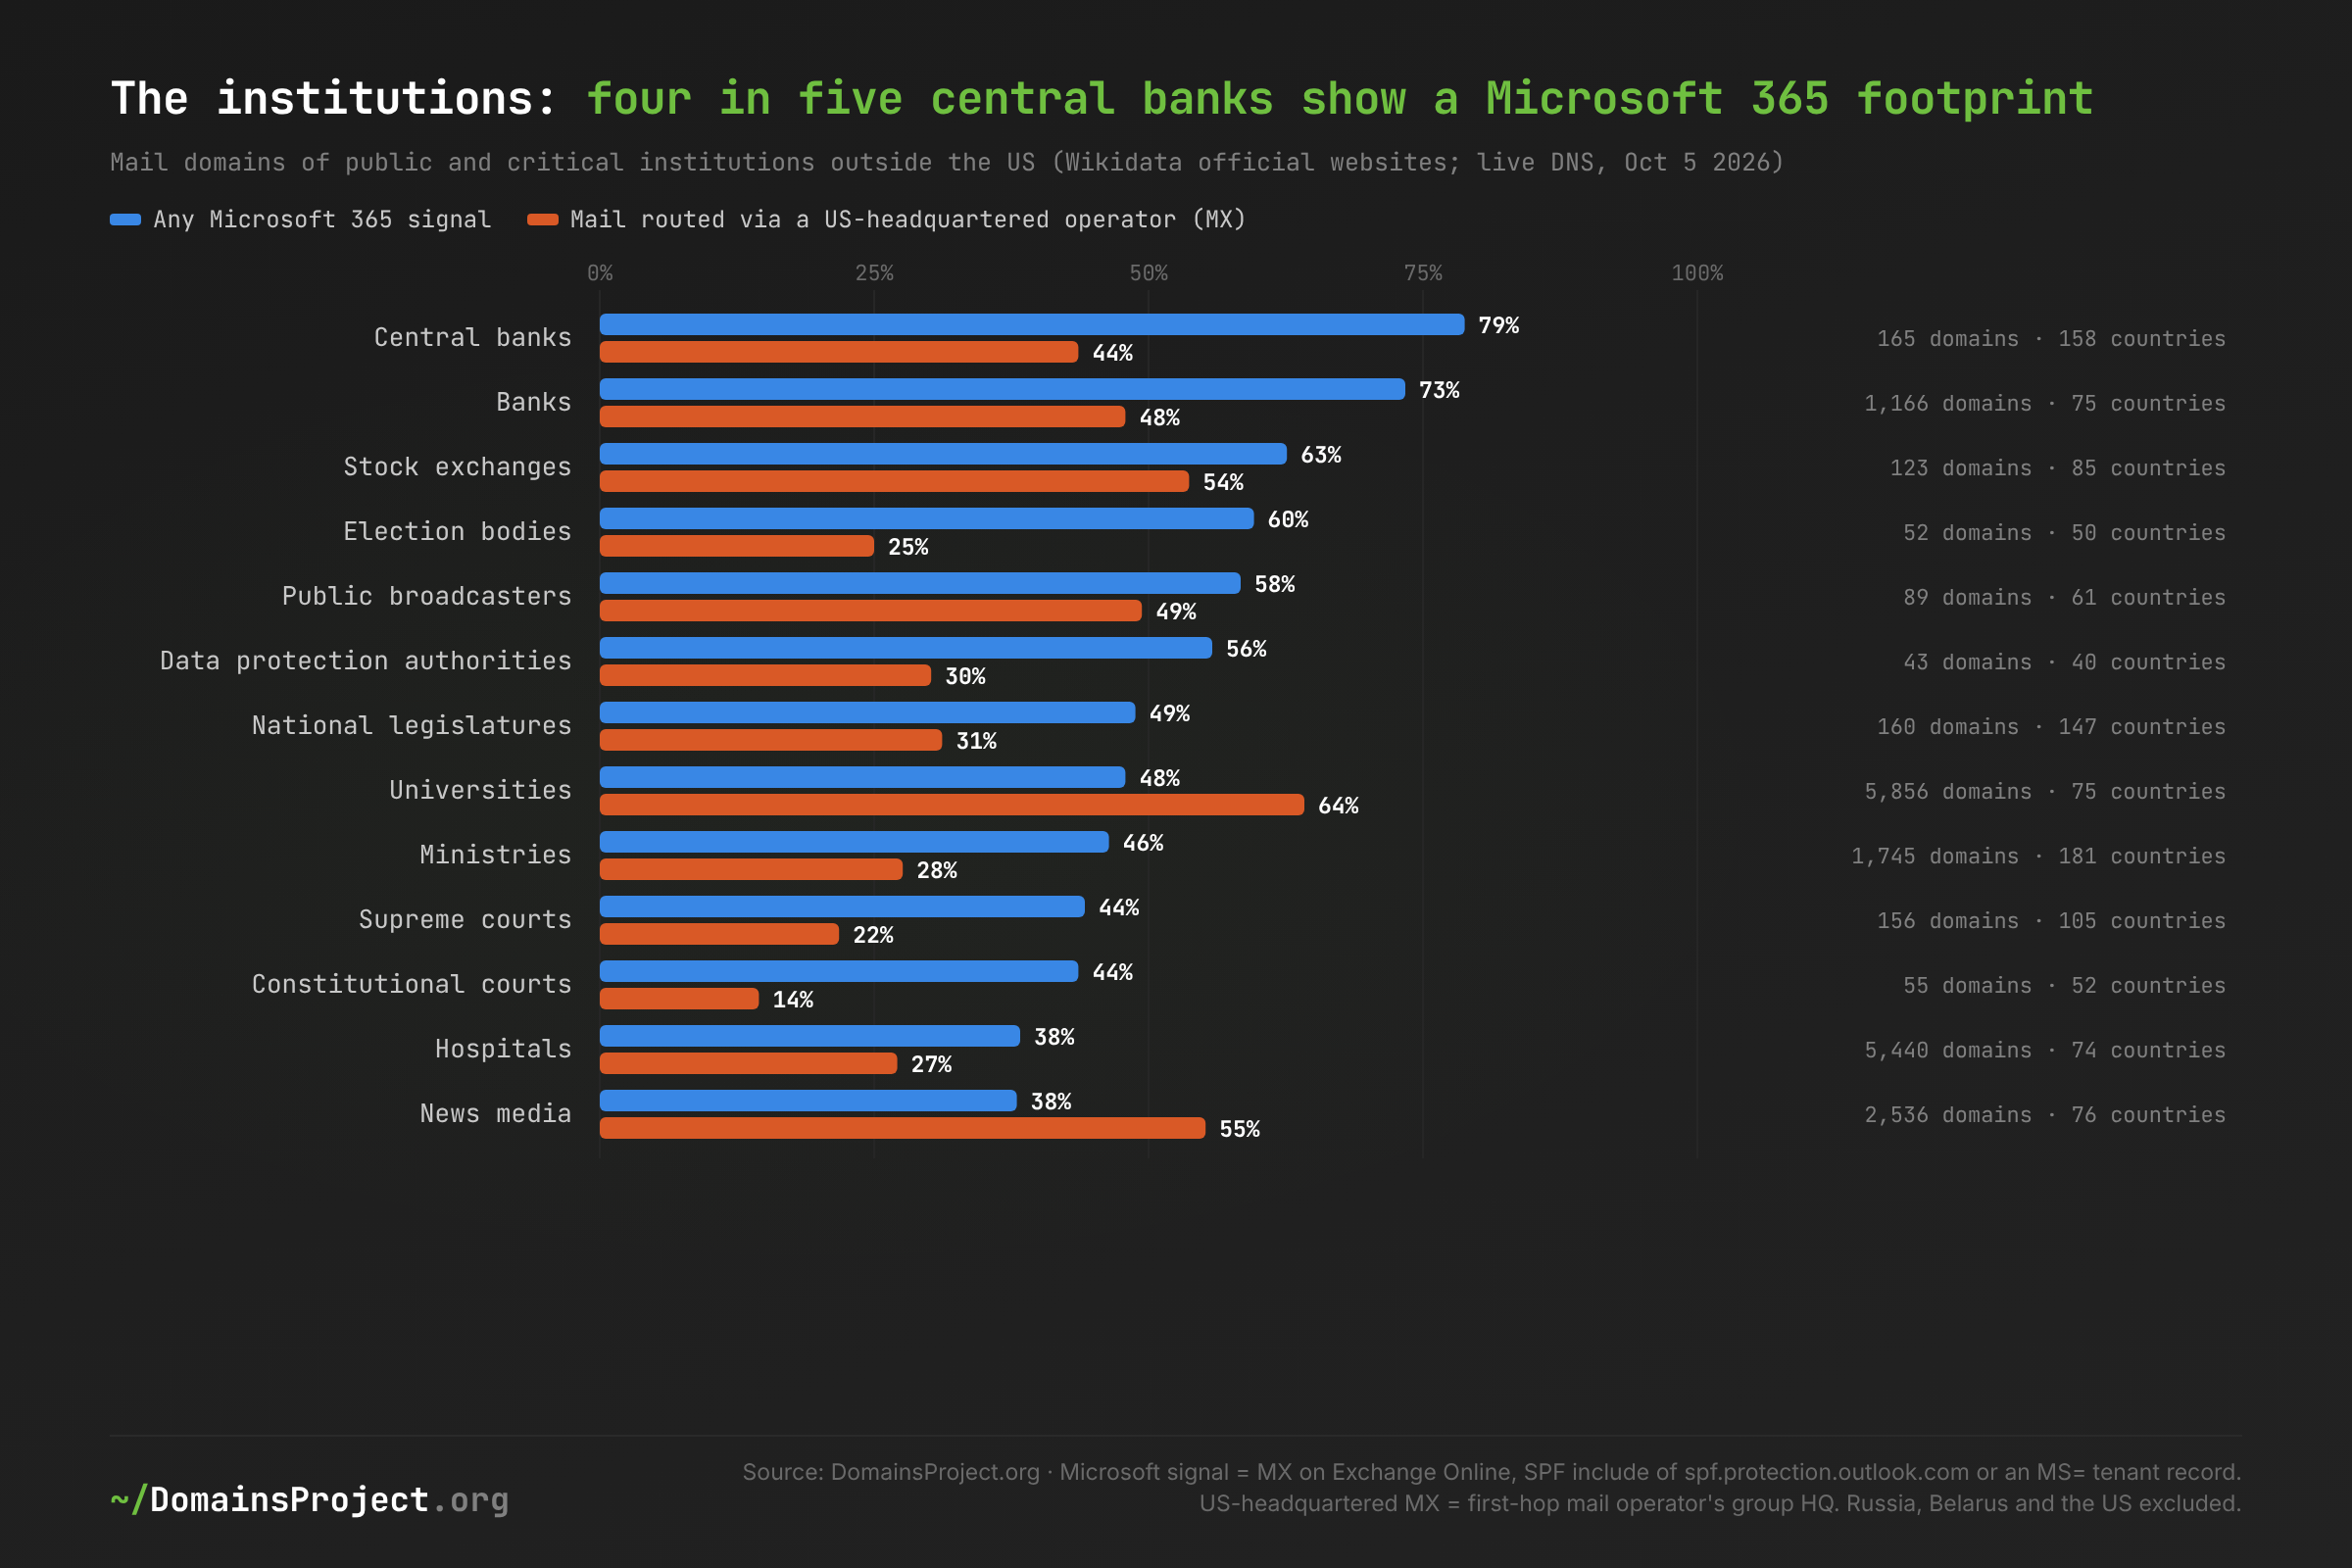
Download: usdep-institutions.csv — Wikidata official websites (national bodies only where the class mixes levels), live DNS October 5 2026; one row per distinct mail domain per country
Finance is the most Microsoft-dependent sector we measured. Nearly four in five central banks carry at least one Microsoft 365 signal. Most of them (44% of the total) keep self-hosted mail gateways in front, which is why mail-routing statistics alone miss them. Commercial banks follow at 73%. In the EU, banks have been subject since January 2025 to DORA, which regulates their dependence on critical ICT providers.
Data-protection authorities are no exception. 56% of the 43 national data-protection authorities we could test show a Microsoft 365 signal, and 30% route their mail through a US operator. That includes authorities that enforce the GDPR rules on transfers to the US.
Universities and newsrooms depend most on US operators for mail routing. Universities route 64% of their mail through US operators, and 44% show a Google Workspace signal. Newsrooms route 55% of their mail and 55% of their DNS through US operators, and 60% sit behind a front door on a US network. For journalists' sources, that front door is the layer that matters.
Government bodies by country
Ministries, central banks, legislatures, courts, election bodies and data-protection authorities pooled per country (countries with at least 10 such mail domains; samples are small, so read rows as indicative):
| Country | Gov mail domains | Any Microsoft 365 signal | MX on Microsoft | MX on a US-HQ operator | DNS on a US-HQ operator |
|---|---|---|---|---|---|
| New Zealand | 26 | 100% | 54% | 54% | 38% |
| Latvia | 20 | 100% | 55% | 55% | 25% |
| Singapore | 16 | 100% | 0% | 0% | 25% |
| Japan | 16 | 94% | 50% | 50% | 63% |
| Estonia | 15 | 93% | 0% | 0% | 0% |
| Brazil | 23 | 91% | 52% | 57% | 26% |
| Czechia | 21 | 90% | 33% | 33% | 0% |
| Canada | 12 | 83% | 50% | 67% | 25% |
| Chile | 25 | 80% | 52% | 80% | 32% |
| United Kingdom | 13 | 77% | 54% | 62% | 54% |
| Italy | 20 | 75% | 35% | 40% | 10% |
| Spain | 17 | 71% | 29% | 35% | 6% |
| Mexico | 16 | 69% | 31% | 38% | 13% |
| Austria | 19 | 63% | 0% | 0% | 0% |
| Denmark | 13 | 54% | 15% | 15% | 0% |
| France | 21 | 33% | 0% | 0% | 5% |
| Germany | 15 | 13% | 0% | 7% | 7% |
| India | 24 | 4% | 0% | 0% | 0% |
| South Korea | 26 | 0% | 0% | 0% | 0% |
Download: usdep-gov-by-country.csv
Three patterns stand out:
- Tenant without delivery: Estonia, Singapore and Austria show Microsoft tenants on most government domains while their MX points at government-run gateways. A verified tenant means the institution runs Microsoft cloud services under that domain: identity at a minimum, often Teams, SharePoint or mailboxes, even when mail first lands on a national gateway.
- Low Microsoft signals: France, Germany, India and South Korea, all countries with national rules or government clouds for public email.
- Ownership tests: France's SecNumCloud caps non-EU ownership of a qualified cloud at 24% (39% collectively). Canada's September 2026 sovereign-cloud call requires Canadian control up to the ultimate parent. Yet two-thirds of the Canadian federal mail domains in this sample route through a US-headquartered operator.
Blast Radius: One Company Is the Largest US Dependency Almost Everywhere
Cloudflare is the largest single US company in the national web of 70 of the 77 countries. We counted, for each website, every US company that appears in any layer: hosting network, anycast edge, mail or DNS.
| US company (any layer: web, edge, mail or DNS) | 77 pooled | Most exposed namespaces |
|---|---|---|
| Cloudflare | 15.5% | Nepal 43.6%, Azerbaijan 41.4%, Pakistan 36.9%, Albania 36.5%, Indonesia 36.2% |
| 7.8% | Thailand 27.4%, Australia 21.3%, Canada 20.0%, New Zealand 19.9%, Israel 19.1% | |
| Microsoft | 6.3% | Australia 21.7%, New Zealand 19.2%, Saudi Arabia 17.0%, Iceland 15.4%, Ireland 14.3% |
| Amazon | 6.1% | South Korea 20.6%, Argentina 18.6%, India 15.8%, Nepal 15.1%, Nigeria 12.5% |
| GoDaddy (incl. EU brands) | 3.5% | India 19.3%, Canada 13.3%, Australia 10.5%, Mexico 9.6%, United Kingdom 9.5% |
Share of live websites in the 77 namespaces with the company in at least one layer, September 2026. GoDaddy includes its European brands (Host Europe, domainFactory, 123 Reg, Heart Internet).
That concentration has already been tested:
- Cloudflare, November 18, 2025: an outage the company called its worst since 2019 took down proxied websites worldwide for hours. By our count, Cloudflare's edge fronts 13.0% of all live websites in the 77 namespaces, and more than 30% in Nepal, Azerbaijan, Pakistan, Albania and Indonesia.
- AWS us-east-1, October 19–20, 2025: the outage hit websites hosted directly in Northern Virginia, which are only 0.7% of the 77 namespaces (3.5–3.7% in Argentina and Uruguay). Its reach was far wider, because services built on that region failed too. Ookla counted 17 million outage reports from more than 60 countries (Ookla).
- Azure Front Door, October 29, 2025: it fronts only 0.03% of websites directly. Its impact came through Microsoft's own services, which carry the Microsoft 365 tenants of the institutions in the previous section.
Single-company exposure is a resilience problem as much as a sovereignty problem, and its fix is cheaper.
- DNS: a second DNS provider can answer for a zone at the same time.
- Mail: a second MX can queue mail during an outage.
- Web: a website can keep an origin that is reachable without its CDN.
None of that requires leaving.
The Legal Layer: What "US-Exposed" Means in October 2026
Every share in this post counts a technical fact: a server on US soil, or a US-headquartered operating group in the stack. What that fact means is a legal question, and the answer changed during 2025–2026. Four points matter for the recommendations below. Each is sourced; none is legal advice.
1. Where the data sits does not decide US reach.
- The rule: the CLOUD Act obliges US providers to disclose data in their "possession, custody, or control, regardless of whether such … information is located within or outside of the United States" (18 U.S.C. §2713).
- The only brake: a comity objection, available only to countries with a CLOUD Act executive agreement in force. Just two have one, the UK (since October 2022) and Australia (since January 2024) (DOJ). There is none with the EU or Canada.
- In the providers' own words: asked under oath in the French Senate in June 2025 whether he could guarantee that French data would never be handed over on a US injunction without French agreement, Microsoft France's director of public and legal affairs answered: "Non, je ne peux pas le garantir" (Sénat).
2. FISA Section 702 lapsed as a statute on June 12, 2026, but collection continues.
- The lapse: two short-term extensions ran out, and a third failed in the House 198–218 on June 11.
- Why collection continues: the court certifications approved in March 2026, and the directives issued to providers under them, remain valid until about March 2027 (CRS, June 22; Brennan Center, September 22).
- Weakened oversight: the Privacy and Civil Liberties Oversight Board has had one member and no quorum since the January 2025 removals. On July 31, 2026 the European Data Protection Board asked the Commission to assess what the Supreme Court's Trump v. Slaughter ruling means for the Data Privacy Framework (EDPB).
- The DPF itself: it remains in force, upheld by the EU General Court in Latombe (September 2025, curia) and now on appeal.
3. The service cut-offs that actually happened came from sanctions, not surveillance law.
- The mechanism: the International Emergency Economic Powers Act and Executive Order 14203 bar US persons from providing services to designated people.
- The ICC case: after the ICC Prosecutor's designation on February 13, 2025, his Microsoft-hosted mailbox was disconnected and he moved to a Swiss provider (AP, May 15, 2025, via PBS).
- Microsoft says it worked with the court on "the disconnection of its sanctioned official" and never stopped serving the ICC itself (Microsoft). It later corrected its own testimony to the UK Parliament about who pressed the switch (The Register).
- Since then: thirteen ICC officials have been designated (OFAC), and the court announced in October 2025 that it is moving to openDesk, the German government's open-source suite.
- Earlier precedents (Adobe in Venezuela in 2019, GitHub in Iran and Syria) were reversed only when Washington issued licences.
4. "Sovereign" offerings from US companies change residency, not ownership.
- AWS: the European Sovereign Cloud opened in Brandenburg on January 15, 2026, run by German subsidiaries, but its ultimate parent is Amazon.com, Inc. (Amazon).
- Microsoft: the EU Data Boundary documentation lists security data stored "primarily in the United States" (Microsoft Learn).
- France: SecNumCloud makes the point by rule. A qualified cloud may have at most 24% non-EU ownership per holder and 39% in total (ANSSI). That is why US hyperscalers enter the French state market only through joint ventures such as S3NS, qualified on December 17, 2025.
What this means for reading the numbers.
- Two different risks: a website on a US company's network in Frankfurt is exposed to US legal process; a website on a German company's server in Dallas is exposed to US physical jurisdiction. Neither, in practice, is a risk most website owners will ever meet.
- Why legal exposure still matters: it is concentrated where the consequences are largest — the institutions measured above — and it is the exposure that sanctions have actually exercised.
Physical risk is not only American. Drone strikes from March 1, 2026 damaged AWS facilities in the UAE and Bahrain. By September, AWS said that data held only in one UAE availability zone could not be restored (DCD; BleepingComputer). In-country hosting is not the same as safe hosting, which is why the recommendations below separate jurisdiction from redundancy.
Who Should Move — and Where
The data supports five different answers for five different situations. None of them is "everyone should leave the US". Each starts from the two questions this post separates:
- Distance: is the problem physical? The website sits on US soil, far from its readers.
- Law: is it legal? A US company holds data that US law, including sanctions, can reach.
1. Leave US soil if your readers are far from it (a no-regret move)
Who: websites with a non-US audience hosted in the US, in the 58 countries where the US round trip is more than 100 ms longer than a domestic or nearby alternative. That is 3.04 million websites in the 77 namespaces.
- Countries: most are in India, Brazil, Argentina, Chile, Nigeria, Pakistan, Sri Lanka, Kenya, Tanzania, Uruguay, Peru, the Gulf and Southeast Asia.
- Who hosts them: mostly US mass-market shared hosting (Namecheap, Bluehost/Unified Layer, GoDaddy, InMotion, Hivelocity), or the US data centres of non-US hosts. Hostinger alone hosts at least 581,000 of them.
Why it pays:
- Speed: a domestic or regional server cuts 100–240 ms from every round trip, which is noticeable on every page load and on mobile networks.
- Jurisdiction: it ends US physical jurisdiction over the server.
- Cost: for customers of Hostinger, IONOS or Contabo, it does not require a new provider, only a different data centre.
Where: domestic hosting first — in most of these countries RIPE Atlas anchors reach another domestic anchor in under 1–15 ms — then the regional hub with the lowest measured round trip (table below).
2. Switch cloud region if you are on a hyperscaler (cheap, partial)
Who: the 833,000 websites in the 77 namespaces served from a US region of AWS, Google Cloud, Azure or Oracle, of which 499,000 belong to countries 100 ms or more from the US.
- Mexico: 82% of hyperscaler-hosted
.mxwebsites use US regions although all three major hyperscalers now run regions in Querétaro. - Canada: 75% use US regions, with two Canadian regions per provider available.
What it fixes: latency and data residency. What it does not fix: jurisdiction. The provider is the same company.
3. Plan a move to non-US companies if you hold state, financial or sensitive personal data
Who: institutions for which a compelled disclosure or a sanctions cut-off would be a public matter.
- State: ministries, legislatures, courts and election bodies.
- Finance: central banks and financial supervisors.
- Regulators: data-protection authorities.
- Sensitive data: health records, defence, law firms handling privileged material, and newsrooms' source systems.
- International bodies: international organisations and NGOs whose mandate may conflict with US policy. The ICC precedent showed that sanctions, not surveillance law, are the mechanism that has actually cut service.
What we measured (signals of presence; they do not show what data a tenant holds):
- Microsoft 365 signals: 46% of ministries, 79% of central banks, 60% of election bodies and 56% of data-protection authorities outside the US carry one.
- US mail operators: 28%, 44%, 25% and 30% respectively route their mail through a US operator.
The order of difficulty matters more than the order of urgency:
- DNS is easy: add a non-US secondary provider, then make it primary.
- Web and CDN are moderate.
- Mail and productivity are hard, because the tenant holds identity, documents and collaboration. The ICC's move to openDesk, announced in October 2025, covers about 1,800 workstations.
Where: domestic or EU providers that are not only located but owned outside US reach.
- France's SecNumCloud is the strictest test available: non-EU ownership capped at 24% per holder and 39% in total. Its current list includes OVHcloud, Outscale, Cloud Temple and Numspot.
- The Commission's 2026 sovereign-cloud award gave its top "SEAL-3" grade to an OVHcloud consortium, STACKIT and Scaleway.
- Office suites: openDesk (Germany) and La Suite numérique (France) are the public-sector alternatives.
4. Diversify if one US company carries everything (resilience, not sovereignty)
Who: the 15.5% of websites in the 77 namespaces with Cloudflare in at least one layer, more than 30% in Nepal, Azerbaijan, Pakistan, Albania and Indonesia. More generally, every website whose web, mail and DNS all sit on one company.
What it fixes: the November 18, 2025 failure mode.
- A non-US secondary DNS provider.
- A backup MX.
- An origin server reachable without the CDN.
None of these requires leaving, and most cost little.
5. Probably stay
- Websites whose audience is in the US.
- Mexico, Central America and the Caribbean, physically.
- Why: from Mexico the Dallas hub is 28 ms away and from the Dominican Republic Miami is 18 ms. The nearest non-US hub abroad is farther than the US, and half of their regional traffic transits Florida anyway.
- What to do instead: a legal move to a domestic operator with domestic servers makes sense for institutions. A physical move abroad does not.
- Small websites on a free US edge. Losing Cloudflare's free DDoS protection is a real cost, and the legal exposure of a bakery's website is negligible.
- TLS certificates, for now.
- The alternatives are thin: with 97.9% issued by US authorities, Buypass out of the market and only Actalis offering free ACME among non-US CAs, there is no non-US alternative at scale.
- Why it matters less: a CA never holds the private key.
- What to do instead: keep ACME automation able to switch CAs quickly, because lifetimes are shrinking to 47 days.
Where to: the evidence by region
The table lists the hubs with the lowest measured round trip from each region's RIPE Atlas anchors (median across the region's countries) and the non-US companies that already carry the largest numbers of the region's websites, mail or DNS in our data. It lists what exists and is proven at scale, not an endorsement: suitability depends on contracts, certifications and the workload. The watch-outs are ownership and infrastructure traps from our research.
| Region | Nearest non-US hubs (median RTT) vs nearest US hub | Non-US providers already carrying the region (web · mail · DNS) | Watch-outs |
|---|---|---|---|
| EU members | Frankfurt 17 ms, Zurich 19, Vienna 20, Amsterdam 20 · New York 92 | Hetzner, IONOS, OVHcloud, Strato, Aruba, All-Inkl, one.com · mail and DNS the same hosts; independent mail: Infomaniak, Proton, Tuta, mailbox, Posteo; DNS: deSEC, Bunny DNS, ClouDNS, Netnod; CDN/DDoS: Bunny.net, Myra, Link11, CDN77 | Contabo is majority-owned by KKR. Host Europe, domainFactory and 123 Reg are GoDaddy. Hornetsecurity is Proofpoint, SpamExperts is N-able. ZeroSSL chains to Sectigo. SiteGround is Bulgarian but runs on Google Cloud. Fastmail stores data in the US by default. |
| Rest of Europe (UK, CH, NO, Balkans, TR) | Vienna 25 ms, Frankfurt 27, Warsaw 31 · New York 106 | IONOS, Hetzner, Hostpoint, 20i, Infomaniak, Hostinger; DNS: Domeneshop, Infomaniak | UK providers operate under the UK–US CLOUD Act agreement (in force since 2022), which lets providers answer the other country's orders directly. |
| South Asia | Mumbai 32 ms, Singapore 62, Kuala Lumpur 71, Dubai 73 · New York 211 | Hostinger (choose an Indian data centre where offered), Zoho (mail), Hetzner, OVHcloud | Public internet paths between Mumbai and Singapore can be slower than to London (WonderNetwork 151–155 ms), so test from your users' networks. |
| East and Southern Africa | Nairobi 20 ms, Johannesburg 52, Cape Town 69 · Northern Virginia 211 | Xneelo, Afrihost, Diamatrix, 1-Grid, Host Africa, Truehost; mail: Safaricom Business, Zoho | Teraco (Johannesburg, Cape Town) is majority-owned by Digital Realty (US). MainOne (Lagos, Accra) belongs to Equinix (US). |
| West Africa | Cape Town 60 ms, Johannesburg 76 from Nigerian anchors; Lagos 110 (poorly interconnected) · New York 176 | Host Africa, Truehost, Hostinger, OVHcloud; DNS: Whogohost, go54, Qservers | Nigeria's own hub was slower than South Africa from Nigerian anchors. Domestic peering, not hosting, is the bottleneck. |
| South America | Buenos Aires 30 ms, Santiago 32, São Paulo 43 · Miami 100 | Hostinger (choose a Brazilian data centre where offered), Locaweb, KingHost, Dattatec/DonWeb, Zam, Wirenet, Hosting.cl, Magalu Cloud; DNS: Registro.br for .br |
HostGator Brazil is Newfold (US). Ascenty is a Digital Realty joint venture, and Scala is DigitalBridge (now SoftBank). 48% of intra-regional paths transit the US anyway. |
| Mexico, Central America, Caribbean | Domestic first (Mexico 26 ms in-country); Toronto 61, Querétaro 71 between the two · Miami 38, Dallas 40 | Hostinger, IONOS, KIO Networks, Triara (Telmex); Querétaro hyperscaler regions | Neubox, Mexico's largest US-soil host, keeps servers in Dallas. A non-US hub abroad is farther than the US. |
| Gulf | Domestic first; Riyadh/Jeddah 53 ms and Dubai 79 between the two; Milan 88 · New York 165 | e& (Etisalat), Sahara Net; Hostinger, Hetzner; DNS: Etisalat, Tasjeel | Flagship "sovereign" stacks (G42/Core42) run on Azure. The 2026 drone strikes destroyed data held in one UAE availability zone. |
| East & Southeast Asia | Singapore 31 ms, Kuala Lumpur 33, Jakarta 41, Hong Kong 41 · Seattle 147 | Sakura, GMO, Xserver (JP); Cafe24 (KR); Exabytes, Shinjiru (MY); Rumahweb (ID); CS Loxinfo (TH) | Chinese clouds swap US for PRC jurisdiction (National Intelligence Law, Art. 7). ST Telemedia GDC (Singapore) has been 75% KKR-owned since August 2026. |
| Oceania | Sydney 13 ms, Auckland 13 · Los Angeles 139 | Synergy Wholesale, Dreamscape/Crazy Domains, Voyager, SiteTech; government: AUCyber, Macquarie, Vault | AirTrunk is Blackstone-owned. Australian providers operate under the Australia–US CLOUD Act agreement (in force since January 2024). |
Download: usdep-where.csv — hub RTTs are medians over the region's countries with RIPE Atlas anchors (anchoring mesh, October 5, 2026); providers from the September 2026 per-domain join (largest non-US operators by websites, mail and DNS); ownership notes from company filings and primary sources
Two rules make the table usable:
- Check where, not just who. A non-US host can still put you in Dallas or Virginia: Hostinger, IONOS and Contabo all run US data centres.
- Check who owns the building. Several "local" brands are US-owned:
- Teraco (Digital Realty), MainOne (Equinix) and Contabo (KKR).
- The flagship sovereign stacks in the Gulf, which are tied to US firms by ownership and platform.
Ownership tests like France's and Canada's exist for that reason.
How These Numbers Compare
| Our measurement | External comparator | Agreement |
|---|---|---|
| 97.9% of sampled HTTPS sites use US-headquartered CAs; Let's Encrypt 72.9% | W3Techs, October 5, 2026: Let's Encrypt 67.4% of websites with a known CA | Consistent. Our sample includes the long tail of small websites, where free certificates dominate. |
| Hyperscaler-hosted websites: AWS 1.72 million, Google 1.09 million, Azure 0.27 million | Synergy Research, Q2 2026 cloud infrastructure revenue: Amazon 28%, Microsoft 20%, Google 15% | Different units (websites vs revenue). Azure's small website share fits its enterprise, non-web workload mix. |
| Mail and DNS US shares rose in most countries | Home Advantage Index (October 3): US-headquartered operators gained mail share in 76 of 78 and DNS in 74 of 78 | Same data family; the per-domain flows here are the stricter test. |
| Canada: 81.2% US-exposed, 54.6% all-US | Is Your .ca Website Actually Canadian?: 81.2% and 54.6% | Identical method; this post extends it to 77 countries. |
| Latin American routing: 47.8% of regional paths via the US | WonderNetwork: Buenos Aires–Miami 134 ms vs Buenos Aires–São Paulo 30 ms; Bogotá–Miami 58 ms | Consistent with direct Southern Cone interconnection and Florida-centric routing further north. |
Where we diverge from common claims:
- Physical US hosting is not growing. The share of live websites on US soil fell in 65 of 77 countries since 2023. What grows is US companies operating locally.
- "European sovereignty" has not yet shown up in European namespaces. EU members' domains moved mail toward US operators 3.1 times as often as away.
What's at Stake
- Nearly four in five central banks outside the US carry a Microsoft 365 footprint — and sanctions, not surveillance law, are the mechanism that has actually cut institutions off from US services.
- 97.9% of TLS certificates come from US-headquartered CAs — and certificate lifetimes fall to 47 days by 2029, so a loss of issuance would be felt within weeks.
- Cloudflare is the largest US dependency in 70 of 77 countries — and its November 2025 outage showed what a single company's failure does to national webs at once.
- 3.04 million websites pay more than 100 ms per round trip to be hosted in the US — and a million US-hosted websites in these namespaces sit in the American data centres of non-US hosts.
- Half of Latin America's regional traffic detours through Florida — so a fully domestic hosting stack in Lima or Tegucigalpa often reaches its neighbours through US routers.
- The switching runs toward the US at 2–3 to 1 — so policies aimed at "leaving" are working against the market's direction, not with it.
What Would Help
1. Hosting customers outside the Americas: check where your server is, not just who your host is. Hostinger, IONOS, Contabo and others run US data centres. For the 3 million websites hosted in the US with distant audiences, moving to a domestic or regional data centre of the same provider is the cheapest performance and sovereignty gain available.
2. Governments and central banks: separate the three moves.
- Region: choosing a domestic region is a residency decision.
- Provider: choosing a non-US operator is a jurisdiction decision.
- Tenant: moving the productivity tenant is the hard one, and the one that matters for sanctions risk.
Measure all three, publish the inventory, and start with DNS and mail routing, which are cheap to diversify.
3. Registries: publish who operates your nameservers, and keep one secondary outside any single country. 56 of 78 national registries in this panel use a US operator for at least one nameserver, usually PCH, a non-profit, which is a resilience asset. For the 18 ccTLDs that are entirely US-operated, including .io, .ai and .me, a published contingency plan would tell registrants what happens if that operator becomes unavailable.
4. Regional networks in Latin America and West Africa: interconnect locally. Half of intra-Latin-American paths cross the US, and Nigerian anchors reached Cape Town (60 ms) faster than the anchors at Lagos's exchange (110 ms). Local exchange points and direct regional peering would cut latency and reduce routing dependence without anyone changing hosting provider.
5. Hosting providers and CAs outside the US: compete on the layers where there is no alternative. Free automated certificates, free secondary DNS and free DDoS protection are what pull customers to US companies. The flows show that bundled European services lose to free US ones even in the countries debating sovereignty most loudly.
Methodology:
- Hosting: per-domain join of hosting location and ownership, MX and NS for 65.5 million live websites in 77 national namespaces (September 17, 2026 crawl), plus
.euand a 1-in-10.com/.net/.orgsample. - Flows: mail and DNS switching from April 10, 2025 to September 2026.
- Fieldwork, October 5, 2026: 3,088 RIPE Atlas traceroutes, the RIPE Atlas anchor ping mesh, 756 Globalping CDN requests, 31,200 TLS handshakes, the nameservers of 242 ccTLDs, and live DNS for 25,651 institutions from Wikidata.
- Attribution: operator attribution follows the Home Advantage Index, with the corrections listed in the Methodology.
- Exclusions: Russian-territorial TLDs, Russian providers and institutions in Russia and Belarus are excluded.
- Further reading: the Canada post applies the same per-domain method to one country in depth. Live TLD statistics are on the stats dashboard; the underlying domain data is described on the dataset page.*