In July we published The News Cycle Has a Domain Footprint, a study of the lookalike domains that follow trending events. It ended with advice for detection teams: gate brand watchlists on activation, not registration. Keep the new domains that resolve and have a live mail server; drop the ones sitting on parking nameservers. It also made a prediction: the domains provisioning MX records and Cloudflare fronting that week were "the candidates for next month's feed."
A reader answered with the obvious objection: test whether those activation signals actually predict later malicious activity. The post asserted the link; it never measured it. Its one external check found none of 843 lookalikes in the public phishing feeds and read that as "activation precedes weaponization", which was an interpretation, not a finding. As the corrected version of that post now explains, even the null was wrong: two of the 843 had already been listed and dropped out of the feed before we looked.
Activation-first triage is an attractive idea because it promises to shrink an unmanageable stream of new domains to the few that are armed. Whether it works is an empirical question, and answering it needs three things the July post did not have: listing dates for every domain, a population large enough for listings to be more than anecdotes, and posture measured before the listing rather than after it. It also needs to keep apart three things the July post ran together: when a domain was first observed, how its DNS was activated, and whether it was weaponized, which no DNS dataset sees and a public feed records only as a later listing.
This post supplies all three data requirements. We replayed the complete history of the OpenPhish public feed and collected every URLhaus entry we could date, then matched both against our Newly Observed Hostnames (NOH) feed and our monthly DNS crawls. The core test follows 29.2 million registered domains that NOH first observed between May and July 2026, classifies each by its DNS activation state, or posture, at a later crawl (web, mail, nameservers, parking), and counts which ones were listed afterwards. A retrospective arm measures how far ahead NOH saw the domains OpenPhish listed, and a prospective arm follows the 857 July lookalikes through nine weekly probes.
The mail-server signal failed. Among domains still unlisted at the crawl, a live MX was associated with a lower chance of a later listing than a plain resolving domain without mail (0.48× in the largest cohort), and the MX-plus-Cloudflare domains we singled out in July were listed at half the rate of everything else. Parking was the signal that held: parked domains were listed at 3–9% of the average rate. Self-hosted mail was the one mail signal that pointed up. And most listings arrived within days of first observation: 84% came before the monthly crawl measured posture at all. Our feed does carry lead time, but for registered domains, not free-hosting sites.
The Data
| Source | Stage | What it contributes | Window | Size |
|---|---|---|---|---|
| Newly Observed Hostnames (NOH) daily deltas | Observation | First observation date of every registered domain | Dec 24, 2024 – Sep 27, 2026 (641 daily files; 2 days missing) | 250.2M registered domains |
| OpenPhish public feed, full git history | Discovery | Listing time of every URL in the public feed, 12-hour resolution since June 2025 | Oct 2024 – Sep 2026 | 98,083 registered domains ever listed |
| URLhaus daily recent-feed snapshots + public CSV dump | Discovery | Malware-distribution URLs with date added | Complete Jun 24 – Sep 27, 2026; partial before | 2,473 registered domains |
| Monthly typed DNS crawls (web, MX, NS) | Activation | Posture of each domain on a known date | June (Jun 12–18), July (Jul 8–13), August (Aug 15–20, no NS) | 12.0M / 19.0M / 10.2M cohort domains matched |
Weekly dig probes of the July lookalikes |
Activation | Posture lifecycle, week by week | Jul 24 – Sep 24, 2026 (10 probes) | 857 domains |
Every outcome in this post is an entry in a public feed that someone other than us maintains. The posture and first-observation data are ours. We reduce every hostname to its registered domain using the ICANN section of the Public Suffix List, so a phishing page at login.example-shop.com counts against example-shop.com, and a page at x.vercel.app rolls up to vercel.app, which is never a new domain. Russian-territorial TLDs (.ru, .su, .moscow, and the two Cyrillic IDN suffixes) are excluded by policy, and .ph is excluded because its registry answers every query.
Observation, Activation, Weaponization: What DNS Data Can See
The July post used activation for several different DNS states (resolving, accepting mail, delegated to Cloudflare, not parked) and treated a feed listing as evidence of weaponization. This post keeps those concepts apart. On its way to a listing, a new domain passes through six stages, and our data sees only some of them.
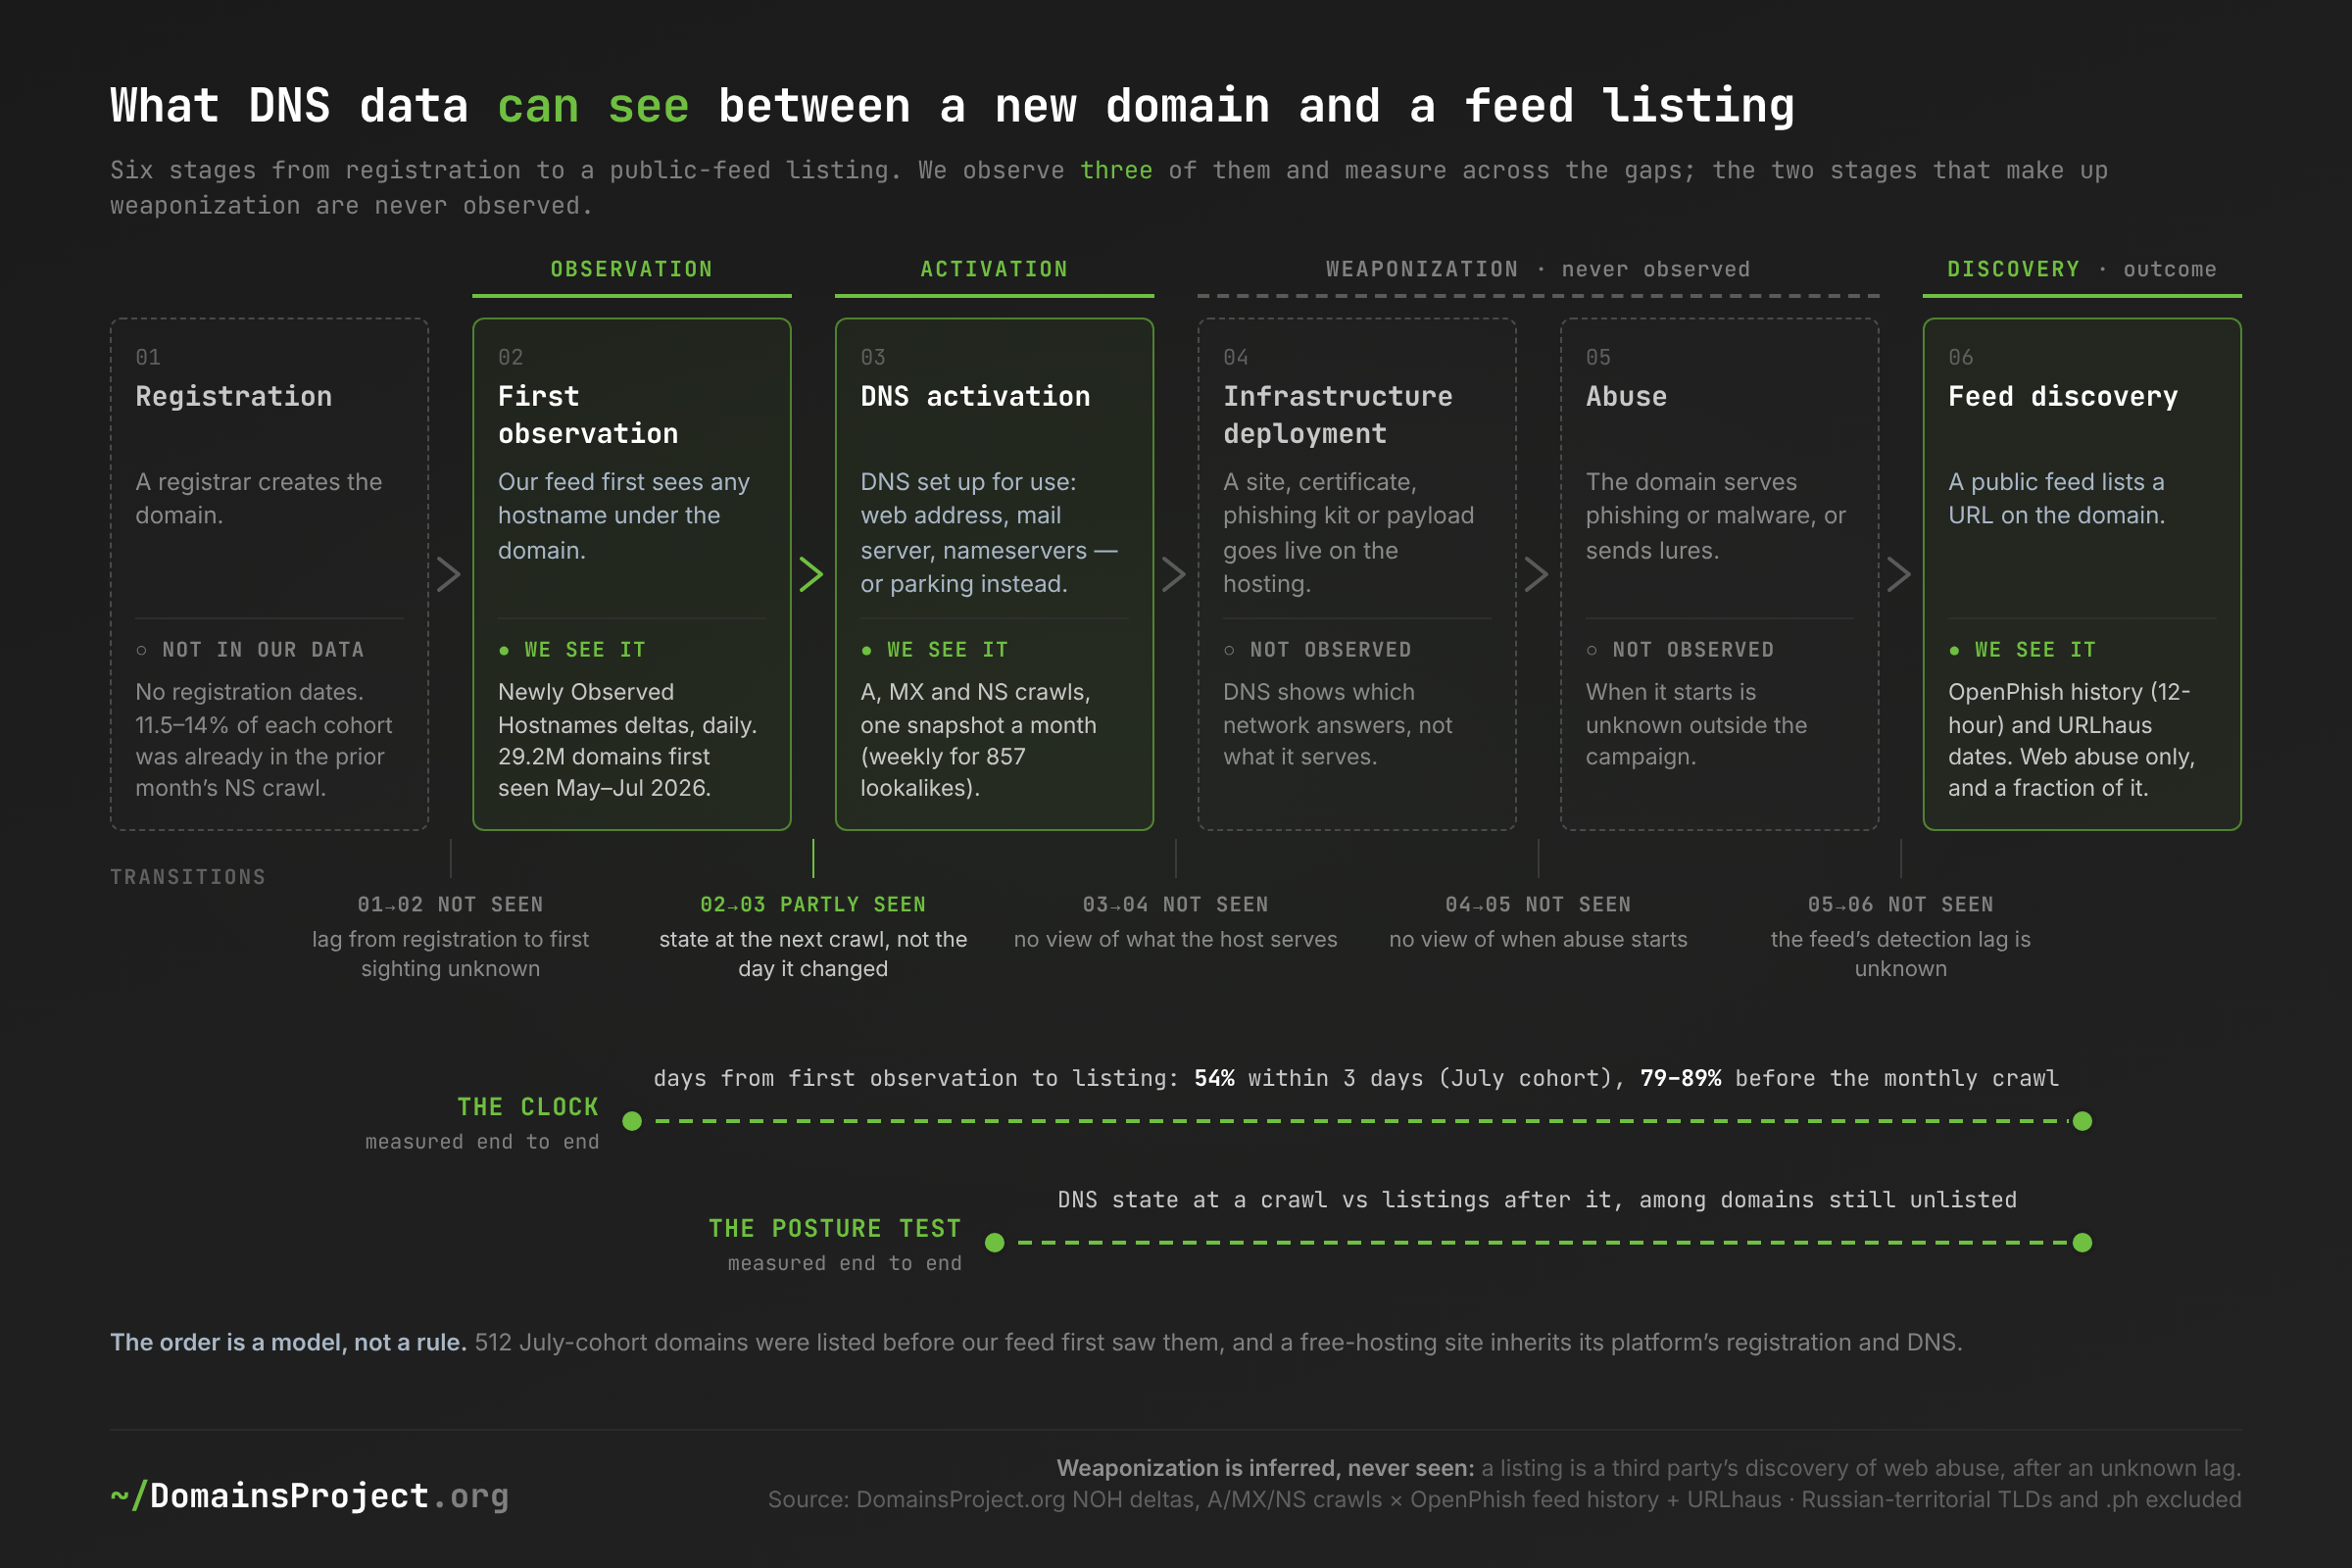
Download: activation-lifecycle.csv · stage and transition definitions, the data source and time resolution for each observed stage, and the two end-to-end measurements.
- Observation is the day our NOH feed first sees a hostname under the domain. It is an event with a date and says nothing about the domain's configuration or intent. It is also not registration: we have no registration dates, and 11.5–14.0% of each cohort was already in the previous month's nameserver crawl.
- Activation is how the domain's DNS is set up: where it delegates, whether it has a web address, whether it accepts mail, and whether it points at a parking operator. We record it as a posture class at one crawl. It is not a single signal, so the post tests its parts separately. Parking is a DNS configuration too, but one that holds a name for resale rather than using it.
- Weaponization covers two stages: infrastructure deployment (a site, certificate, phishing kit, or payload goes live on the hosting) and abuse (the domain serves phishing or malware, or sends lures). DNS data never shows either. A record says which network answers, not what that network serves.
- Discovery is a public feed listing a URL on the domain. It is the only outcome we have, and a narrow proxy for weaponization: web abuse only, recorded after an unknown lag, by feeds that see a fraction of it.
We observe one transition directly, and only partly. From observation to activation, we see the state at the next crawl but not the day it changed. Everything else in this post connects two observed endpoints across the unobserved middle. The clock measures the time from observation to discovery, and the posture test measures the association between activation state at a crawl and discovery after it. Neither can say when a domain was weaponized. The question this post can answer is therefore narrower than the July post's: whether DNS posture predicts a later public-feed listing, not whether activation predicts weaponization.
The order is a model, not a rule. 512 domains in the July cohort were listed before NOH first saw them, so discovery can precede observation. A free-hosting site has no registration or DNS of its own; it inherits its platform's, so the first and third stages do not apply to it, and our feed had seen only 1.3% of such sites by their listing day (see the retrospective arm below).
Methodology
Classification labels. Every term used below is defined here.
- Newly observed (first observation): the first day any hostname under a registered domain appeared in our NOH deltas. The archive starts December 24, 2024, so a domain counts as newly observed in, say, June 2026 only if none of its hostnames had appeared in the preceding eighteen months. NOH is a DNS-visibility signal, not a WHOIS registration date: some newly observed domains are older names our crawler reached for the first time. We measure how many below.
- Registered domain vs free-hosting site: a registered domain is an ICANN eTLD+1 (
example.com,example.co.uk). A free-hosting site is a name directly under a suffix in the private section of the Public Suffix List (name.vercel.app,name.blogspot.com,name.pages.dev) and is only used in the retrospective arm. - Listed: the domain's first appearance in the OpenPhish public feed or URLhaus, at any URL whose host rolls up to it. We say listed or feed-listed, never malicious or weaponized: a listing is a discovery, a public feed sees a fraction of abuse, and its absence proves nothing.
- Posture classes (the activation state recorded at one crawl, assigned in this priority order from the crawl nearest the cohort):
- Not crawled: absent from all three crawl tables (web, MX, NS).
- Parked: the web address belongs to a known parking or for-sale lander, or the nameservers belong to a parking or marketplace operator (Afternic, Sedo, Bodis, Above, DAN, HugeDomains, CashParking and peers), or the MX points to a parking catch-all.
- Live MX: a mail exchanger that is not a null MX (RFC 7505). Self-hosted MX is the subset whose mail host sits under the domain itself (
mail.example.comforexample.com), the default on cPanel-style shared hosting. Third-party MX is everything else: Google, Microsoft, registrar and hosting-company mail, forwarders. - Resolving, no MX: has a web address, no live mail server.
- Dark: crawled, no web address, no mail server.
- Cohort, prevalent, and risk set: a cohort is every registered domain first observed in a window. Domains listed before their cohort's posture crawl finished are prevalent: their posture was measured after the fact, so they are removed from the risk set and reported separately. The test asks whether posture predicts listings that happen after it is measured.
- Lift and risk ratio: lift is a group's later-listing rate divided by its cohort's overall rate. Risk ratios compare two groups and are Mantel–Haenszel adjusted, stratified by TLD group (
.com, cheap promotional gTLDs, other gTLDs, ccTLDs), month of first observation, and whether the domain already appeared in the previous month's NS crawl. Intervals are 95% (Greenland–Robins for risk ratios, exact Clopper–Pearson for rates).
The three cohorts. The same design runs three times, at three crawl dates:
| Cohort | First observed | Posture crawl | Outcome window | Domains |
|---|---|---|---|---|
| June | May 1 – Jun 8, 2026 | Jun 12–18 | Jun 19 – Sep 27 (101 days) | 11,958,008 |
| July | May 1 – Jun 30, 2026 | Jul 8–13 | Jul 14 – Sep 27 (76 days) | 18,972,280 |
| August | Jul 1 – Jul 31, 2026 | Aug 15–20 (web and MX only) | Aug 21 – Sep 27 (38 days) | 10,221,380 |
The June cohort is a subset of the July cohort measured a month earlier, which tests whether an earlier snapshot changes the answer. The August cohort is disjoint and serves as the replication. Together the July and August cohorts cover 29.2 million distinct domains.
Dataset scope. Web posture comes from our monthly A-record crawl classified against a registry of parking and hosting front-door addresses (the classification behind The Parking Lot); MX and NS posture come from the typed crawls behind our MX and nameserver studies. The web crawl records only successful answers, so "no web address" means no answer or not queried; the MX and NS crawls record negatives too. OpenPhish listing times come from replaying every commit of the public feed's GitHub repository. The feed was updated at irregular intervals of minutes to hours until June 2, 2025, and every 12 hours (00:00 and 12:00 UTC) since, so listing times have 12-hour resolution for almost the whole analysis window. URLhaus dates come from the feed's own dateadded field.
Known limitations.
- Left truncation. The risk sets contain only domains still unlisted when posture was measured. That is the operational question for anyone who gates on observed posture, but it is not the risk at registration, and 79–89% of each cohort's listings happened before its crawl. Measuring posture a month earlier (the June cohort) barely changed the results.
- Web-only outcomes. OpenPhish and URLhaus list phishing pages and malware-distribution URLs. They cannot see a domain used only for sending email lures or business-email compromise. "A live MX does not predict a feed listing" is therefore narrower than "a live MX does not matter".
- One snapshot. Posture can change during the outcome window. In our weekly probes of the 857 lookalikes, 14.5% changed at least one of web, mail, or nameserver state over nine weeks.
- Survivorship. Hosts that take abusive sites down quickly may push their customers into the prevalent group, lowering their apparent risk among survivors. We cannot separate this from lower underlying risk for Cloudflare in particular.
- Feed recall. The OpenPhish public feed is a rotating list of about 300 URLs, replaced every 12 hours, and a small fraction of OpenPhish's full data. URLhaus coverage before June 24, 2026 is partial, which affects the prevalent counts and the first five days of the June cohort's outcome window. The August cohort has no NS tuples. "Not crawled" and "dark" include transient query failures.
- Proxy looseness. 11.5–14.0% of each cohort was already present in the previous month's NS crawl, so for those domains NOH's first observation is not a new registration. Every result below holds when they are removed.
Dataset vs external counts. Interisle Consulting's Phishing Landscape 2025, built from APWG, OpenPhish, PhishTank and Spamhaus data, found that 77% of domains reported for phishing were maliciously registered and that 13% of phishing attacks used subdomain providers. The OpenPhish public feed skews much further toward free hosting: from April 2025 to September 2026 it listed 52,099 free-hosting sites against 62,752 registered domains, so free-hosting sites were 45% of its listed names (a different unit from Interisle's attacks, but a large gap). Our listing rates are also far below classifier-based estimates such as Palo Alto Networks Unit 42's finding that over 70% of newly registered domains are marked malicious, suspicious, or not safe for work. A public-feed listing is a much narrower event than a classifier verdict, which is why every rate in this post is small.
Reproducibility. Every chart links its CSV. The full risk-ratio table for all three cohorts, including the crude and adjusted estimates, is in activation-risk-ratios.csv, and the quarterly lead-time series is in activation-noh-lead-quarterly.csv. Replicating the outcome side needs only the public OpenPhish repository and URLhaus; the posture side needs daily new-domain observations and monthly A, MX, and NS crawls.
The Scorecard
| June cohort | July cohort | August cohort | |
|---|---|---|---|
| Domains first observed | 11,958,008 | 18,972,280 | 10,221,380 |
| Already in the previous NS crawl | 12.0% | 11.5% | 14.0% |
| Listed before the posture crawl (prevalent) | 3,781 | 5,706 | 1,481 |
| Median days from first observation to those listings | 1 | 2 | 2 |
| Listed after the posture crawl | 1,013 | 1,076 | 185 |
| Rate after the crawl, per 10,000 domains | 0.85 | 0.57 | 0.18 |
The prevalent row is the first finding. In every cohort, most of the domains that were ever listed were listed before a monthly crawl could record their posture, a median of one to two days after we first observed them. The later listings, the ones a posture rule could have anticipated, are the minority, and they are rare: under one per 10,000 domains in each window.
What predicted a later listing
| Comparison (adjusted risk ratio, 95% CI) | June cohort | July cohort | August cohort |
|---|---|---|---|
| Parked vs every other crawled domain | 0.08 (0.05–0.13) | 0.07 (0.04–0.11) | 0.02 (0.00–0.16) |
| Live MX vs resolving without MX | 0.72 (0.60–0.86) | 0.48 (0.40–0.57) | 0.95 (0.69–1.32) |
| Live MX vs dark | 1.14 (0.67–1.94) | 0.95 (0.58–1.57) | 0.35 (0.18–0.67) |
| Live MX vs dark or parked | 5.64 (3.84–8.28) | 4.52 (3.12–6.55) | 3.36 (1.84–6.15) |
| Live MX + Cloudflare NS vs everything else crawled | 0.46 (0.31–0.69) | 0.51 (0.36–0.75) | no NS data |
| Cloudflare NS vs other non-parked NS | 0.70 (0.61–0.81) | 0.75 (0.66–0.86) | no NS data |
| Self-hosted MX vs third-party MX | 7.68 (5.62–10.48) | 6.55 (4.80–8.95) | 4.76 (3.13–7.23) |
| Self-hosted MX vs resolving without MX | 2.29 (1.88–2.78) | 1.33 (1.09–1.61) | 2.95 (2.05–4.23) |
Read the fourth row against the second. "Live MX vs dark or parked" is the comparison the July advice implicitly made, and it looks like a strong signal: mail-capable domains were listed three to six times as often. But the effect comes from the reference group, not from the mail server. Parked domains are almost never listed, so anything beats them. Against the domains that matter, those that resolve and are not parked, a live MX was neutral in the August cohort and associated with lower risk in the June and July cohorts. The same holds with the domains already present in the previous crawl removed (July: 0.50, 0.41–0.60).
The Feed That Forgets: Why One Snapshot Is Not a Check
The OpenPhish public feed is a 12-hour window, and a daily look misses a large part of it. Replaying the feed's history for URLs first listed between July 24 and September 25, 2026, the median URL stayed in the feed for exactly one 12-hour cycle, and 92.3% were gone within 24 hours. Our own collection took one snapshot a day at 13:30 UTC, which always lands in the 12:00 cycle. It caught 59.3% of the 30,712 URLs listed in that period and 64.8% of the 16,014 registered domains and free-hosting sites behind them. The rest appeared and disappeared between our looks.
That is how the July post's null happened. It checked 843 lookalikes against a single snapshot of each feed and found nothing. In the replayed history, b-instagram.com.cn was listed on June 4, two days after we first observed it, and meta-instagram.com.cn on June 11, also two days after first observation. Both had rotated out by July 23, and by July 24 neither resolved. For those two domains the listing came within days, and the domains were gone before a point-in-time check could see them. The July post now carries a correction.
The implication is methodological before it is operational: any study, product claim, or SOC workflow that tests "is this domain in the feed?" against the feed's current contents is measuring the feed's rotation schedule as much as the domain. Feed membership has to be checked against feed history.
Lead Time: Real for Registered Domains, Absent for Free Hosting
The retrospective arm turns the July post's check around: instead of asking whether our lookalikes reached the feeds, it takes everything the feeds listed and asks when our NOH feed first observed it.
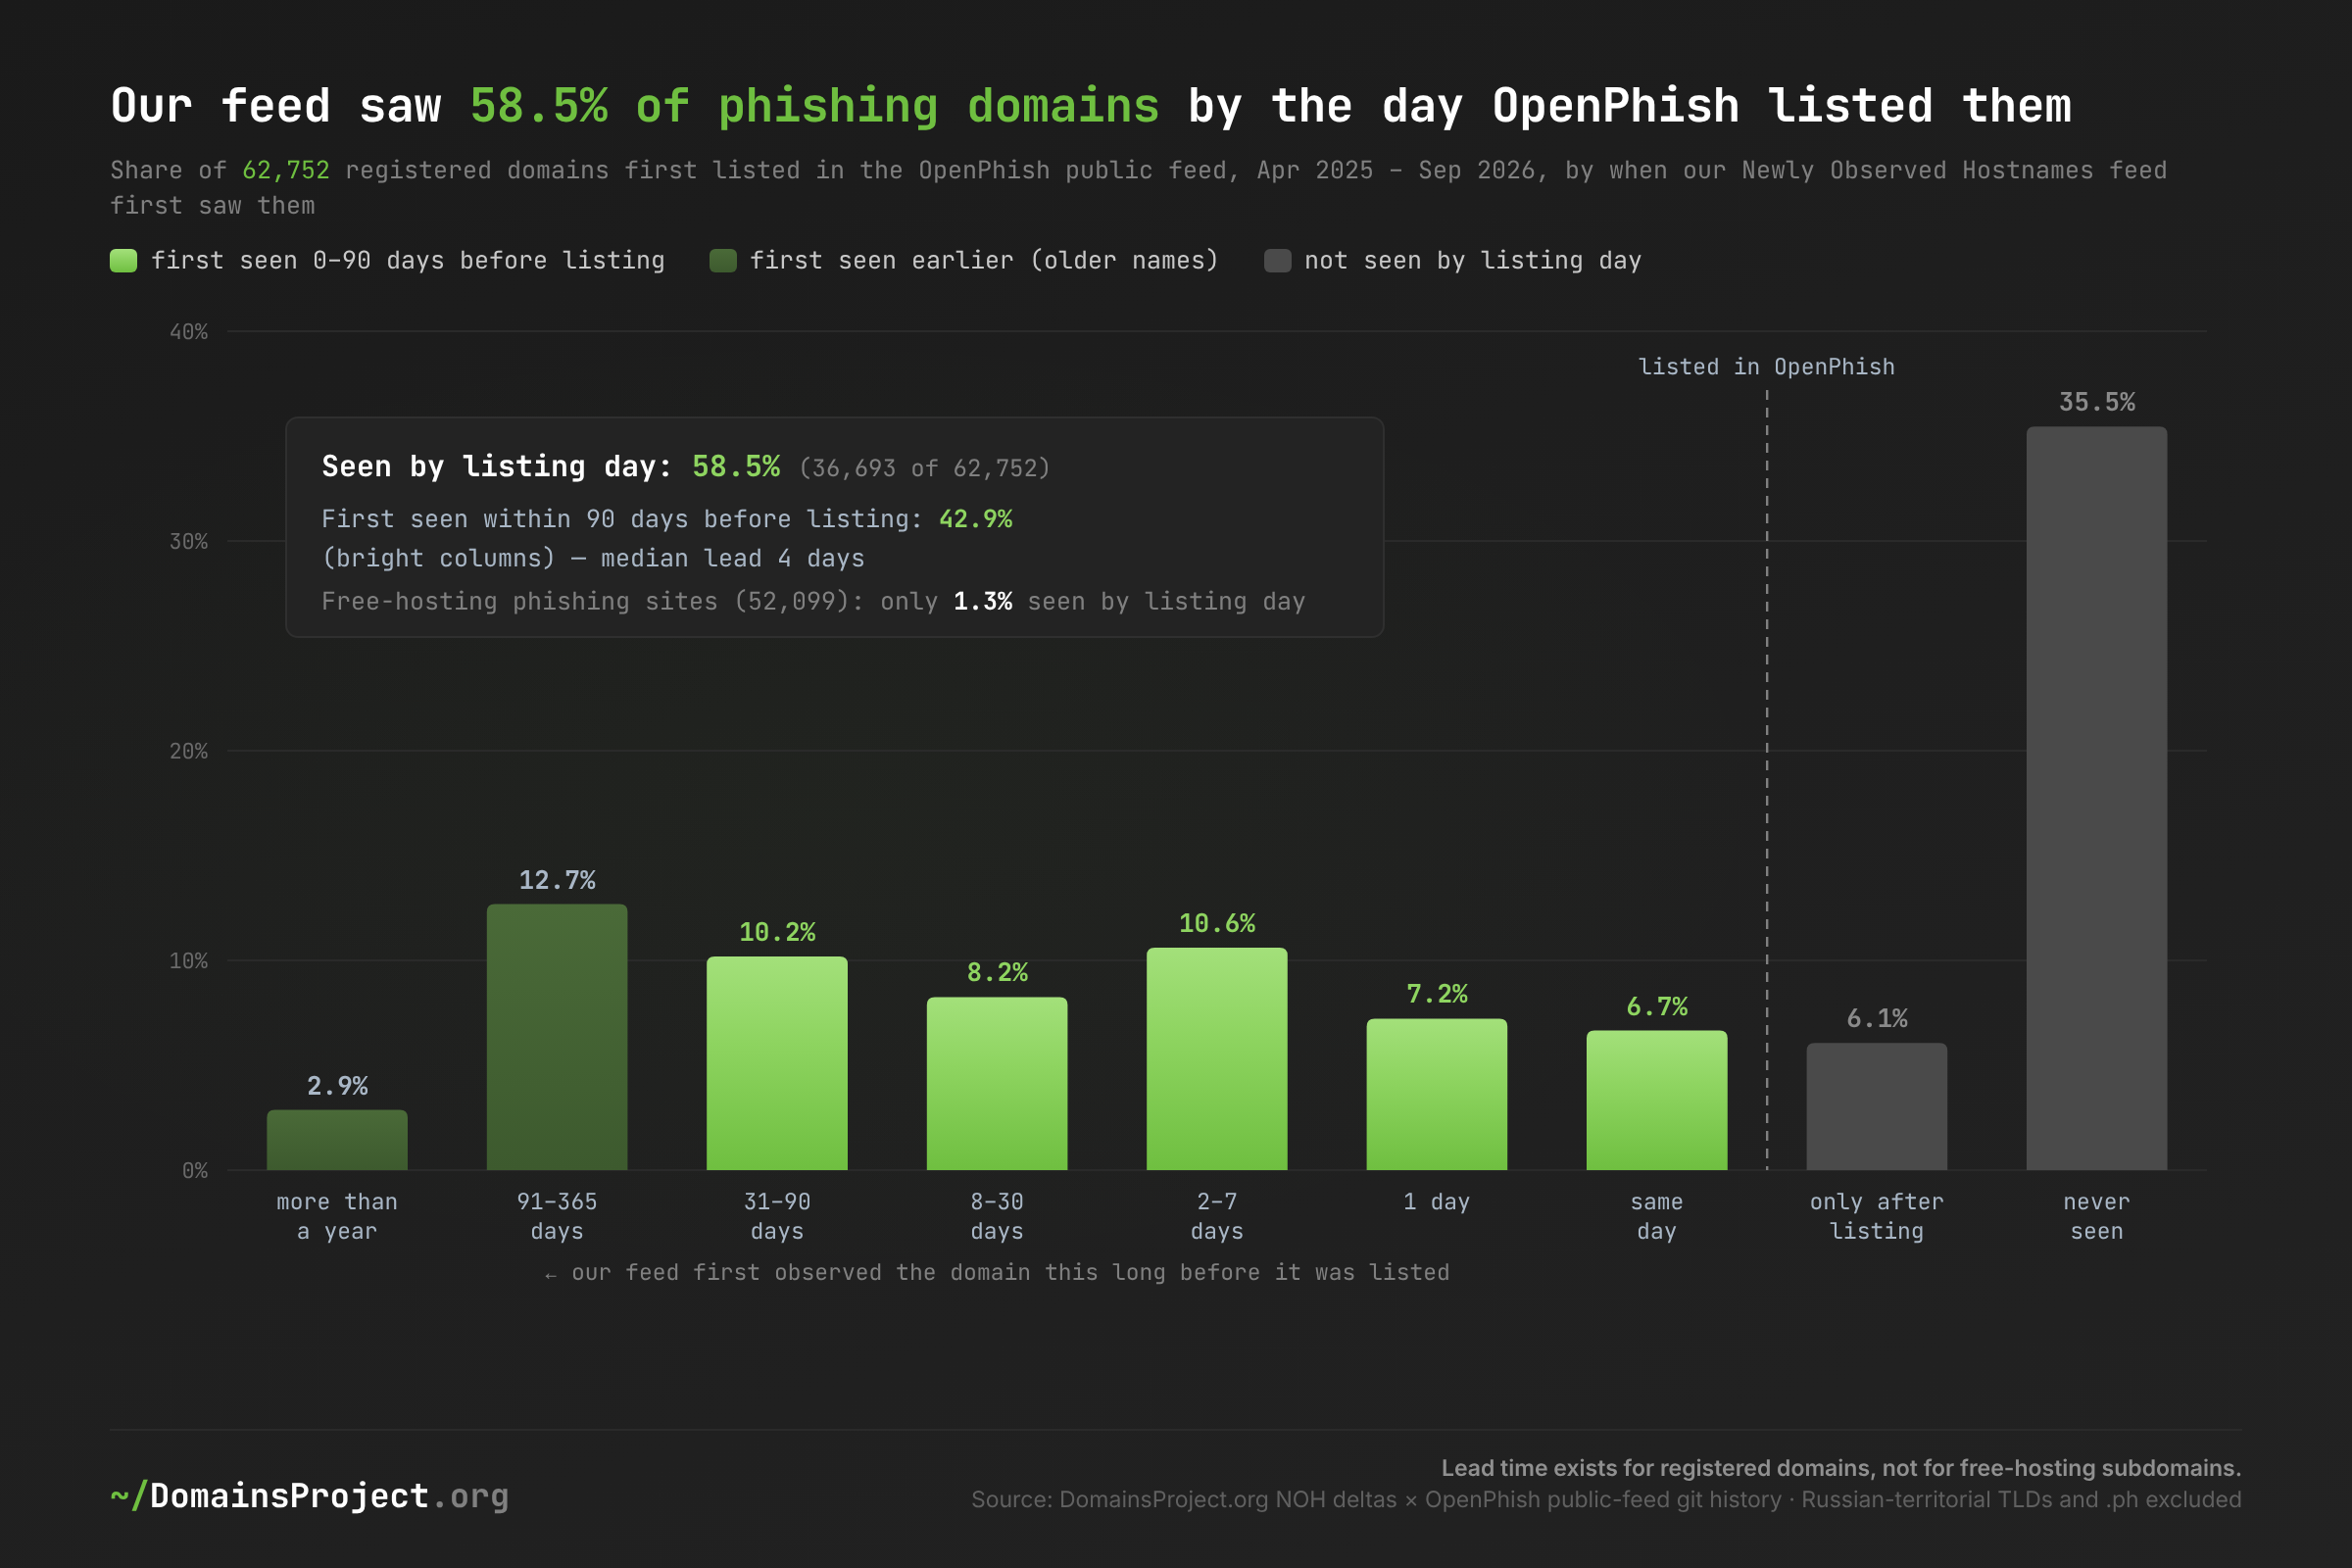
Download: activation-noh-lead.csv · OpenPhish public-feed listings April 1, 2025 – September 27, 2026, first listing per registered domain; NOH first observation of any hostname under the domain.
For registered domains, the lead time is real and mostly short. Of 62,752 registered domains OpenPhish first listed in the period, NOH had observed 58.5% on or before the listing day. 42.9% were first observed within the 90 days before listing (the bright columns) with a median lead of 4 days, and 36.3% were observed between one and 90 days ahead. Another 15.6% were first observed more than 90 days earlier; these older names are consistent with the compromised or long-held domains that Interisle counts outside its 77% maliciously registered share. 35.5% never appeared in NOH at all, either because their hostnames predate our December 2024 archive or because our crawl never reached them.
For free-hosting sites, there is no lead time to speak of. Of 52,099 free-hosting phishing sites OpenPhish listed in the same period (*.vercel.app, *.blogspot.com, *.pages.dev and similar), NOH had observed 697, or 1.3%, by the listing day, and 140 more only afterwards. A DNS crawl discovers hostnames it can resolve and enumerate; a free-hosting subdomain created an hour before a campaign is invisible to it. The July post claimed the opposite for Instagram's outage phishing on vercel.app and blogspot.com; none of the four hostnames it cited appears anywhere in our archive, and that claim is now corrected.
Stability over time
| Listing quarter | Registered domains listed | Seen by listing day | First seen within 90 days before |
|---|---|---|---|
| 2025 Q2 | 8,981 | 48.8% | 44.0% |
| 2025 Q3 | 10,223 | 65.4% | 48.7% |
| 2025 Q4 | 10,342 | 58.8% | 43.2% |
| 2026 Q1 | 10,442 | 45.5% | 27.5% |
| 2026 Q2 | 14,033 | 62.6% | 47.9% |
| 2026 Q3 (to Sep 27) | 8,731 | 68.8% | 45.2% |
The lead-time share holds in every quarter except one. Five of six quarters sit between 43% and 49% for recent first observations; the first quarter of 2026 dropped to 27.5%, and we have not explained it. URLhaus tells the same story with a longer tail: of 2,121 registered domains it listed between late June and September 2026, NOH had observed 57.3% by the listing day, but only 21.0% within the prior 90 days (median lead 28 days), consistent with malware distribution relying more on older or compromised domains.
The Clock: Most Listings Come Before Anyone Looks
The retrospective arm says NOH usually sees a phishing domain first, by a few days. The cohort data says what that means for posture: for most listed domains, those few days are the whole window before discovery.
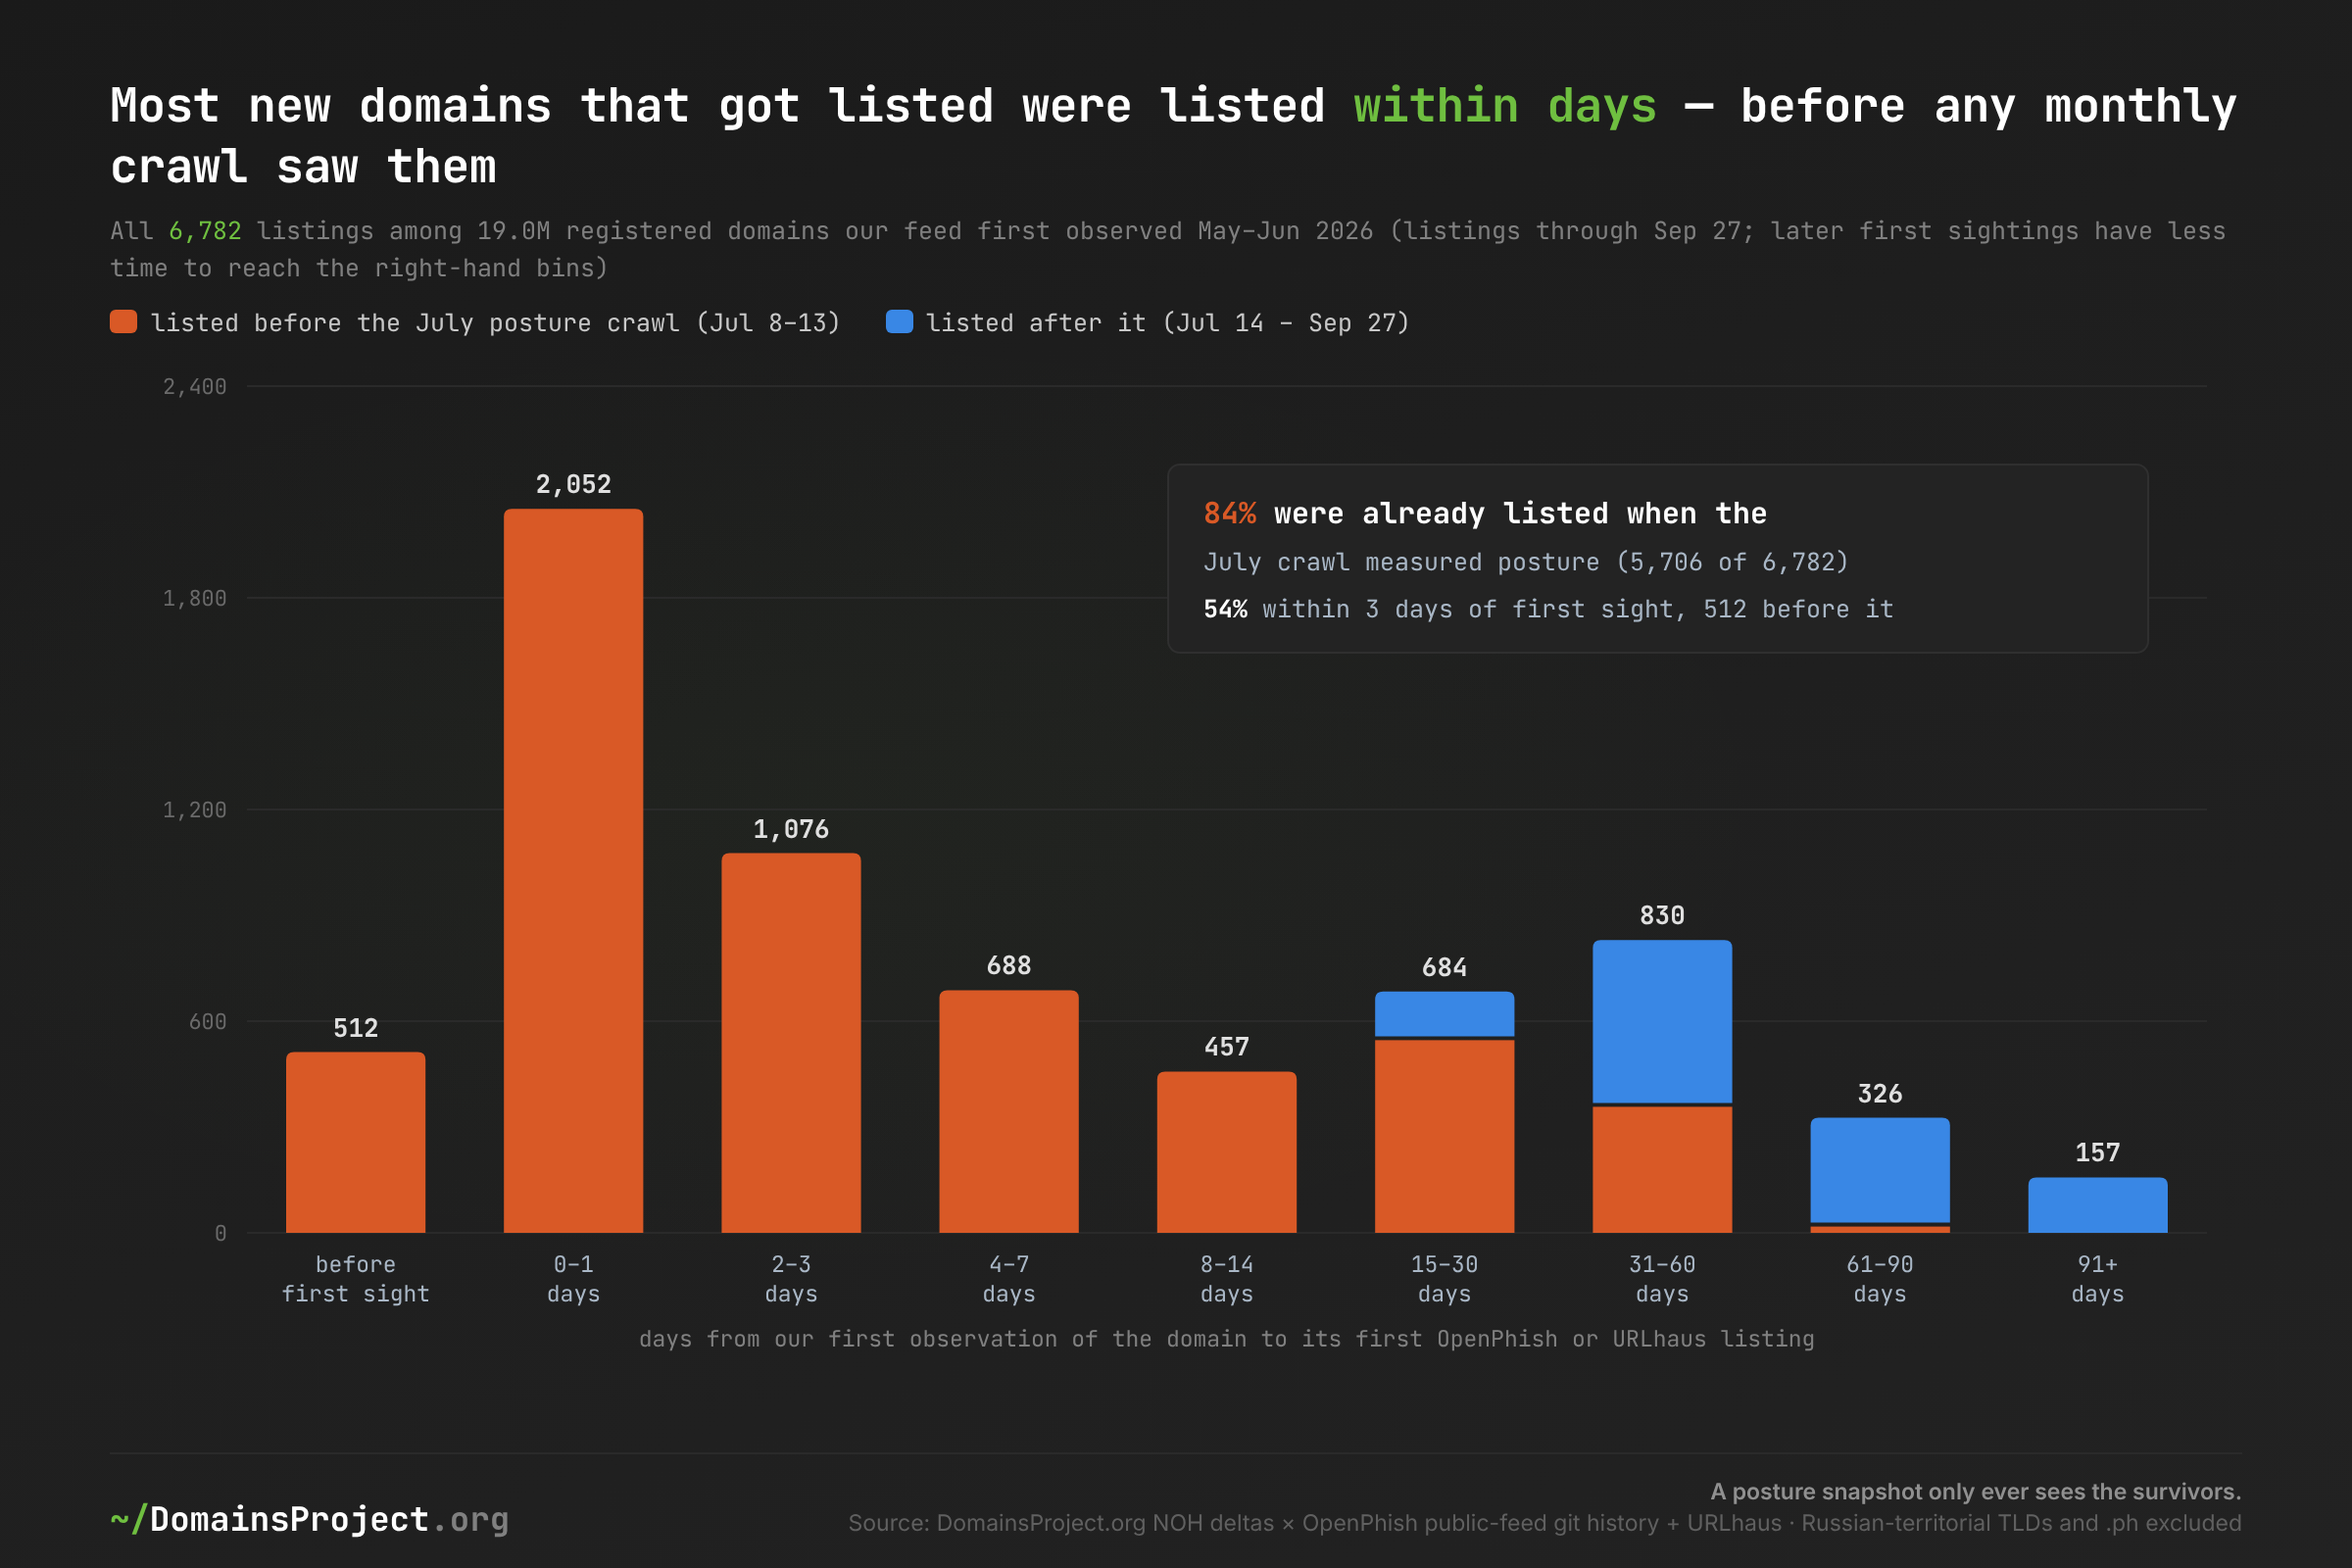
Download: activation-listing-clock.csv · July cohort; days from first NOH observation to first OpenPhish or URLhaus listing; listings through September 27, 2026. Domains first observed late in June have less time to reach the longer bins.
Speed dominates. Across the July cohort's 6,782 listings, 3,640 (53.7%) came within three days of first observation, including 512 listed before NOH saw the domain at all, and 4,328 (63.8%) within a week. 5,706 (84.1%) were listed before the July crawl finished measuring posture. The June and August cohorts show the same shape: 79% and 89% of their listings came before their crawls, at a median of one and two days after first observation.
A monthly posture snapshot therefore only ever sees the survivors. Whatever posture predicts, it predicts for the slower 16% or so that stay unlisted for weeks. For the fast majority, the only usable signals are the ones available on the day of first observation: the name itself and whatever a same-day query can return.
Posture: Parking Is the Signal, and Mail Splits in Two
For the domains that survived to the crawl, here is what their posture predicted.
| Posture at the July crawl | Domains | Share | Listed after | Per 10,000 | vs cohort rate |
|---|---|---|---|---|---|
| Resolving, no MX | 8,284,557 | 43.7% | 756 | 0.91 | 1.61× |
| Live MX (not parked) | 4,916,997 | 25.9% | 174 | 0.35 | 0.62× |
| — self-hosted MX | 1,358,294 | 7.2% | 123 | 0.91 | 1.60× |
| — third-party MX | 3,558,703 | 18.8% | 51 | 0.14 | 0.25× |
| Parked | 3,609,751 | 19.0% | 17 | 0.05 | 0.08× |
| Not crawled | 1,680,004 | 8.9% | 110 | 0.65 | 1.15× |
| Dark | 475,265 | 2.5% | 19 | 0.40 | 0.70× |
| All (risk set) | 18,966,574 | 100% | 1,076 | 0.57 | 1.00× |
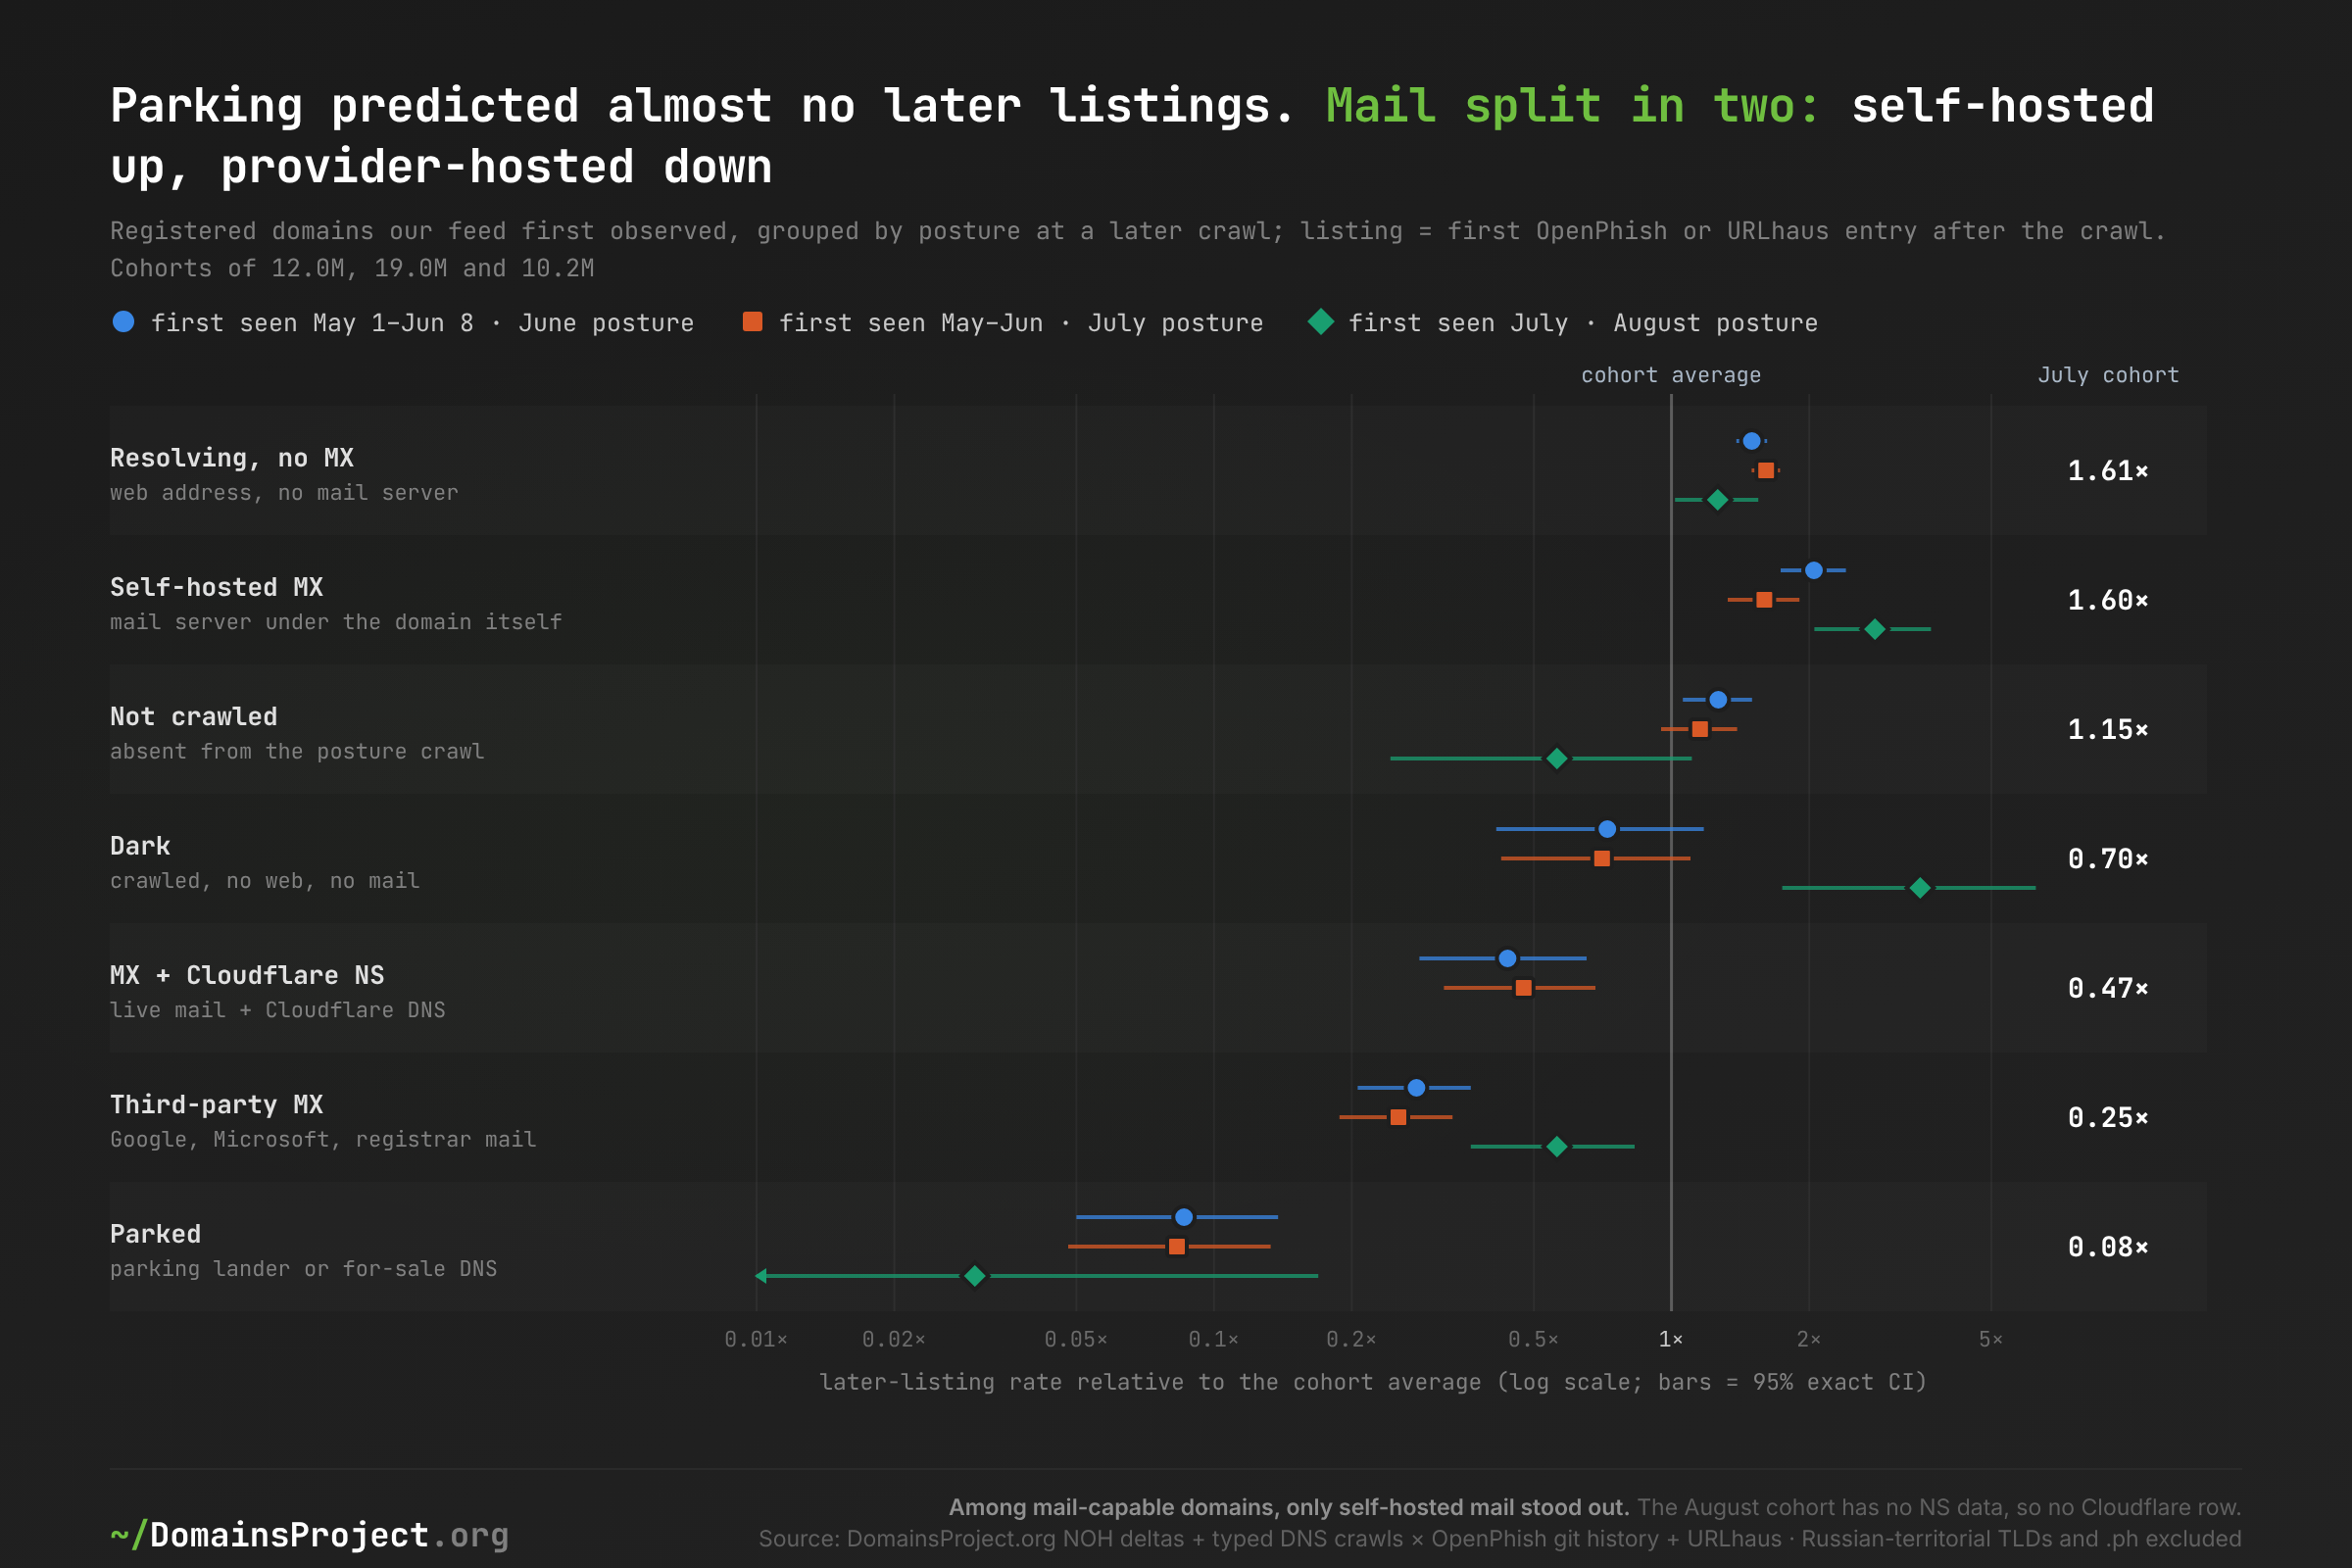
Download: activation-posture-lift.csv · lift = class rate ÷ cohort rate; 95% exact intervals; the August cohort has no NS data, so it has no Cloudflare row.
Parking is the one strong, stable signal. Parked domains, about a fifth of each cohort, were listed at 0.03× to 0.09× the cohort average: 17 of 3.6 million in July, one of 1.8 million in August. That is the expected result for inventory held for resale, and the figure is consistent with the parking tier we measured in The Parking Lot.
Mail capability splits into two opposite signals. Among July's 4.9 million mail-capable domains, the 3.6 million whose mail runs through a third party (Google, Microsoft, registrar mail, forwarders) were listed at a quarter of the average rate, while the 1.4 million with self-hosted mail were listed at 1.6×, about the same as resolving domains with no mail at all. Self-hosted MX was 4.8× to 7.7× as likely to be listed as third-party MX across the three cohorts. The likeliest reading is that self-hosted MX marks a hosting stack rather than an intent: it is the default on cheap cPanel shared hosting, where many phishing kits are deployed, while domains with a paid mailbox are disproportionately operating businesses. The data cannot separate those explanations; it shows only which way each group leaned.
Cloudflare did not mark danger either. Domains delegated to Cloudflare's nameservers were listed at 0.70× to 0.75× the rate of other non-parked domains, and domains with both a live MX and Cloudflare nameservers, the combination the July post singled out, at about half the rate of everything else. Cloudflare's own abuse removals may contribute (fast takedowns move domains into the prevalent group), so this is not evidence that Cloudflare customers are safer, only that the combination does not predict a listing.
Two weaker patterns are worth recording. Domains whose web address sat on a network outside our provider registry, mostly small and unlabeled hosts, were listed at 2.1× and 2.2× the average in the June and July cohorts and 1.7× in August, while sites on website builders (Wix, Squarespace, Shopify, Vercel and peers) were listed at 0.07× in June and July and 0.46× in August. The TLD pattern was not stable: cheap promotional gTLDs ran at 2.0× and 1.7× in June and July but 0.94× in August, so we do not report it as a finding.
We Tested Our Own Advice
The July recommendation was specific: "filter to resolving-with-live-MX and exclude parking nameservers before a name reaches an analyst." Here is how that rule, and the alternatives, performed on every new domain in the July cohort.
| Rule applied at the July crawl | Flags (share of cohort) | Catches (share of later listings) | Listed per 10,000 flagged | vs cohort rate |
|---|---|---|---|---|
| Live MX, not parked (the July advice) | 25.9% | 16.2% | 0.35 | 0.62× |
| Live MX + Cloudflare NS | 5.7% | 2.7% | 0.27 | 0.47× |
| Cloudflare NS | 25.3% | 28.8% | 0.65 | 1.14× |
| Cloudflare-fronted web | 24.3% | 20.9% | 0.49 | 0.86× |
| Self-hosted MX | 7.2% | 11.4% | 0.91 | 1.60× |
| Resolving, not parked | 69.6% | 86.4% | 0.70 | 1.24× |
| Not parked | 81.0% | 98.4% | 0.69 | 1.22× |
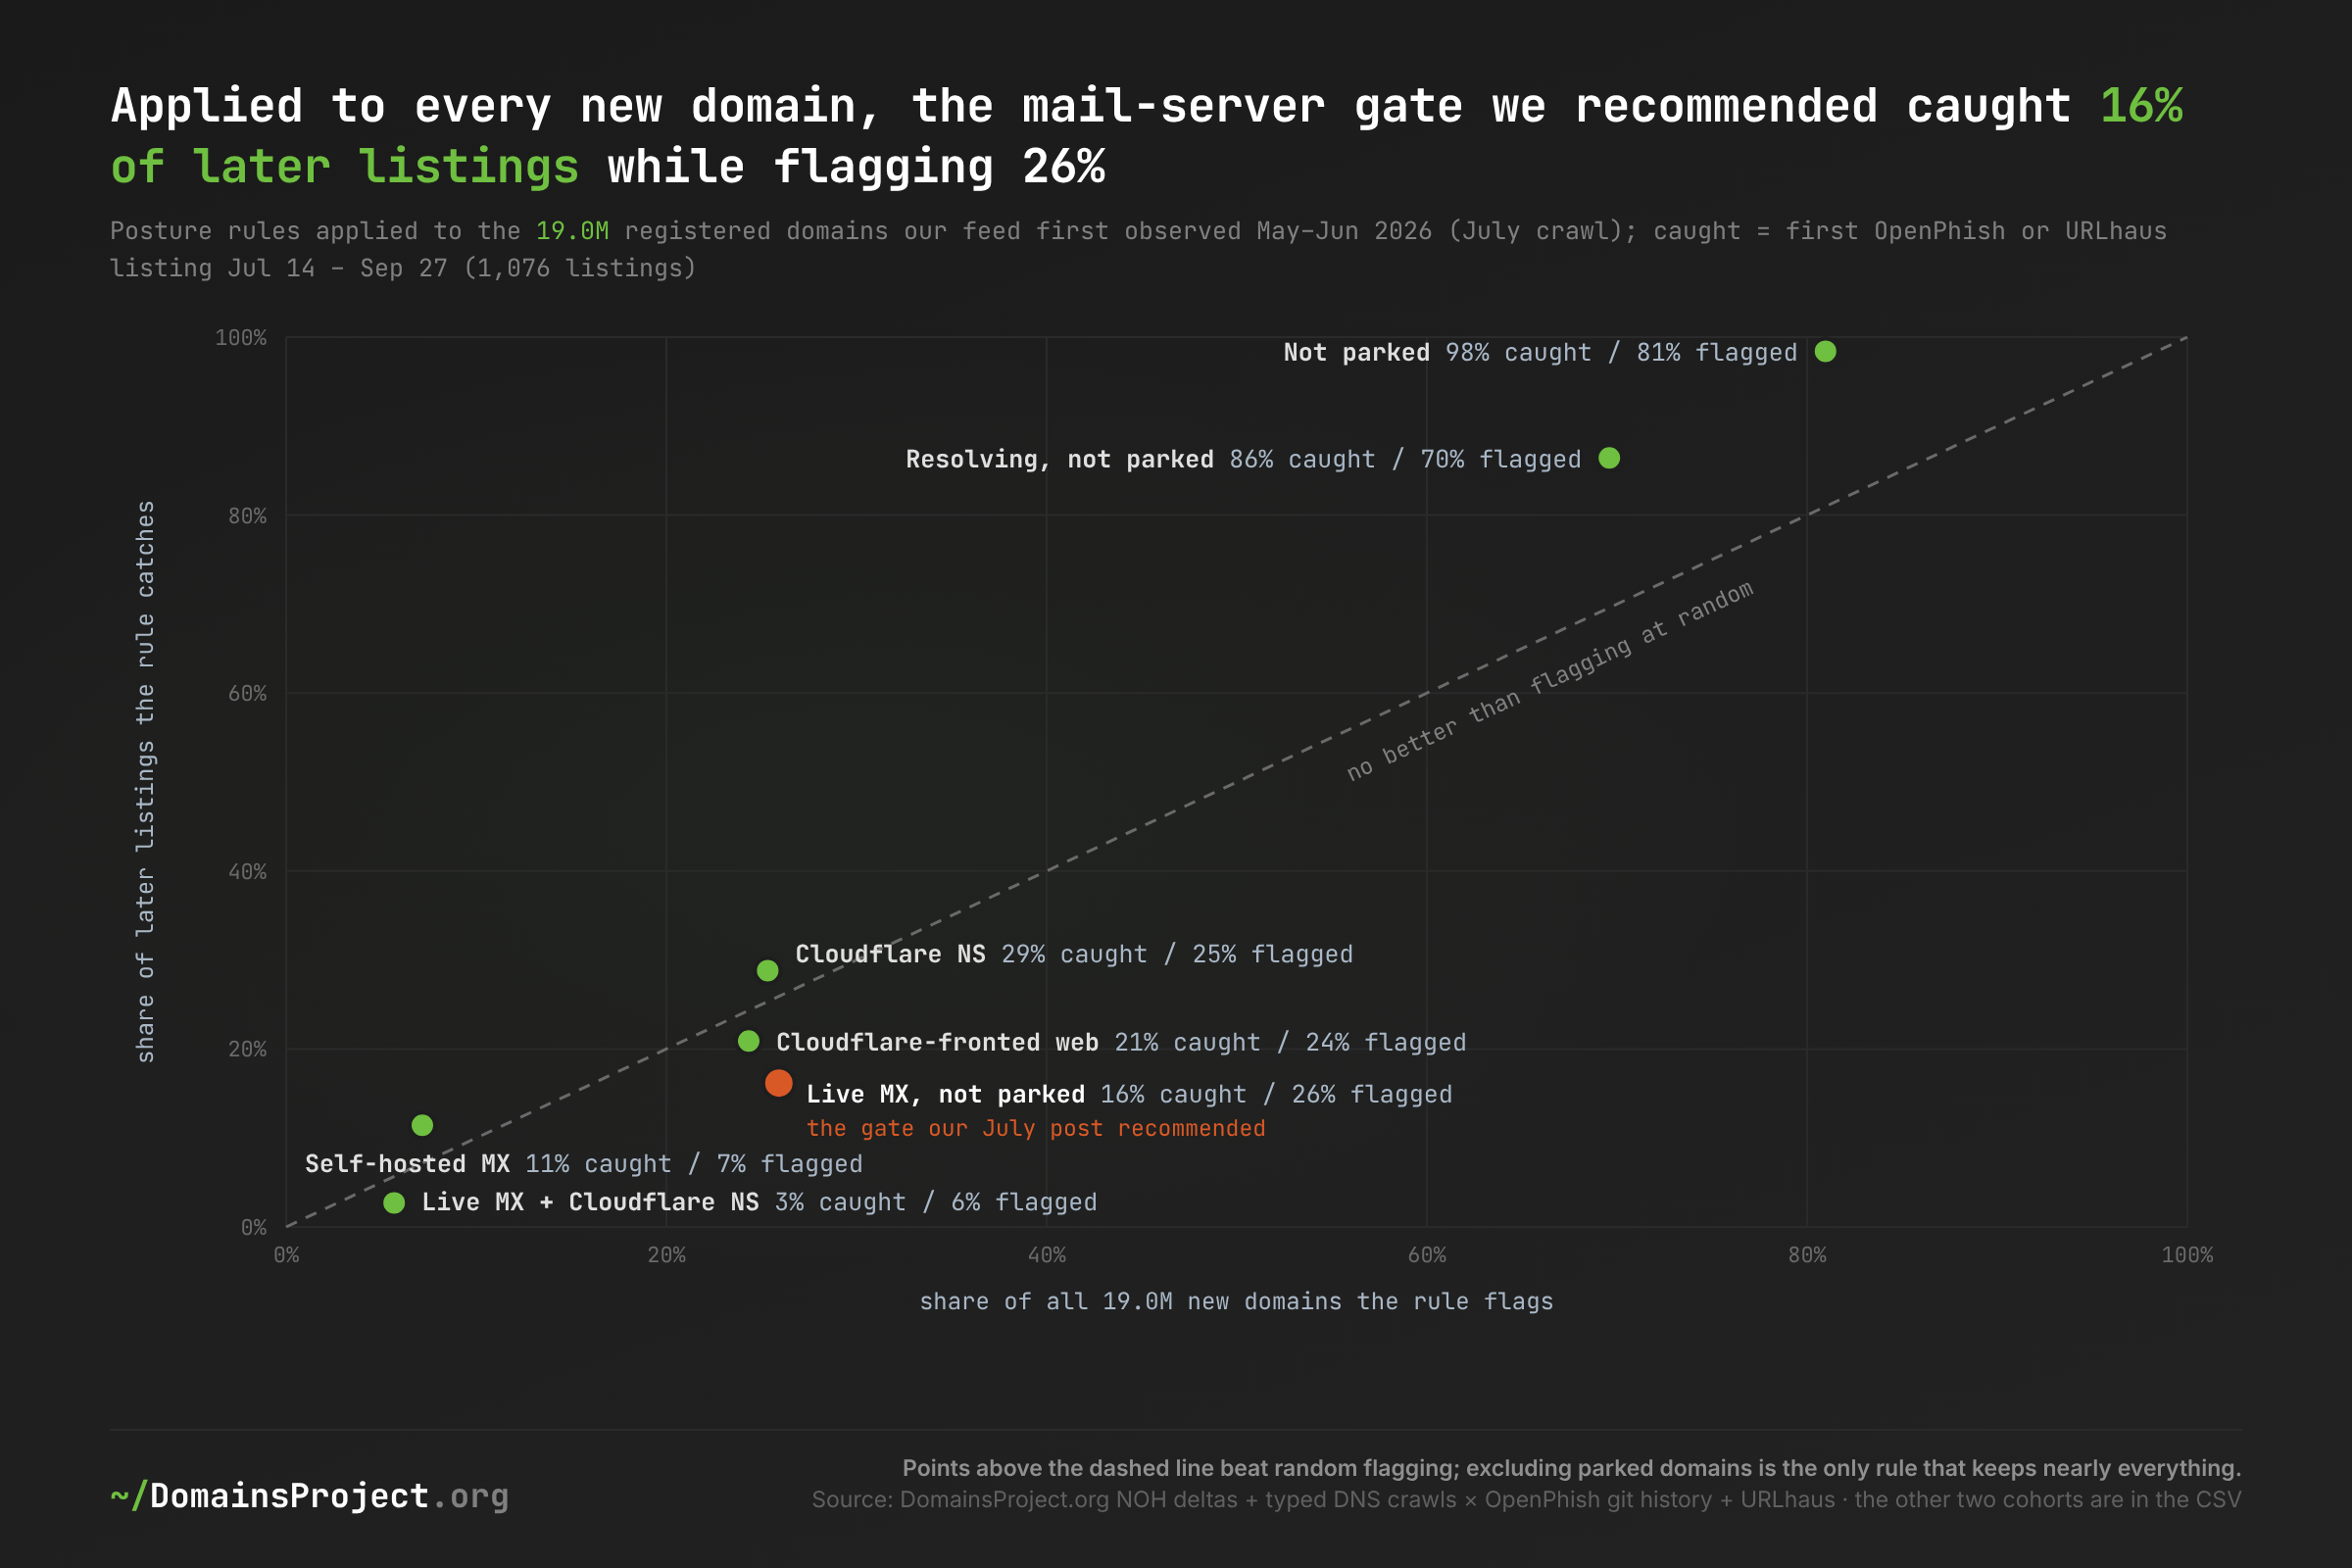
Download: activation-alert-rules.csv · all three cohorts are in the CSV; the live-MX gate caught 19.6% of later listings in the June cohort and 39.5% in the August cohort.
In the July cohort, the mail-server gate did worse than flagging at random. It flagged a quarter of all new domains and caught a sixth of the ones listed later; five in six later listings fell outside it. The June cohort looked the same (25.3% flagged, 19.6% caught). In August it did slightly better than random, catching 39.5% while flagging 33.4%, and still missed three in five. Excluding parked domains did the opposite: it removed 19% of the queue and kept 98.4% of later listings (98.3% and 99.5% in the other two cohorts).
No posture rule produces an alert stream on its own. The best precision any rule reached in any cohort was under two listings per 10,000 flagged domains. What made the July lookalikes worth watching was the name, not the posture: three of those 857 brand-matched domains were listed between June and September, 35 per 10,000 (95% CI 7–102), against 3.6 per 10,000 across the whole July cohort (all listings, May to September). That is roughly ten times the base rate, with a wide interval. Brand matching supplies the precision; posture can only reorder what the name has already selected.
Two limits keep this from being a clean verdict on the July advice. The advice was for brand-matched watchlists, and we tested it on the whole population because 857 names produced only one listing after enrollment; that single listing, oginstagram.com, had a third-party MX on Cloudflare's email routing and Cloudflare nameservers, exactly the combination the population data ranks low. And the outcomes are web feeds: a gate on MX may still be the right gate for email-lure or business-email-compromise domains, which no public web feed records.
The 857: A Lookalike's First Nine Weeks
The prospective arm followed the 857 brand-matched lookalikes from the July post with a full A, MX, and NS probe every Thursday from July 24 to September 24.
| Change between Jul 24 and Sep 24, 2026 | Domains |
|---|---|
| Stopped resolving | 65 |
| Nameserver delegation disappeared | 33 |
| Lost their MX | 23 |
| Gained an MX | 16 |
| Moved to parking or for-sale nameservers | 9 |
| Moved to Cloudflare nameservers | 8 |
| Started resolving | 6 |
| Any change (a domain can appear in several rows) | 124 (14.5%) |
Lookalike posture drifts slowly and mostly toward death. The share resolving fell from 88.2% to 81.3% over nine weeks, while the mail-capable share barely moved (25.8% to 25.0%) because gains nearly offset losses. OpenAI lookalikes changed most often (72 of 427, 17%), Kimi K3 lookalikes at a higher rate on a small base (6 of 21), and Social Security names least among the large groups (11 of 133). Nineteen domains flipped a state more than once, which is consistent with transient query failures, so the week-to-week counts carry some noise.
Three of the 857 were ever listed, all Instagram lookalikes. Two, b-instagram.com.cn and meta-instagram.com.cn, were listed two days after first observation and were dead before enrollment; they are the domains the July null missed. The third, oginstagram.com, first observed June 11, was listed on September 17 for one day, with its posture unchanged across all ten probes: resolving, Cloudflare nameservers, mail on Cloudflare's email routing. One domain cannot carry a statistic, which is why the population cohorts exist.
What's at Stake
- A live mail server does not predict a web-phishing feed listing — gating on it discarded 60–84% of the later OpenPhish and URLhaus listings across three cohorts, and the mail-capable domains that remained were listed no more often than plain resolving ones.
- Parking is the most reliable negative signal available — excluding parked domains cut the queue by about a fifth while losing 0.5–1.7% of later listings, in every cohort.
- Most listings arrive before a monthly crawl looks — 79–89% of listings came before the posture crawl, a median of one to two days after first observation, so posture-based triage only ever acts on the slow minority.
- Free-hosting phishing escapes DNS-crawl feeds, ours included — NOH saw 1.3% of OpenPhish's free-hosting sites by listing day, against 58.5% of its registered domains.
- Point-in-time feed checks manufacture false negatives — the OpenPhish public feed rotates every 12 hours, and a daily snapshot caught 59% of its URLs; our own July null was one of these false negatives.
- DNS data sees how a domain starts and a feed sees how it is discovered, but neither sees the weaponization in between — observation and activation are visible to a crawler, deployment and abuse are not, and a listing is a third party's discovery after an unknown lag. Every posture-versus-outcome result, ours included, is measured across that gap.
What Would Help
1. SOC and detection teams: filter out parking; do not require a mail server. Dropping parked and for-sale domains is the one posture rule that shrinks a new-domain queue (by about 19%) without losing listings (98.4% kept). Requiring a live MX lost five in six of the July cohort's later listings. If you adopted the gate from our July post for web-phishing watchlists, replace it with the parking filter.
2. Detection engineers: use posture to rank, never to gate, and weight it correctly. Self-hosted MX (4.8–7.7× third-party MX) and web hosting on unlabeled networks (1.7–2.2× the average) push a domain up; third-party mailboxes (0.25×), website builders, and parking push it down. None of these lifts a rule above two listings per 10,000 flagged domains, so the name match has to do the selecting and posture the ordering.
3. Threat-intelligence platforms: check against feed history, not feed contents. The OpenPhish community feed publishes a new batch every 12 hours and keeps a URL for a median of one batch. Poll every cycle or replay the public repository's history; a daily snapshot misses about 40%. Any "not in the feed" verdict should state the window it covers.
4. Researchers evaluating new-domain signals: report the prevalent share and the truncation. A posture-versus-outcome study that silently drops the domains listed before measurement will overstate what posture can do; one that keeps them will measure posture after the fact. State both numbers, as in the scorecard above, and date posture before outcome. Name the stage each measurement comes from: DNS posture is activation, a feed listing is discovery, and neither is weaponization. The CSVs linked under each chart are enough to check ours.
5. Free-hosting platforms: the lead time on your subdomains belongs to you. A crawl-based feed saw 1.3% of free-hosting phishing sites before they were reported, because a subdomain created minutes before a campaign has no DNS history to observe. Only the platform sees the creation event. Interisle's report makes the same case for subdomain providers: brand-name screening at sign-up and fast abuse response are levers no outside feed can pull.
Analysis by DomainsProject, an Internet measurement and intelligence organization. First observations from our Newly Observed Hostnames feed, December 24, 2024 – September 27, 2026 (641 daily deltas; 250.2 million registered domains); posture from our June, July and August 2026 web, MX and NS crawls; outcomes from the full git history of the OpenPhish public feed and URLhaus (daily recent-feed snapshots from July 24, 2026, whose 30-day window reaches back to June 24, plus the abuse.ch CSV dump); weekly A/MX/NS probes of the 857 lookalikes from The News Cycle Has a Domain Footprint, July 24 – September 24, 2026. Outcomes are feed listings, not verdicts of malice. Risk ratios are Mantel–Haenszel adjusted for TLD group, month of first observation, and prior-crawl presence. Russian-territorial TLDs (.ru, .su, .moscow, and the two Cyrillic IDN suffixes) excluded by policy, and .ph excluded as registry-wildcard noise. External context from Interisle Consulting's Phishing Landscape 2025 and Palo Alto Networks Unit 42. Explore the domain statistics dashboard or the dataset.