English is the native language of roughly 380 million people — about 4.7% of the global population. It is a second language for perhaps another 750 million, depending on how generously you define fluency. By any demographic measure, English is a minority language on a planet where Mandarin, Hindi, and Spanish each claim more speakers.
On the internet, demographics do not apply.
W3Techs reports that English accounts for 49.5% of content across the top 10 million websites — a figure that has held roughly stable since 2019 while every other language's share has either stagnated or declined. The conventional reading is that English dominance is gradually diluting as non-English-speaking populations come online. The data tells a different story. When you move beyond content volume on global TLDs and examine what language actual websites use on country-code domains — the namespaces explicitly created for national communities — the English footprint is not 49.5%. It is substantially higher, and it reaches places no one expected.
We used LLMSE, DomainsProject's AI-powered website classification engine, to detect the language of 1,744,730 websites drawn from the DomainsProject dataset and indexed in the LLMSE classification pipeline. The sample spans every major country-code TLD and dozens of generic TLDs, with language detection performed via HTML lang attribute extraction with fallback to the lingua computational linguistics library. We then cross-referenced these language classifications against the full DomainsProject dataset — over 600 million domain records across 244 country-code namespaces — to contextualize the findings against the scale of each national namespace. External triangulation draws on the EF English Proficiency Index (2025 edition, 2.2 million test-takers across 123 countries), W3Techs content language surveys (April 2026), and Ethnologue language data.
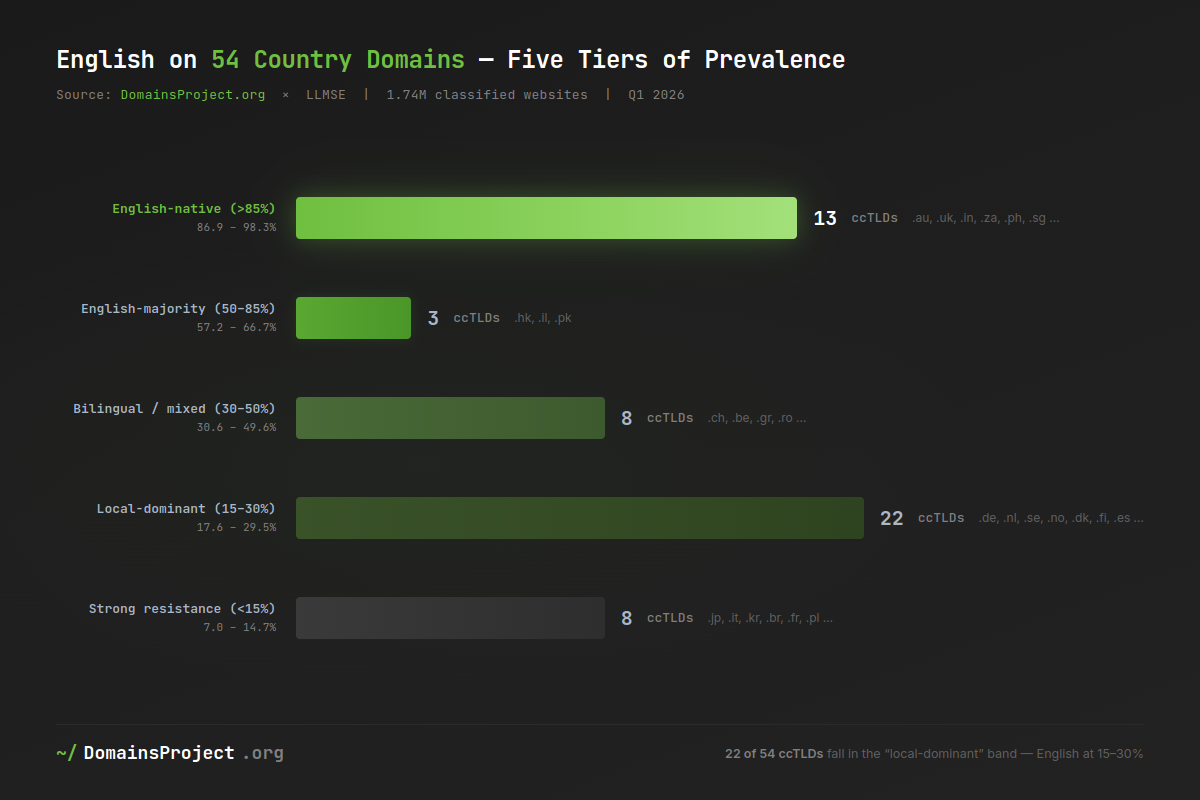
The headline: 1,121,764 of the 1,744,730 classified websites — 64.3% — are in English. Among the 54 country-code TLDs with sufficient sample sizes for analysis, English exceeds 90% on 8 ccTLDs, exceeds 50% on 16, and falls below 15% on only 8. Japan's .jp, at 7.0% English, is the global floor. Australia's .au, at 98.3%, is the ceiling. Between those two extremes, the data reveals not a single story of English dominance but five distinct mechanisms — colonial inheritance, commercial necessity, cultural resistance, tech-brand capture, and neutral-language default — each producing a measurably different English footprint on the domains of countries that, in most cases, do not speak English at home.
The Data
LLMSE continuously classifies websites using a combination of HTML metadata extraction, computational language detection, and LLM-powered content analysis. Here is the dataset scope for this analysis:
| Metric | Value |
|---|---|
| Total websites classified | 1,744,730 |
| Websites with detected language | 1,688,092 |
| Languages detected | 146 |
| English-language websites | 1,121,764 (64.3%) |
| Country-code TLDs analyzed | 54 (min. 100 classified sites each) |
| DomainsProject domain records (context) | 600M+ across 244 ccTLDs |
| Classification period | Q1 2026 |
The 1.74 million classified websites are drawn from the DomainsProject crawl pipeline and represent active, resolving websites — not parked pages, DNS-only records, or redirect chains. Language detection succeeded for 96.8% of classified sites. The remaining 3.2% (56,638 sites) returned no detectable language — typically single-page JavaScript applications, image-only pages, or sites behind authentication walls.
Global Language Distribution (Top 15)
Percentages in this table are calculated against the 1,688,092 language-detected sites (excluding 56,638 with no detectable language). The headline 64.3% figure uses the full 1,744,730 denominator.
| Rank | Language | Websites | Share |
|---|---|---|---|
| 1 | English | 1,121,764 | 66.5% |
| 2 | German | 100,548 | 6.0% |
| 3 | French | 56,705 | 3.4% |
| 4 | Spanish | 46,355 | 2.7% |
| 5 | Dutch | 42,008 | 2.5% |
| 6 | Chinese | 41,489 | 2.5% |
| 7 | Japanese | 35,849 | 2.1% |
| 8 | Portuguese | 26,785 | 1.6% |
| 9 | Russian | 20,142 | 1.2% |
| 10 | Polish | 18,939 | 1.1% |
| 11 | Vietnamese | 15,680 | 0.9% |
| 12 | Italian | 13,968 | 0.8% |
| 13 | Czech | 12,368 | 0.7% |
| 14 | Indonesian | 12,083 | 0.7% |
| 15 | Turkish | 11,313 | 0.7% |
English at 66.5% of language-detected websites is 11x the share of the next language (German at 6.0%). The gap between first and second place is larger than the combined share of languages ranked 2 through 15. This is not a distribution with a long tail competing for the top — it is a distribution with one language and then everything else.
Methodology
Definitions
- Classified website: A URL that was fetched, rendered, and processed through the LLMSE classification pipeline, producing at least one metadata classification (language, category, or quality metric). Each URL represents one website — typically the apex domain or www subdomain.
- Detected language: The natural language of the website's primary text content, determined by the LLMSE language detection pipeline. A website is assigned exactly one language.
- English prevalence (%): The percentage of classified websites on a given ccTLD that were detected as English-language. Calculated as: (English-language sites on TLD) / (total language-detected sites on TLD) × 100.
- Country-code TLD (ccTLD): A two-letter top-level domain assigned to a country or territory per ISO 3166-1 alpha-2, plus .eu (European Union). We include .io and .ai as ccTLDs per their IANA delegation, while noting their anomalous usage patterns.
Classification Heuristics
Language detection follows a two-stage pipeline:
- HTML
langattribute extraction (primary): If the HTML document declares alangattribute on the<html>element, the ISO 639 code is resolved to a language name. This method is deterministic and precise but depends on correct markup — approximately 65% of websites in our sample provide a usablelangattribute. - Computational detection via lingua (fallback): For the remaining ~35%, the extracted text content (meta description, keywords, and body text) is passed to the lingua language detection library, which uses statistical models trained on character n-grams and word frequency distributions. Lingua supports 75+ languages with high accuracy for texts over 50 characters.
A website is classified as "English" if either method identifies English as the primary language. No secondary or minority language detection is performed — a bilingual English/French website with English as the lang attribute is classified as English.
Dataset Scope
- The 1.74 million classified websites are a convenience sample drawn from the LLMSE classification queue, not a statistically random sample of all websites on each ccTLD. The classification queue is populated from the DomainsProject crawl pipeline, which enumerates domains via active DNS resolution across all delegated TLDs.
- Sample sizes per ccTLD range from 134 (.zw) to 342,471 (.io). The median sample size across the 50 analyzed ccTLDs is 4,602. Statistical significance varies by TLD — findings for ccTLDs with fewer than 1,000 classified sites should be treated as directional indicators rather than precise measurements.
- Classification reflects the state of websites at the time of LLMSE processing during Q1 2026. Websites may change language over time.
Known Limitations
- Convenience sample, not random sample: The LLMSE classification queue oversamples websites that appear in DNS crawls and undersamples sites behind CDN-only configurations or those with non-standard DNS patterns. This may bias toward established, well-configured websites and away from informal or community-run sites.
- Single-language classification: Bilingual and multilingual websites are assigned one language based on the primary signal. In multilingual countries (Belgium, Switzerland, Canada), this approach undercounts minority languages on individual domains.
- HTML
langattribute reliability: Some websites declarelang="en"by default regardless of content language — a known issue with CMS templates and boilerplate HTML. This may slightly inflate English counts for non-English websites using English-default templates. - Sample size variation: .io (342,471) and .de (83,961) have 2,500x and 627x the sample size of .zw (134). Per-TLD percentages should be compared with awareness of this variance.
- No longitudinal data: This is a single-snapshot analysis. Claims about trends, shifts, or trajectories are not supported by the data and are not made in this post.
The full DomainsProject dataset is available for independent analysis at /dataset. LLMSE classification data is accessible via the LLMSE platform.
The Scorecard
English Prevalence Across 54 Country-Code TLDs
| Rank | ccTLD | Country/Territory | Classified | English | English % | Top Local Language | Local % |
|---|---|---|---|---|---|---|---|
| 1 | .au | Australia | 19,982 | 19,650 | 98.3% | — | — |
| 2 | .nz | New Zealand | 3,959 | 3,883 | 98.1% | — | — |
| 3 | .ie | Ireland | 2,661 | 2,607 | 98.0% | Irish | 0.5% |
| 4 | .uk | United Kingdom | 41,919 | 40,950 | 97.7% | — | — |
| 5 | .za | South Africa | 6,885 | 6,689 | 97.2% | Afrikaans | 0.2% |
| 6 | .sg | Singapore | 1,747 | 1,695 | 97.0% | Chinese | 0.6% |
| 7 | .in | India | 11,158 | 10,702 | 95.9% | Hindi | 0.8% |
| 8 | .ph | Philippines | 1,233 | 1,159 | 94.0% | Tagalog | 2.1% |
| 9 | .ca | Canada | 14,712 | 13,165 | 89.5% | French | 8.8% |
| 10 | .io | Br. Indian Ocean Terr. | 342,471 | 304,985 | 89.1% | Chinese | 2.8% |
| 11 | .my | Malaysia | 2,604 | 2,313 | 88.8% | Chinese | 3.1% |
| 12 | .us | United States | 5,297 | 4,633 | 87.5% | Vietnamese | 1.9% |
| 13 | .ai | Anguilla | 39,303 | 34,140 | 86.9% | French | 2.1% |
| 14 | .hk | Hong Kong | 1,410 | 941 | 66.7% | Chinese | 27.1% |
| 15 | .id | Indonesia | 4,881 | 3,180 | 65.2% | Indonesian | 32.8% |
| 16 | .th | Thailand | 1,086 | 621 | 57.2% | Thai | 34.3% |
| 17 | .eu | European Union | 23,035 | 11,427 | 49.6% | German | 11.4% |
| 18 | .rs | Serbia | 1,951 | 811 | 41.6% | Serbian | 35.1% |
| 19 | .ee | Estonia | 2,040 | 826 | 40.5% | Estonian | 49.0% |
| 20 | .ro | Romania | 7,097 | 2,848 | 40.1% | Romanian | 56.9% |
| 21 | .gr | Greece | 4,572 | 1,775 | 38.8% | Greek | 53.4% |
| 22 | .hr | Croatia | 2,252 | 809 | 35.9% | Croatian | 62.4% |
| 23 | .lt | Lithuania | 1,323 | 444 | 33.6% | Lithuanian | 62.1% |
| 24 | .be | Belgium | 9,298 | 2,842 | 30.6% | Dutch | 46.3% |
| 25 | .bg | Bulgaria | 1,444 | 430 | 29.8% | Bulgarian | 64.0% |
| 26 | .lv | Latvia | 1,195 | 353 | 29.5% | Latvian | 63.8% |
| 27 | .ar | Argentina | 4,928 | 1,452 | 29.5% | Spanish | 68.2% |
| 28 | .vn | Vietnam | 3,704 | 1,091 | 29.5% | Vietnamese | 68.3% |
| 29 | .nl | Netherlands | 42,240 | 12,368 | 29.3% | Dutch | 69.2% |
| 30 | .cn | China | 6,636 | 1,911 | 28.8% | Chinese | 50.0% |
| 31 | .ch | Switzerland | 13,674 | 3,940 | 28.8% | German | 51.5% |
| 32 | .se | Sweden | 8,525 | 2,384 | 28.0% | Swedish | 66.3% |
| 33 | .pt | Portugal | 3,916 | 1,098 | 28.0% | Portuguese | 68.6% |
| 34 | .mx | Mexico | 5,133 | 1,436 | 28.0% | Spanish | 68.6% |
| 35 | .de | Germany | 83,961 | 23,429 | 27.9% | German | 70.2% |
| 36 | .no | Norway | 4,347 | 1,213 | 27.9% | Norwegian Bokmål | 37.3% |
| 37 | .dk | Denmark | 8,971 | 2,181 | 24.3% | Danish | 71.8% |
| 38 | .cl | Chile | 4,109 | 984 | 23.9% | Spanish | 73.8% |
| 39 | .hu | Hungary | 7,400 | 1,757 | 23.8% | Hungarian | 73.0% |
| 40 | .il | Israel | 1,992 | 471 | 23.6% | Hebrew | 72.0% |
| 41 | .tr | Turkey | 3,507 | 813 | 23.2% | Turkish | 75.0% |
| 42 | .fi | Finland | 4,602 | 1,017 | 22.1% | Finnish | 74.6% |
| 43 | .sk | Slovakia | 3,696 | 786 | 21.3% | Slovak | 68.3% |
| 44 | .tw | Taiwan | 3,607 | 756 | 21.0% | Chinese | 68.0% |
| 45 | .at | Austria | 9,558 | 1,765 | 18.5% | German | 79.5% |
| 46 | .es | Spain | 10,841 | 1,913 | 17.6% | Spanish | 78.4% |
| 47 | .fr | France | 25,867 | 3,804 | 14.7% | French | 82.9% |
| 48 | .pl | Poland | 17,594 | 2,533 | 14.4% | Polish | 83.7% |
| 49 | .br | Brazil | 18,937 | 2,580 | 13.6% | Portuguese | 84.5% |
| 50 | .cz | Czechia | 12,536 | 1,597 | 12.7% | Czech | 83.5% |
| 51 | .kr | South Korea | 3,838 | 483 | 12.6% | Korean | 78.8% |
| 52 | .ua | Ukraine | 9,449 | 904 | 9.6% | Russian | 45.5% |
| 53 | .it | Italy | 6,726 | 623 | 9.3% | Italian | 89.3% |
| 54 | .jp | Japan | 20,911 | 1,466 | 7.0% | Japanese | 83.4% |
The spread from 98.3% (.au) to 7.0% (.jp) — a 91-point gap — is the single most important number in this table. It means the question "how much of the web is in English?" has no single answer. It depends entirely on which slice of the web you examine. On Australian domains, English is near-universal. On Japanese domains, English is a rounding error. The global aggregate of 64.3% obscures a variance so wide that it contains entirely different internets.
English Prevalence by Tier
| Tier | English % | ccTLDs | Count | Defining Pattern |
|---|---|---|---|---|
| English-native | >85% | .au, .nz, .ie, .uk, .za, .sg, .in, .ph, .ca, .io, .my, .us, .ai | 13 | Native speakers or colonial inheritance |
| English-majority | 50–85% | .hk, .id, .th | 3 | Commerce and post-colonial bilingualism |
| Bilingual/mixed | 30–50% | .eu, .rs, .ee, .ro, .gr, .hr, .lt, .be | 8 | EU integration, transitional economies |
| Local-dominant | 15–30% | .nl, .de, .se, .dk, .no, .ch, .vn, .ar, .mx, .pt, .bg, .lv, .hu, .il, .tr, .fi, .sk, .tw, .cn, .at, .es, .cl | 22 | Strong domestic language, English for commerce |
| Strong resistance | <15% | .fr, .pl, .br, .cz, .kr, .ua, .it, .jp | 8 | Large domestic internet ecosystems |
The largest tier is "local-dominant" at 22 ccTLDs — countries where the local language controls 65-80% of the namespace and English holds a stable 15-30% commercial minority. This is the equilibrium state for most of the world's internet: local language for local audiences, English for international commerce and technical content. The 8 "strong resistance" ccTLDs are the exception that proves the rule — these are countries with domestic internet economies large enough to sustain entirely local-language ecosystems.
The Colonial Footprint: English Where the Empire Built the Internet
The most striking pattern in the scorecard is not that English-speaking countries have English-language websites. It is that former British colonies — countries where English is spoken natively by a fraction of the population — show English prevalence rates indistinguishable from the Anglosphere itself.
| ccTLD | Country | English % | Population (M) | Native English Speakers (%) | Official Language Status |
|---|---|---|---|---|---|
| .in | India | 95.9% | 1,428 | ~0.02% | Co-official (with Hindi) |
| .sg | Singapore | 97.0% | 5.9 | ~37% | Official (one of four) |
| .ph | Philippines | 94.0% | 117 | ~0.05% | Official (with Filipino) |
| .za | South Africa | 97.2% | 62 | ~8.1% | Official (one of eleven) |
| .my | Malaysia | 88.8% | 34 | ~1.5% | Second language |
| .hk | Hong Kong | 66.7% | 7.5 | ~3.5% | Official (with Chinese) |
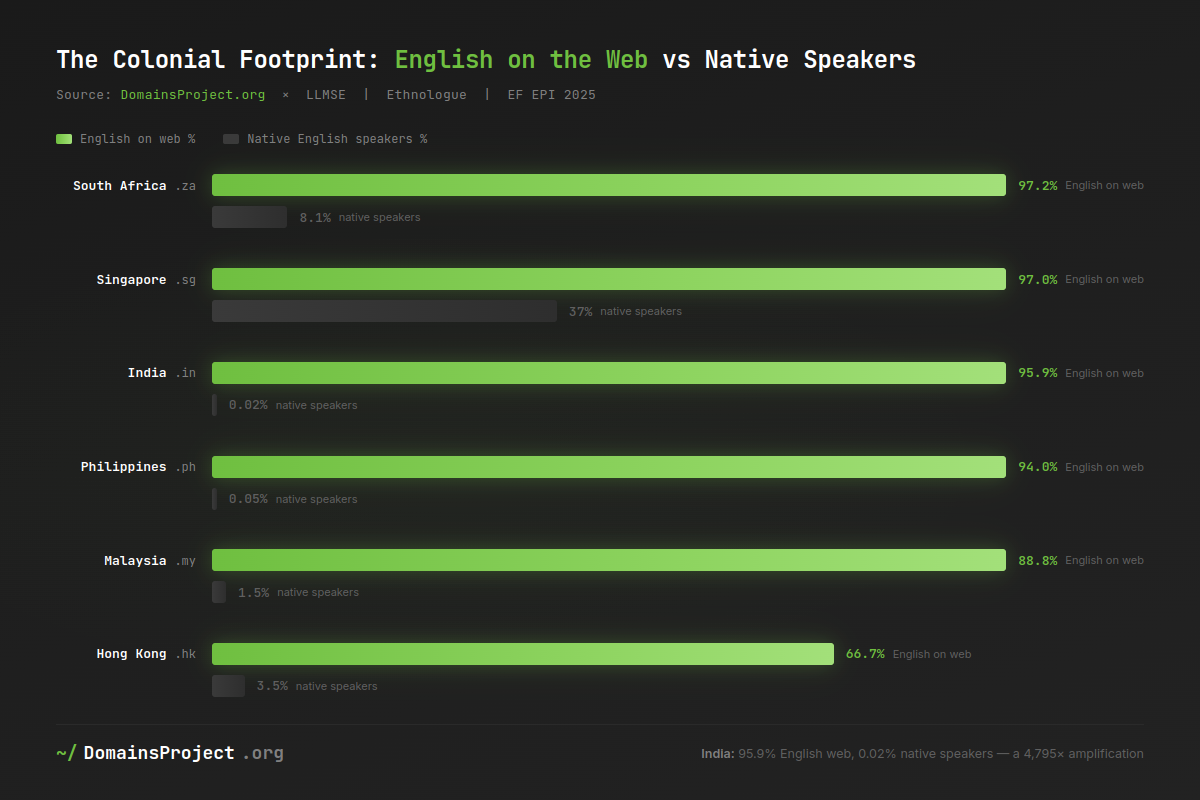
India is the defining case. With 1.4 billion people and roughly 260,000 native English speakers (0.02% of the population), India's .in domain space is 95.9% English. Hindi — spoken by 528 million people as a first language — accounts for 0.8% of classified .in websites. The disparity is not demographic. It is institutional. British colonial administration established English as the language of law, higher education, and central government. Post-independence India retained English as a co-official language precisely because it was no one's mother tongue — a neutral administrative register in a country with 22 scheduled languages. When India's formal-sector economy built its internet presence, it built it in the language its institutions already operated in.
The Philippines tells the same story with a different colonial path. English-medium instruction has been mandatory in Philippine schools since the Philippine Commission Act of 1901 — a US colonial policy that persisted through independence. Filipino and Tagalog dominate daily life, but the formal economy — banking, law, corporate communications — operates in English. Our data shows .ph at 94.0% English with Tagalog at just 2.1%. The gap between spoken language and web language is a colonial artifact preserved by institutional inertia.
Singapore at 97.0% English is the most complete example of post-colonial English assimilation. Singapore's language policy deliberately elevated English as the inter-ethnic lingua franca after independence in 1965, making it the medium of instruction across all government schools. Unlike India and the Philippines, where English coexists with dominant regional languages, Singapore engineered English into the operational foundation of the state. The 97.0% figure is not inherited passively — it reflects 60 years of deliberate policy.
South Africa at 97.2% presents an apparent paradox. English is the home language of only 8.1% of the population — behind Zulu (24.4%), Xhosa (16.3%), and Afrikaans (12.2%). Yet .za domains are 97.2% English, with Afrikaans registering at just 0.2%. The explanation follows the same institutional pattern: English dominates South African commerce, media, and digital communication despite being a demographic minority language. The domain data captures the formal-sector internet, which operates in the language of business, not the language of home.
The EF English Proficiency Index provides a useful triangulation point. South Africa scores 602 (13th globally, "Very High" proficiency) — consistent with strong institutional English. Malaysia at 581 (24th, "High" proficiency) aligns with our 88.8% English finding. The Philippines ranks 28th (score 569, "High" proficiency). Singapore was removed from the EF EPI in 2025 because EF reclassified it as a native English-speaking country — the strongest possible external validation of our 97.0% finding.
The post-colonial pattern is clear: in every former British colony with significant internet adoption, English prevalence on ccTLD domains exceeds 88%. This is not because these populations speak English at home. The data is consistent with a model where colonial-era institutions — law, finance, education, government — established English as the language of the formal sector, and the formal-sector internet inherited that default. The web reflects the language of institutions, not the language of people.
Commercial English: The Language of Global Trade Penetrates Local Namespaces
If colonial inheritance explains the >85% tier, a different mechanism operates in the 20-60% range. These are countries with no colonial relationship to English that nevertheless host substantial English-language web presences — driven not by institutional inheritance but by commercial necessity.
The Indonesia Anomaly
| ccTLD | Country | English % | English Speakers (est.) | EF EPI Rank |
|---|---|---|---|---|
| .id | Indonesia | 65.2% | ~10% | 80th (Low) |
| .th | Thailand | 57.2% | ~27% (tourism-influenced) | 116th (Very Low) |
| .hk | Hong Kong | 66.7% | ~53% (bilingual) | 39th (Moderate) |
Indonesia at 65.2% English is the most counterintuitive data point in the entire analysis. Indonesia has 270 million people, a national language (Bahasa Indonesia) with near-universal adoption, and an English proficiency level that the EF rates 80th globally in the "Low" band. Yet nearly two-thirds of classified .id websites are in English. Indonesian — a language spoken by virtually the entire population — accounts for only 32.8% of classified websites.
The data is consistent with a commercial driver: Indonesia's export-oriented businesses, e-commerce platforms targeting international buyers, and tourism infrastructure register English-language websites to reach global audiences. Indonesia's tech startup ecosystem — Tokopedia, Gojek, Traveloka — builds in English for investor visibility and regional expansion across Southeast Asia. The .id namespace is not a mirror of Indonesian society; it is a mirror of Indonesian commerce.
Thailand at 57.2% confirms the tourism and commerce hypothesis. Thailand ranks 116th out of 123 countries on the EF EPI — deep in the "Very Low" proficiency band. Yet over half of classified .th websites are in English. Thailand is Southeast Asia's largest tourism economy, receiving over 35 million international visitors in 2024. Hotels, tour operators, and hospitality businesses publish in English because their customers read English, even if their staff barely speak it.
The European Ceiling: Where English Stops at 30%
Across Northern and Western Europe — countries with "Very High" English proficiency on the EF EPI — English prevalence on ccTLD domains clusters in a remarkably narrow band:
| ccTLD | Country | English % | EF EPI Rank | EF EPI Score |
|---|---|---|---|---|
| .nl | Netherlands | 29.3% | 1st | 624 |
| .de | Germany | 27.9% | 4th | 615 |
| .se | Sweden | 28.0% | 8th | 609 |
| .no | Norway | 27.9% | 5th | 613 |
| .dk | Denmark | 24.3% | 7th | 611 |
| .fi | Finland | 22.1% | 12th | 603 |
| .at | Austria | 18.5% | 3rd | 616 |
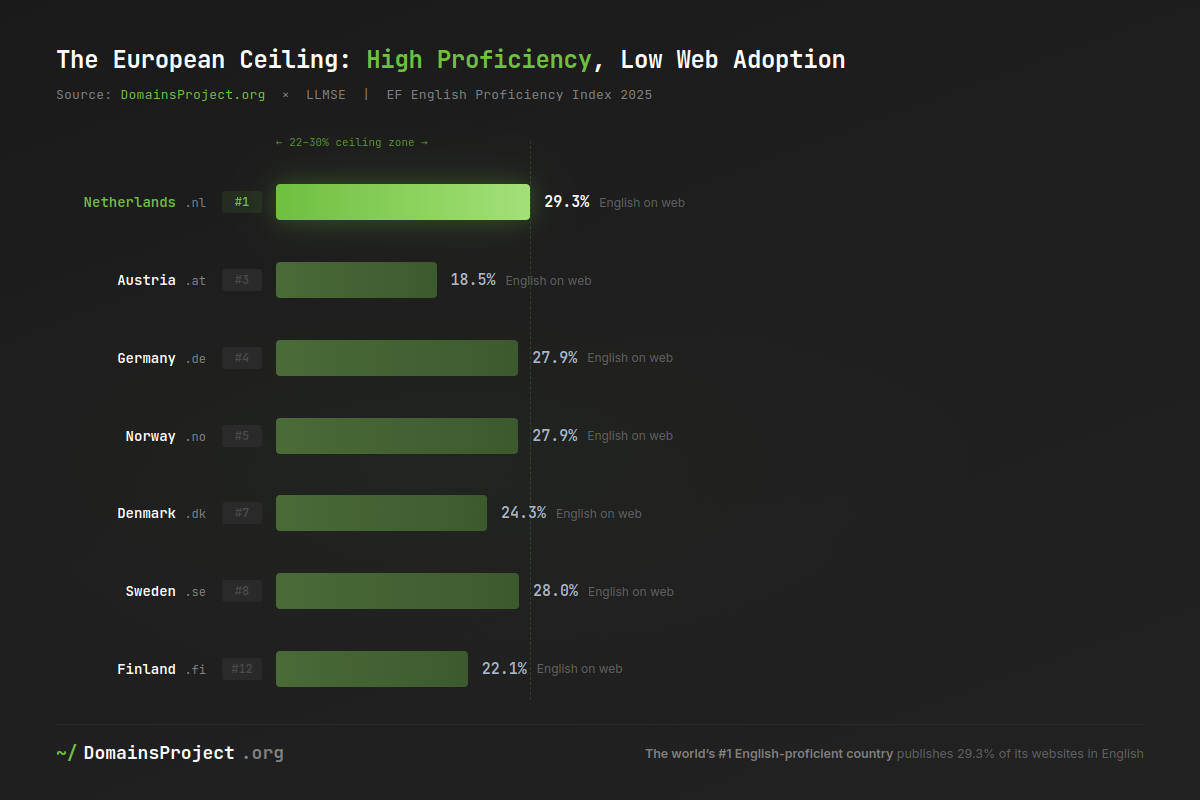
The Netherlands ranks first in the world for English proficiency — and .nl is only 29.3% English. Germany is fourth — and .de is 27.9%. The EF EPI measures population English ability; our data measures what language people actually choose for their websites. The gap reveals that the decision to publish in English is not determined by whether a population can speak English but by whether it needs to.
The Dutch, Germans, Swedes, Danes, Norwegians, and Finns are among the most English-proficient non-native populations on Earth. They overwhelmingly choose to publish their national websites in their national languages. English holds a stable 22-30% minority — the commercial and technical layer: international-facing businesses, tech companies, academic institutions, and export-oriented industries. The domestic internet — local businesses, government services, news media, community organizations — operates in the local language because its audience is local.
This 20-30% band appears to be the natural equilibrium point for English in countries with strong domestic languages and high English proficiency. Below this band, you find countries with either low English proficiency or large domestic internet ecosystems (or both). Above it, you find either former colonies or transitional economies integrating into global markets.
Language Resistance: Where the Domestic Internet Wins
At the bottom of the scorecard, eight ccTLDs show English prevalence below 15%. These are not small or underdeveloped internet markets — several host among the largest national domain namespaces in the world. Their low English percentages reflect internet economies that are large enough, and linguistically coherent enough, to function without English as a significant component.
| ccTLD | Country | English % | Local Language | Local % | Dataset Domains |
|---|---|---|---|---|---|
| .jp | Japan | 7.0% | Japanese | 83.4% | 42,409,543 |
| .it | Italy | 9.3% | Italian | 89.3% | 21,460,389 |
| .ua | Ukraine | 9.6% | Russian/Ukrainian | 85.0% | 5,603,693 |
| .kr | South Korea | 12.6% | Korean | 78.8% | 4,315,289* |
| .cz | Czechia | 12.7% | Czech | 83.5% | 10,517,658 |
| .br | Brazil | 13.6% | Portuguese | 84.5% | 33,955,472 |
| .fr | France | 14.7% | French | 82.9% | 20,515,453 |
| .pl | Poland | 14.4% | Polish | 83.7% | 16,304,968 |
*South Korea's primary domain namespace is co.kr; the .kr figure represents the broader ccTLD.
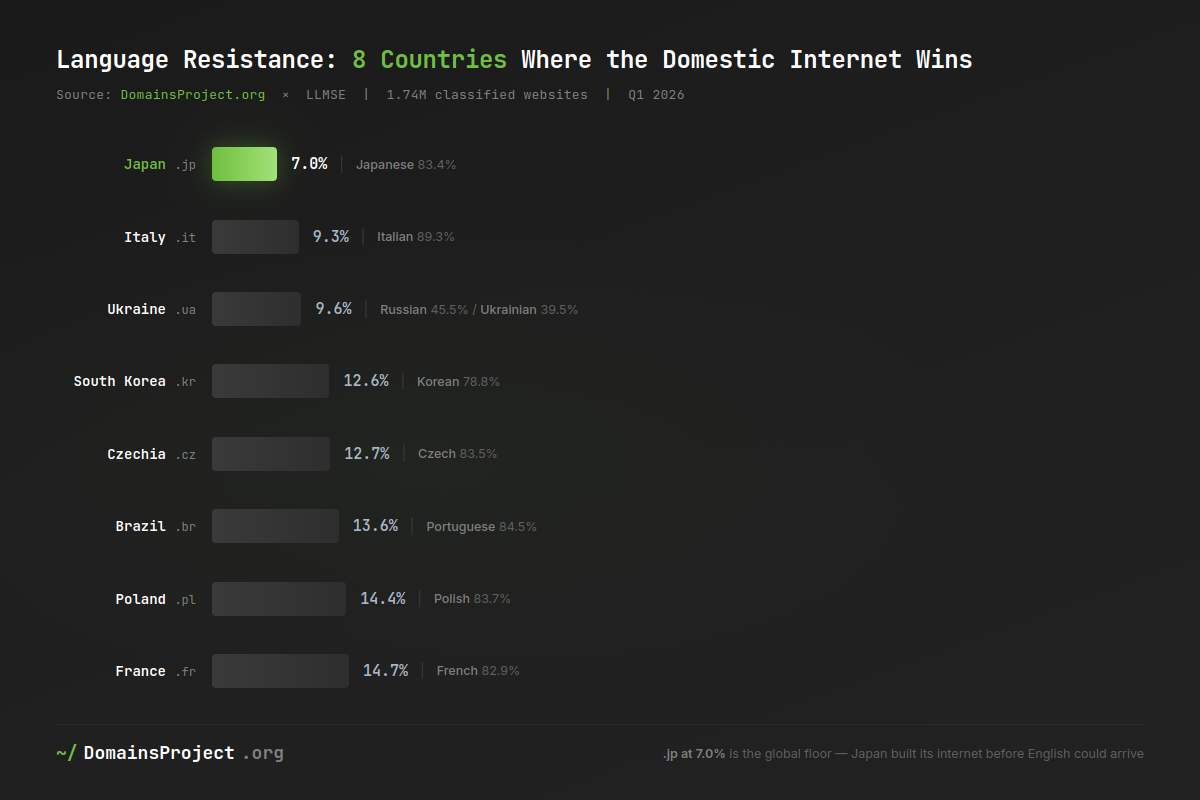
Japan at 7.0% is the global floor for English on a major ccTLD. Japan's resistance is structural, not merely cultural. The Japanese writing system — a combination of hiragana, katakana, and kanji — creates a natural barrier to English-language content production and consumption. More importantly, Japan built its domestic internet ecosystem early and comprehensively: Yahoo! Japan (launched 1996), Rakuten, Line, and NTT's portal infrastructure created a Japanese-language internet that captured the market before global English-language platforms could establish dominance. With 42.4 million domain records in the DomainsProject dataset, .jp is the world's fourth-largest ccTLD by our record count — an entire internet operating almost exclusively in Japanese.
France at 14.7% is the only country in the dataset whose low English penetration is partially legislated. The Toubon Law (Loi n° 94-665 of August 4, 1994) mandates French as the language of commerce, public services, and advertising. For businesses headquartered in France, all commercial communication — including websites promoting products or services — must be in French, with foreign-language content permitted only when accompanied by a French translation "as legible, audible, and intelligible as the foreign version." Non-compliance carries criminal penalties of €750 per offense for individuals and €3,750 for corporations. France is not merely culturally resistant to English — it has encoded that resistance into statute.
Brazil at 13.6% reflects the scale of a self-contained Portuguese-language internet. With 33.9 million domain records in the DomainsProject dataset, .br (including .com.br) is one of the world's largest national namespaces. Brazil's internet population — 181 million users — consumes content primarily in Portuguese, produced by domestic media conglomerates (Globo, Folha, UOL), e-commerce platforms (Mercado Livre, Magazine Luiza), and social networks where Portuguese is the default. The 13.6% English layer exists primarily in the tech sector and international-facing businesses.
Ukraine at 9.6% English presents a unique case — not because of low English, but because of what the remaining 90.4% reveals. The .ua language breakdown is 45.5% Russian, 39.5% Ukrainian, and 9.6% English. This is a wartime dataset. Our single-snapshot data cannot establish whether these proportions represent a shift or a longstanding equilibrium — longitudinal data would be required to make directional claims. What the snapshot does show is near-parity between Russian and Ukrainian on .ua domains, a distribution that external reporting on post-2022 language policy changes suggests may not have existed a decade ago, though we cannot confirm that from our data alone.
Accidental Englishes: When a TLD Escapes Its Country
Two ccTLDs in the >85% tier arrived there through a mechanism entirely unrelated to colonial history, commercial incentive, or language policy. They arrived there because developers thought the letters looked cool.
| ccTLD | Territory | Population | English % | Dataset Records | Actual Use |
|---|---|---|---|---|---|
| .io | British Indian Ocean Territory | ~3,000 (military) | 89.1% | 13,234,503 | Tech/developer namespace |
| .ai | Anguilla | ~15,753 | 86.9% | 3,450,000+ | AI/tech startup namespace |
.io at 89.1% English is the internet's most successful case of semantic hijacking. As we documented in our .io analysis, the British Indian Ocean Territory has no permanent civilian population. Its 13.2 million domain records exist because "I/O" — input/output — is the foundational abstraction of computer science, and developers adopted .io as an on-brand TLD for tech projects. The 89.1% English rate reflects the global developer community's language of work, not any territorial characteristic.
.ai at 86.9% followed an identical path a decade later, driven by the AI boom. Anguilla, a Caribbean island of 15,753 people, found its ccTLD adopted by AI startups, machine learning platforms, and tech companies seeking the ".ai" brand association. The 86.9% English rate reflects Silicon Valley's lingua franca projected onto a Caribbean country code.
These two ccTLDs are instructive because they reveal what happens when a domain namespace has no local population to set a language default: it defaults to the language of whoever adopts it first. In both cases, that was the English-speaking global tech industry.
Multilingual Complexity: English as the Language Nobody Chose
The final mechanism is the most structurally interesting: what happens when a domain namespace serves a population with no single dominant language? The data suggests English fills the vacuum — not as a chosen national language, but as the neutral default that no constituency objects to.
The .eu Paradox
| Language | .eu Share | EU Population Share (approx.) |
|---|---|---|
| English | 49.6% | ~1% (native), ~38% (any competence) |
| German | 11.4% | 18% (native) |
| French | 10.7% | 12% (native) |
| Polish | 5.5% | 8% (native) |
| Dutch | 5.2% | 5% (native) |
| Italian | 4.0% | 13% (native) |
| Spanish | 2.5% | 8% (native) |
| Czech | 2.3% | 2% (native) |
English at 49.6% of .eu domains is 4.3x the share of the next language (German at 11.4%) — despite English being the native language of roughly 1% of the post-Brexit EU population. Ireland and Malta are the remaining English-official member states, with a combined 5.5 million people in a union of 450 million. English persists on .eu not because EU citizens speak it at home, but because it functions as the EU's administrative lingua franca — the language of cross-border commerce, pan-European institutions, and multinational organizations. When a company registers a .eu domain, it chooses the language that the widest audience across 27 member states can read. That language is English, by default.
Belgium and Switzerland: National Multilingualism, English as Arbitrator
| Metric | .be (Belgium) | .ch (Switzerland) |
|---|---|---|
| Language 1 | Dutch 46.3% | German 51.5% |
| Language 2 | English 30.6% | English 28.8% |
| Language 3 | French 19.4% | French 14.8% |
| Language 4 | German 1.6% | Italian 1.8% |
In Belgium, English at 30.6% is the second most common language on .be domains — ahead of French (19.4%) in a country where French is one of two national languages. Belgium is officially trilingual (Dutch, French, German), with the population split roughly 60/40 between Dutch-speaking Flanders and French-speaking Wallonia. On .be domains, Dutch leads at 46.3% (consistent with Flanders' economic dominance), but English at 30.6% has displaced French from second place. English is not a Belgian language — it is the language Belgian businesses use when they want to be understood by both Flemish and Walloon audiences without choosing sides.
Switzerland shows the same pattern with a German tilt. German (51.5%) reflects the German-speaking majority, but English (28.8%) outperforms French (14.8%) and Italian (1.8%) — Switzerland's second and third official languages. In a country with four national languages, the commercially neutral option is none of them.
These multilingual cases reveal English's most subtle function on the internet: it is not the language people want to use. It is the language people use when using their own language would exclude part of their audience. In the EU, in Belgium, in Switzerland, English prevalence is a measure of linguistic fragmentation — the more languages a namespace must serve, the more it defaults to the one that offends no one.
What's at Stake
-
The 64.3% figure understates English dominance in commerce and technology. If the analysis were restricted to business-facing websites (excluding personal blogs, community sites, and government services), the English share would likely be significantly higher. The commercial internet is more English than the internet at large.
-
Post-colonial English prevalence on ccTLDs is nearly invisible in language policy debates. India's .in at 95.9% English means that the country's digital economy operates in a language spoken natively by 0.02% of its population. The implications for digital inclusion — access to information, government services, e-commerce — are structural and largely unexamined.
-
The 20-30% European ceiling suggests a stable equilibrium, not an expanding frontier. The Netherlands, Germany, and Scandinavia demonstrate that high English proficiency does not lead to English dominance on national domains. Population ability and web-publishing behavior are different variables. English's share of these namespaces is likely stable, not growing.
-
Japan, Italy, France, and Brazil demonstrate that linguistic resistance at scale is achievable — but only when a country has both a large domestic internet ecosystem and a commercially self-sufficient language. Countries with smaller internet economies and minority languages face a different equation: their content is either in English or invisible.
-
The .eu case is a leading indicator for supranational digital governance. If the EU's digital single market operates 49.6% in English post-Brexit, the question of whether EU digital regulation should privilege multilingualism or accept English as the de facto standard is no longer theoretical — the market has already answered.
-
LLMSE classification data at 1.74 million sites is the largest known language-by-TLD cross-reference. W3Techs surveys the top 10 million sites globally but does not break down by ccTLD. Our data provides a ccTLD-level view that has not previously been available at this scale.
What Would Help
1. Registries: publish language metadata in zone files. No ccTLD registry currently exposes the language of registered websites in its zone data. Adding a voluntary lang field to WHOIS/RDAP records would enable real-time linguistic monitoring of national namespaces without requiring external classification infrastructure.
2. CMS developers: default the lang attribute correctly. Our methodology relies on HTML lang attributes as the primary signal, but approximately 35% of websites either omit it or declare en by default. WordPress, Wix, Squarespace, and other major platforms should set the lang attribute based on the user's configured language, not the template's origin language. This is both an accessibility requirement (WCAG 3.1.1) and a data quality issue — the LLMSE classification pipeline would produce higher-confidence results with better source markup.
3. Researchers: normalize by ccTLD, not by global aggregate. The headline statistic that "English is 49.5% of the web" (W3Techs) or "64.3% of classified sites" (our data) is misleading without TLD-level disaggregation. English is 7.0% of the Japanese web and 98.3% of the Australian web — per-TLD breakdowns are available at /stats/. Any serious analysis of web language diversity must specify which namespace it is measuring.
4. Policymakers: examine the post-colonial English default on ccTLDs. India (.in at 95.9% English), the Philippines (.ph at 94.0%), and South Africa (.za at 97.2%) have formal-sector internet economies that operate almost exclusively in English despite multilingual populations. Digital inclusion initiatives should assess whether critical services — health information, government portals, legal resources — are accessible in the languages people actually speak, not just the language the web defaults to.
5. The EU: reconcile digital single market policy with the 49.6% .eu English reality. Post-Brexit, the EU's commitment to multilingualism is a stated policy goal but not a digital reality. If half of .eu domains default to English, digital regulation that assumes multilingual compliance may be building on a foundation that the market has already eroded.
This analysis is based on LLMSE language classification of 1,744,730 websites indexed during Q1 2026, cross-referenced with the DomainsProject dataset of over 600 million domain records across 244 country-code namespaces. Language detection uses HTML lang attribute extraction with computational linguistics fallback via the lingua library. External triangulation references the EF English Proficiency Index (2025 edition), W3Techs content language surveys (April 2026), and Ethnologue language data. The full DomainsProject dataset is available at /dataset. LLMSE classification data is accessible at llmse.ai. Country-level domain statistics are available at /stats/.