The web you can read does not look like the web that was registered. Browsers paper over this with friendly error pages, search engines silently drop the dead links, and the registries themselves report numbers that count registered — not resolving. Dig under those layers and you find that more of the web is gone than is still standing.
This is link rot at corpus scale. The phenomenon has been documented before — the Pew Research Center estimated in 2024 that 38% of web pages from 2013 had vanished, and the Internet Archive has been making the case since 1996 that the web is a graveyard with a search box. What has been missing is a registry-agnostic count: not "how many of my links broke" but "of every distinct hostname that ever resolved across every TLD on Earth, how much of it is still resolving today?"
We continuously crawl and index hostnames across every delegated TLD in the IANA root zone. Two artifacts come out of that pipeline. The master corpus (dump.txt) is the deduplicated union of every distinct hostname our crawler has observed across the project's history — currently 3,121,769,039 unique hostnames spanning 1,549 TLDs. The active snapshot (active170426.txt) is the deduplicated set of hostnames the crawler observed resolving in the most recent pass, dated 17 April 2026 — 1,470,645,938 unique hostnames across 1,409 TLDs. The set difference between the two is the dead web.
The arithmetic is unambiguous. Master minus active is 1,651,123,101 hostnames — 52.9% of every distinct hostname our crawler has ever recorded no longer resolves at all. The dead web is bigger than the live web by 180 million hostnames.
The headline: of the 3.12 billion unique hostnames ever observed in our dataset, 1.65 billion — 52.9% — no longer resolve as of 17 April 2026. .com alone accounts for 808 million dead hostnames, more than the active count of every TLD on Earth except .com and .net. The five Freenom-managed ccTLDs (.tk, .ml, .ga, .cf, .gq) are 98.94% extinct as a class — 28.3 million dead hostnames against 304,000 survivors. The new-gTLD program churns at 74.7% dead aggregate, and at 80%+ for the cheap-promo cohort (.top, .shop, .online, .site, .store, .blog, .bond). A small spine of restrictive ccTLDs — .jp 25.3%, .it 26.0%, .de 27.2% — sits at less than half the global dead ratio.
The Data
DomainsProject continuously crawls and indexes hostnames across every delegated TLD in the IANA root zone. For this analysis the snapshot used breaks down as follows.
| Category | Count | Coverage |
|---|---|---|
| TLDs in master corpus | 1,549 | All-time master union |
| TLDs in April 2026 active crawl | 1,409 | 91.0% of historical TLDs still produce ≥1 active hostname |
| Total unique hostnames ever observed | 3,121,769,039 | ~/WORK/dump.txt |
| Active hostnames (snapshot 17 Apr 2026) | 1,470,645,938 | ~/WORK/active170426.txt |
| Dead hostnames (in master, not in active) | 1,651,123,101 | 52.89% of observable web |
| TLDs that are 100% dead (zero active hostnames) | 143 | Sum 10,081 hostnames; e.g. .jcp, .baidu, .linde |
The 3.12B master count exceeds the 2.33B figure published in our March 2026 stats dashboard because the dashboard was generated before the April 2026 crawl was merged into the master union. The April 2026 crawl itself added previously unseen hostnames to the master, and many older crawl entries dropped out of the active set — both directions contribute to the gap between every distinct hostname ever observed and every distinct hostname observed in this pass.
Methodology
What "dead" means in this post. A hostname is dead if it appears in the master corpus (it resolved at some point during the project's crawl history) but does not appear in the 17 April 2026 active snapshot (it did not resolve during that pass). This definition is deliberately broad. It conflates several distinct failure modes: NXDOMAIN responses, SERVFAIL/timeout, registrar-deleted domains, expired-and-not-renewed registrations, registry-suspended domains, name-server-removed hostnames, registrar holding pages that briefly showed an A record then disappeared, and hostnames whose authoritative servers became unreachable. We do not split these out; the post measures non-resolution, not cause of non-resolution. Splitting the failure modes would require a fresh DNS resolution pass against 1.65 billion hostnames against multiple resolvers in multiple geographies — a six-month project, not a blog post.
What "active" means. A hostname is active if our 17 April 2026 crawl observed it returning a successful DNS lookup with at least one resolvable record (A, AAAA, or CNAME chain terminating in a usable address). Parked pages and registrar holding pages count as active so long as the DNS chain resolves; we are not measuring web liveness, we are measuring DNS liveness.
Hostname, not apex. This post counts hostnames, not registered second-level (apex) domains. www.example.com, example.com, and mail.example.com are three hostnames; if all three resolve, they all count as active; if mail.example.com stops resolving they count as 2 active and 1 dead, even if the underlying registration of example.com is unchanged. The hostname-level cut is the right granularity for this question because the dataset itself is hostname-level: the crawler observes a hostname resolving in the DNS and records that hostname. Aggregating to the apex level would require public-suffix-aware processing of 84 GB of text and would conflate "the registration was dropped" with "two of the seven subdomains under this still-registered apex no longer resolve" — both real signals, but distinct signals.
TLD classification. We bucket the 1,549 master TLDs into four categories using the project's existing classifier:
- Legacy gTLDs (22 TLDs): the pre-2012 generic TLD set:
.com,.net,.org,.edu,.gov,.mil,.int,.info,.biz,.name,.pro,.aero,.coop,.museum,.travel,.jobs,.mobi,.tel,.cat,.asia,.post,.xxx. - ccTLDs (249 TLDs): every two-letter TLD (Latin-script country codes per ISO 3166).
- IDN ccTLDs (148 TLDs): Punycode-encoded country-code TLDs starting with
xn--. - New gTLDs (1,130 TLDs): every other generic TLD, primarily delegations from the post-2012 ICANN new gTLD program.
Set arithmetic. The dead count is computed as count(dump.txt by TLD) − count(active170426.txt by TLD) per TLD, summed for the global figure. We extracted the rightmost label of each hostname with awk -F. '{print $NF}' and aggregated counts in a hash. The two counter passes are independent of each other; their sums must add up to 4.59 billion total hostname records (3.12B master + 1.47B active) and they do, modulo a 12-hostname discrepancy where the active snapshot contains TLDs (.kids, .music, .xn--4dbrk0ce) that were delegated after the master corpus was last consolidated. We round the global dead count to 1.65 billion in the body of the post.
Known limitations.
- We do not split direct from second-level zones (
example.co.ukandexample.ukcount under.uk;example.com.brandexample.brcount under.br). The TLD-level dead-ratios in this post are aggregate over all sub-zones of the TLD; a per-zone breakdown is feasible but out of scope here. - The crawler's discovery surface biases toward hostnames linked from the open web. Domains that were never publicly linked, never returned a redirect or a certificate, or were used only inside private networks are systematically under-observed in the master and therefore under-counted in both numerator and denominator of the dead ratio.
- Brand TLDs that were delegated, lightly used, and returned to ICANN show as 100% dead — which is correct in the strict sense but elides the underlying lifecycle (many were never meant for third-party registration). We flag the largest such cases (
.jcp,.baidu,.linde) explicitly rather than letting them inflate the new-gTLD dead ratio. - We do not distinguish between hostnames that died because the registration lapsed and hostnames that died because a subdomain was retired but the apex is still live. Both count as dead in our cut. The ratio of subdomain-retirement to registration-lapse is itself a research question and we do not attempt to estimate it here.
Reproducibility. The aggregation in this post is a single GNU awk pass per file:
awk -F. '{c[$NF]++} END {for(k in c) print c[k]"\t"k}' dump.txt
awk -F. '{c[$NF]++} END {for(k in c) print c[k]"\t"k}' active170426.txt
The full active dataset is publicly available at domainsproject.org/dataset. The full master corpus is available to subscribers.
The Scorecard
Global Active vs. Dead
| Metric | Hostnames | Share |
|---|---|---|
| Master corpus (ever observed) | 3,121,769,039 | 100.0% |
| Active (snapshot 17 Apr 2026) | 1,470,645,938 | 47.1% |
| Dead (no longer resolves) | 1,651,123,101 | 52.9% |
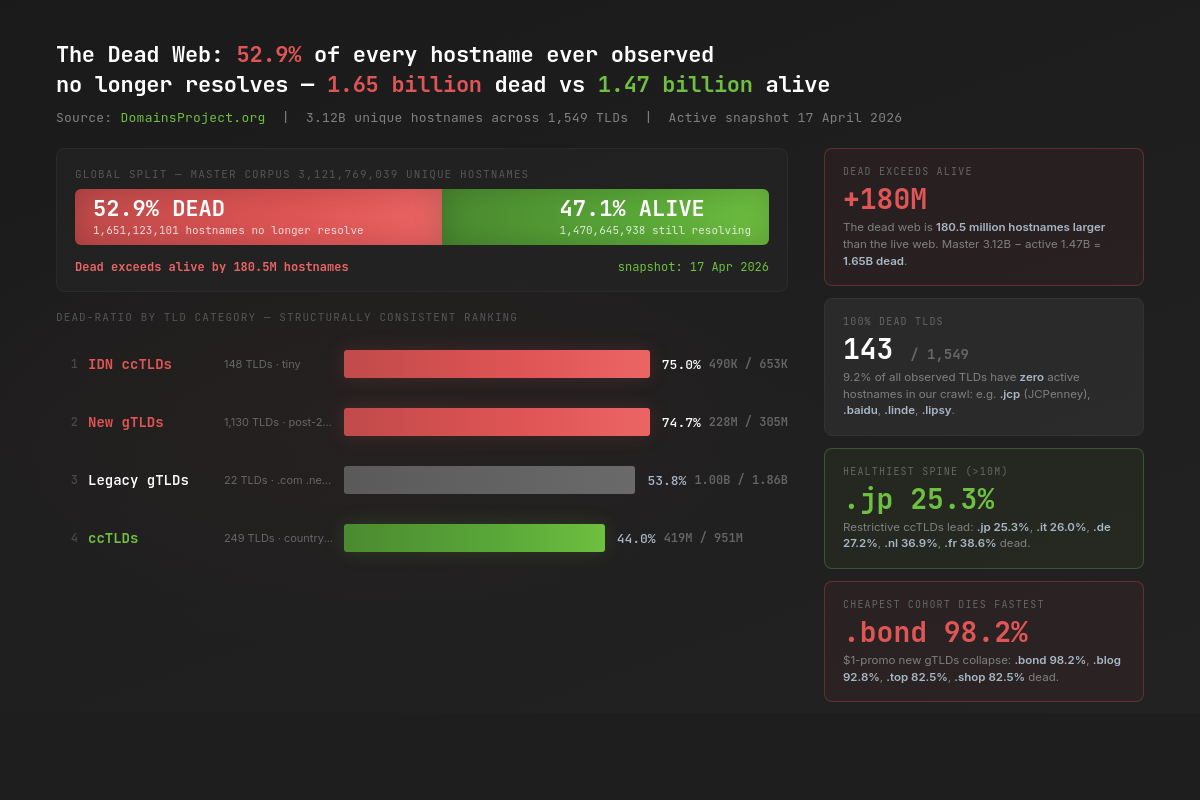
Half the observable internet is a graveyard. The dead web exceeds the live web by 180.5 million hostnames. The number is not a sampling artifact: the master corpus is the deduplicated union of every hostname our crawler has resolved at any point, and the active snapshot is the deduplicated set of hostnames our crawler resolved this April. Every hostname is counted exactly once in each set. The set difference is the dead set, and it is the larger of the two.
By TLD Category
| Category | TLDs | Total observed | Active | Dead | Dead % |
|---|---|---|---|---|---|
Legacy gTLDs (.com, .net, .org, ...) |
22 | 1,864,779,303 | 860,599,378 | 1,004,179,925 | 53.8% |
| ccTLDs (Latin-script country codes) | 249 | 951,237,635 | 532,727,193 | 418,510,442 | 44.0% |
| New gTLDs (post-2012) | 1,130 | 305,099,307 | 77,156,301 | 227,943,006 | 74.7% |
| IDN ccTLDs (Punycode) | 148 | 652,794 | 163,054 | 489,740 | 75.0% |
| Global | 1,549 | 3,121,769,039 | 1,470,645,926 | 1,651,123,113 | 52.9% |
The dead-ratio is structural. The four buckets are within a consistent ranking — restrictive country-coded namespaces decay slowest; the post-2012 generic experiment decays fastest. The new-gTLD bucket is roughly 70% larger by dead share than the ccTLD bucket. Inside the legacy bucket, .com (60.5% dead) drags the average up; .net (30.2% dead) — overwhelmingly composed of ISP reverse-DNS infrastructure that retains its address blocks for years — drags it down. If the new-gTLD program had decayed at the same rate as the ccTLD bucket, there would be 94 million more living hostnames on the internet today.
The Freenom collapse is the tail that wags the ccTLD dog. Excluding the five Freenom-managed ccTLDs, the ccTLD bucket sits at 42.3% dead — nearly identical to the headline ratio. With Freenom included, the ccTLD bucket inherits 28.3 million extra dead hostnames against only 300K Freenom survivors. We treat the Freenom cohort as its own deep-dive section below.
Top 10 TLDs by Absolute Dead Hostname Count
| Rank | TLD | Total observed | Active | Dead | Dead % |
|---|---|---|---|---|---|
| 1 | .com |
1,337,184,722 | 528,736,809 | 808,447,913 | 60.5% |
| 2 | .net |
399,079,131 | 278,704,738 | 120,374,393 | 30.2% |
| 3 | .org |
72,589,053 | 30,383,877 | 42,205,176 | 58.1% |
| 4 | .cn |
50,689,903 | 17,852,418 | 32,837,485 | 64.8% |
| 5 | .xyz |
49,125,229 | 17,548,444 | 31,576,785 | 64.3% |
| 6 | .de |
115,594,837 | 84,113,882 | 31,480,955 | 27.2% |
| 7 | .br |
49,553,903 | 24,619,365 | 24,934,538 | 50.3% |
| 8 | .top |
27,118,774 | 4,737,853 | 22,380,921 | 82.5% |
| 9 | .uk |
43,044,773 | 21,056,742 | 21,988,031 | 51.1% |
| 10 | .jp |
73,346,517 | 54,773,331 | 18,573,186 | 25.3% |
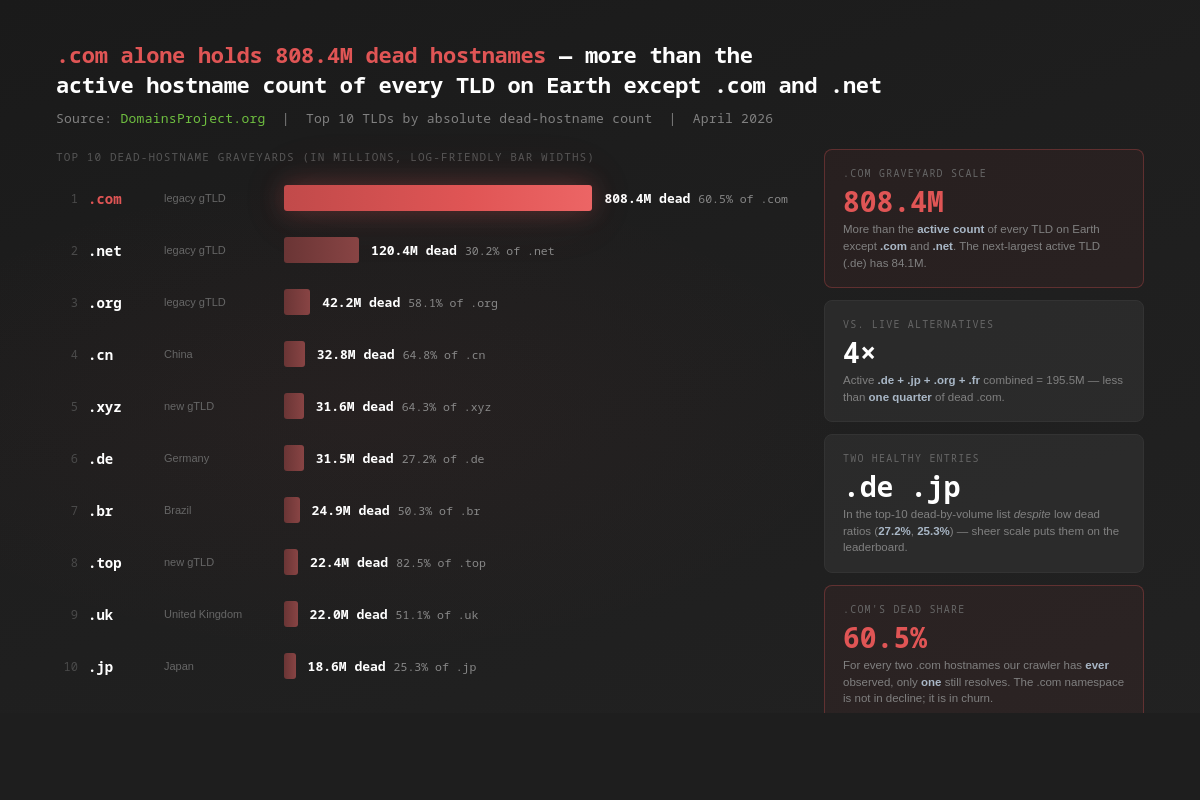
.com's dead hostname count exceeds the active hostname count of every TLD on Earth except .com and .net. Put differently: .com's graveyard alone is bigger than every other TLD's living web combined, with two exceptions. Active .de (84.1M), active .jp (54.8M), active .org (30.4M), and active .fr (26.2M) — added together — total 195.5M, less than a quarter of the dead .com count. The scale of the .com graveyard is a structural consequence of .com's scale: when 43% of the entire dataset is one TLD, that TLD also contributes the majority of the dataset's death.
.de and .jp show up in the top 10 despite having unusually low dead ratios (27.2% and 25.3%). They are on the list because they are simply enormous in absolute terms — the third- and fourth-largest TLDs in our dataset. Healthy decay on a very large base still produces a lot of dead hostnames in absolute count.
.org's position at #3 (42.2M dead, 58.1% dead) is the clearest illustration of the legacy-gTLD pattern. The original "non-profit" TLD has been treated as a generic alternative to .com for decades; its death curve mirrors .com's, not .museum's.
The .com Graveyard: 808 Million Hostnames That Stopped Resolving
.com carries the largest absolute dead count of any TLD by an enormous margin — 808.4 million dead hostnames against 528.7 million active. More than 60% of every .com hostname our crawler has ever observed has stopped resolving. The total .com master count of 1.34 billion hostnames is itself an extraordinary number: it is the union of every direct registration plus every observed subdomain plus every CDN edge node plus every ISP customer-portal hostname plus every short-lived campaign hostname that was advertised once and dropped. The Verisign registry currently reports approximately 161 million registered second-level .com domains; our 1.34B count is 8.3× larger because it counts hostnames, not registrations, and integrates the full project crawl history.
A few patterns drive the 808M dead count.
Subdomain churn dominates. Modern web stacks generate ephemeral hostnames at scale: per-customer subdomains on SaaS platforms, per-deployment preview URLs on Vercel/Netlify/Heroku, per-region CDN edges, per-tenant subdomains on shared hosting, per-A/B-test hostnames on marketing platforms. Each of these resolves for the duration of its commercial life, then quietly stops resolving when the customer churns or the campaign ends. The underlying .com apex registration may still be perfectly live; the specific hostname is not.
Domain drops. Verisign's 2024 published create rate is on the order of 1.4 million .com domains per month, against a roughly comparable delete rate. The annual churn cohort — domains registered in year n and deleted in year n+1 — is in the tens of millions, and every hostname the crawler observed under each dropped registration enters the dead set when the registration ends.
Phishing and abuse cleanup. .com has been the most-abused TLD in absolute terms for over a decade. APWG and Spamhaus statistics consistently show .com carrying tens of millions of phishing and spam hostnames per year, the bulk of which are taken down within days of detection. Every taken-down hostname graduates to the dead set on the next crawl.
Acquisition collapses and brand consolidations. When companies acquire other companies and consolidate the surviving brand to a single hostname, the redirected (and eventually retired) brand subdomains fall off the active list. Aggregated across two decades of M&A, this is a measurable contributor to .com's dead share.
.com's 60.5% dead ratio is structurally higher than the ccTLD average (44.0%) for the same reasons that drive its absolute dead count: subdomain proliferation under permissive registration rules and a long tail of ephemeral usage that decays fast. The .com namespace is not in decline — Verisign's quarterly numbers continue to grow, and our 528.7M active .com hostnames is the single largest active contribution to the observable web of any TLD. But for every two hostnames that have ever lived under .com, only one is still resolving.
The Freenom Mass Extinction, in Numbers
The five ccTLDs that Freenom B.V. (Amsterdam) operated under free-registration models — .tk (Tokelau), .ml (Mali), .ga (Gabon), .cf (Central African Republic), and .gq (Equatorial Guinea) — collectively carry 28.6 million hostnames in the master corpus. Of those, 303,978 hostnames are still resolving as of 17 April 2026. The Freenom cohort, as a class, is 98.94% dead.
| TLD | Country | Total observed | Active | Dead | Dead % |
|---|---|---|---|---|---|
.tk |
Tokelau | 7,176,995 | 110,073 | 7,066,922 | 98.5% |
.ml |
Mali | 5,888,599 | 56,566 | 5,832,033 | 99.0% |
.ga |
Gabon | 5,892,997 | 33,377 | 5,859,620 | 99.4% |
.cf |
Central African Republic | 5,180,204 | 65,428 | 5,114,776 | 98.7% |
.gq |
Equatorial Guinea | 4,488,877 | 38,534 | 4,450,343 | 99.1% |
| Freenom total | 28,627,672 | 303,978 | 28,323,694 | 98.94% |
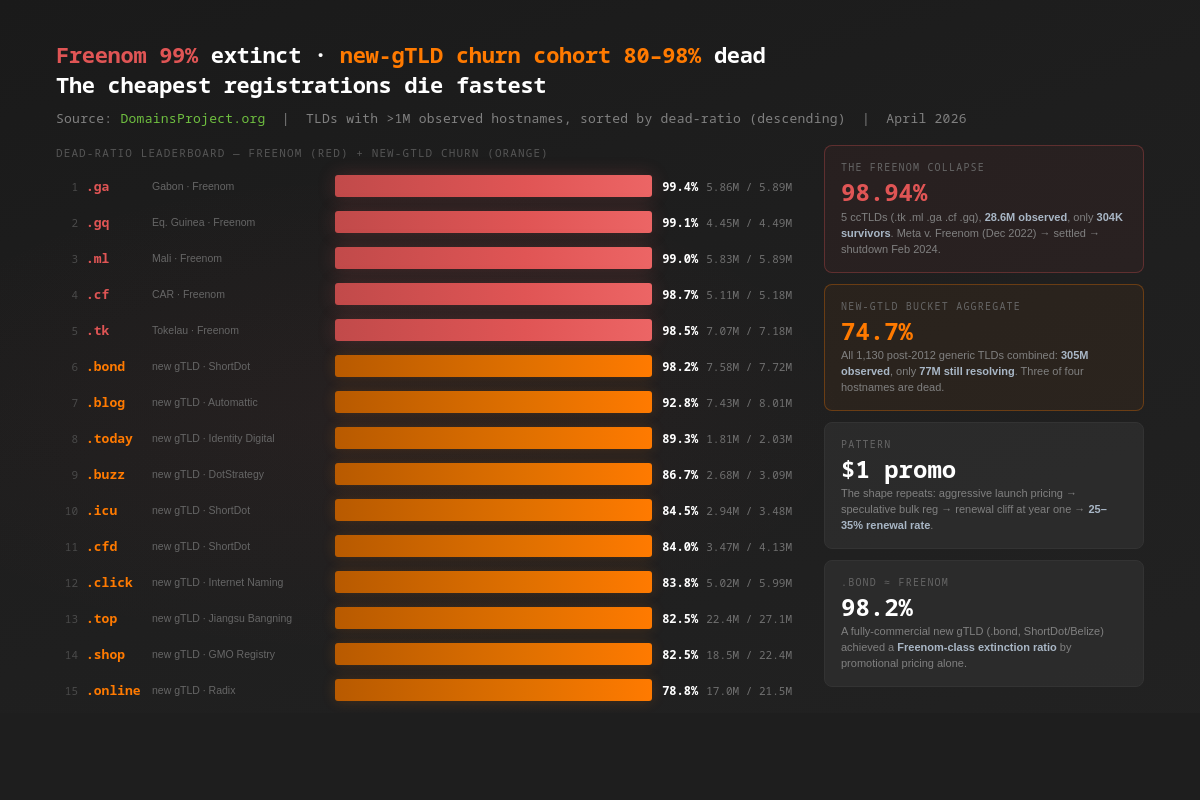
This is the cleanest mass-extinction event in the entire dataset. The chronology is well-documented and we covered it in Tiny Islands, Massive TLDs: Joost Zuurbier's OpenTLD B.V. signed the Tokelau registry agreement in 2001, launched the free-registration model in approximately 2006, peaked at 31.3 million .tk registrations in 2016 (then the world's largest ccTLD), drew sustained abuse-rate criticism through the late 2010s (the "Freenom Effect" Spamhaus reports of 2019–2022), was sued by Meta for $500M in December 2022 over a phishing infrastructure that allegedly impersonated Facebook and Instagram, settled the suit in early 2024, and ceased operations in February 2024. Tokelau took back direct administration of .tk in March 2024 and immediately purged 12.6 million domains. Mali, Gabon, CAR, and Equatorial Guinea each separately moved toward direct administration; Freenom's affiliated free-registration platforms were either closed or de-listed.
The dataset records this. The .tk master count of 7.18M is roughly 23% of the 31.3M peak — most of the peak never even made it into our crawl at all, because the largest peaks were short-lived spam clusters that were taken down before our crawler reached them. Of the 7.18M that did make it in, only 110K are still resolving. The .ga cohort shows the cleanest extinction ratio at 99.43%; .ml and .gq are within rounding distance.
The Freenom story is, in retrospect, the canary in the coal mine for the broader free-or-near-free domain economics. When the marginal cost of registering a domain is zero, the marginal cost of abandoning it is also zero, and the dead-ratio approaches one as the abandonment rate dominates the use rate. Five ccTLDs, three continents, ~155,000 combined population — and a 98.94% dead ratio after the commercial backstop disappeared.
The New-gTLD Renewal Cliff
Excluding the Freenom ccTLDs, the highest dead ratios in the dataset cluster in the post-2012 new-gTLD program. ICANN delegated approximately 1,200 new gTLDs starting in 2013; our master corpus has observed 1,130 of them at non-zero counts. Their aggregate dead ratio is 74.7% — three out of every four new-gTLD hostnames our crawler has ever observed no longer resolves.
The pattern within the new-gTLD bucket is bimodal. A small cohort of unsponsored generic TLDs has held up — the .xyz, .club, and brand-friendly TLDs that secured serious second-level adoption. The larger cohort sits in a recognizable churn pattern: $1–2 first-year promotional pricing, $20–40 renewal pricing, and a 25–35% renewal rate after year one. The dead ratios across this cohort are diagnostic.
| TLD | Total observed | Active | Dead | Dead % |
|---|---|---|---|---|
.bond |
7,720,592 | 135,828 | 7,584,764 | 98.2% |
.blog |
8,009,164 | 577,552 | 7,431,612 | 92.8% |
.today |
2,030,791 | 217,511 | 1,813,280 | 89.3% |
.buzz |
3,088,202 | 410,320 | 2,677,882 | 86.7% |
.lat |
1,507,949 | 207,239 | 1,300,710 | 86.3% |
.icu |
3,476,861 | 539,792 | 2,937,069 | 84.5% |
.cfd |
4,133,273 | 661,713 | 3,471,560 | 84.0% |
.click |
5,990,831 | 969,878 | 5,020,953 | 83.8% |
.cyou |
1,867,564 | 310,483 | 1,557,081 | 83.4% |
.fun |
3,389,021 | 572,924 | 2,816,097 | 83.1% |
.top |
27,118,774 | 4,737,853 | 22,380,921 | 82.5% |
.shop |
22,403,275 | 3,921,912 | 18,481,363 | 82.5% |
.online |
21,542,677 | 4,576,231 | 16,966,446 | 78.8% |
.store |
10,601,612 | 2,328,368 | 8,273,244 | 78.0% |
.site |
15,924,966 | 3,522,805 | 12,402,161 | 77.9% |
.bond at 98.2% dead is statistically indistinguishable from a Freenom ccTLD. The TLD has been delegated since 2014 and was operated by ShortDot (Belize) under aggressive promotional pricing aimed at the speculative-registration aftermarket. 7.7 million observed hostnames have collapsed to 135,828 survivors — the same 1–2% survival pattern that Freenom produced when free registration met no-questions-asked policy.
.blog at 92.8% dead — operated by Knock Knock WHOIS There LLC, a subsidiary of Automattic (WordPress) — sits in the same band despite materially different commercial positioning. Automattic uses .blog extensively for itself (*.blog.WordPress.com redirects, branded campaign hostnames, customer subdomain demos) and the death rate reflects the rapid retirement of those promotional structures more than failed third-party registrations. The headline ratio is the same nonetheless: 7.4 million dead hostnames against 577K survivors.
.top and .shop (both 82.5% dead) sit at the joint of speculative registration and aggressive launch promotions. .top, operated by Jiangsu Bangning Science & Technology (China), pursued a $1-renewal pricing strategy aggressively in 2016–2019 and reached 4.4M registrations at peak; the surviving 4.7M active hostnames in our crawl is broadly consistent with that registration base, but the 27.1M total observed hostnames demonstrates the multi-year accumulation of subdomains that the renewal cliff has flushed. .shop (operated by GMO Registry, Japan) shows the same shape: the namespace has been heavily marketed to e-commerce, but most of the registered hostnames did not survive the first renewal.
The implication for ICANN's Round 2. ICANN's second new-gTLD application round opens in April 2026, with delegation expected to begin in 2027. The 2012 round's headline outcome was that a few TLDs (.xyz, .online, .shop) reached scale; the 2026 dataset shows that for the cohort as a whole, three out of every four hostnames ever observed under those TLDs have stopped resolving. This is not a verdict on the program — .xyz reached 49 million observed hostnames, .shop 22 million, several reached 10M+ — but it is a verdict on the durability of those numbers. The new-gTLD program produced a lot of registrations. It produced a much smaller set of long-lived hostnames.
The Healthy Spine: Where Restrictive Registries Bend the Curve
The TLDs with the lowest dead ratios at scale form a coherent set: established European and East Asian ccTLDs operated by national, cooperative, or state-adjacent registries with restrictive registration policies, identity-verification requirements, and strong domestic-market dominance.
| TLD | Country | Total observed | Active | Dead % |
|---|---|---|---|---|
.jp |
Japan | 73,346,517 | 54,773,331 | 25.3% |
.it |
Italy | 32,712,014 | 24,219,468 | 26.0% |
.de |
Germany | 115,594,837 | 84,113,882 | 27.2% |
.net |
global gTLD (ISP rDNS) | 399,079,131 | 278,704,738 | 30.2% |
.pl |
Poland | 29,068,851 | 19,565,220 | 32.7% |
.es |
Spain | 14,566,535 | 9,555,060 | 34.4% |
.nl |
Netherlands | 35,972,309 | 22,692,207 | 36.9% |
.fr |
France | 42,688,406 | 26,200,172 | 38.6% |
.au |
Australia | 31,918,735 | 18,391,826 | 42.4% |
.ca |
Canada | 21,682,475 | 11,809,833 | 45.5% |
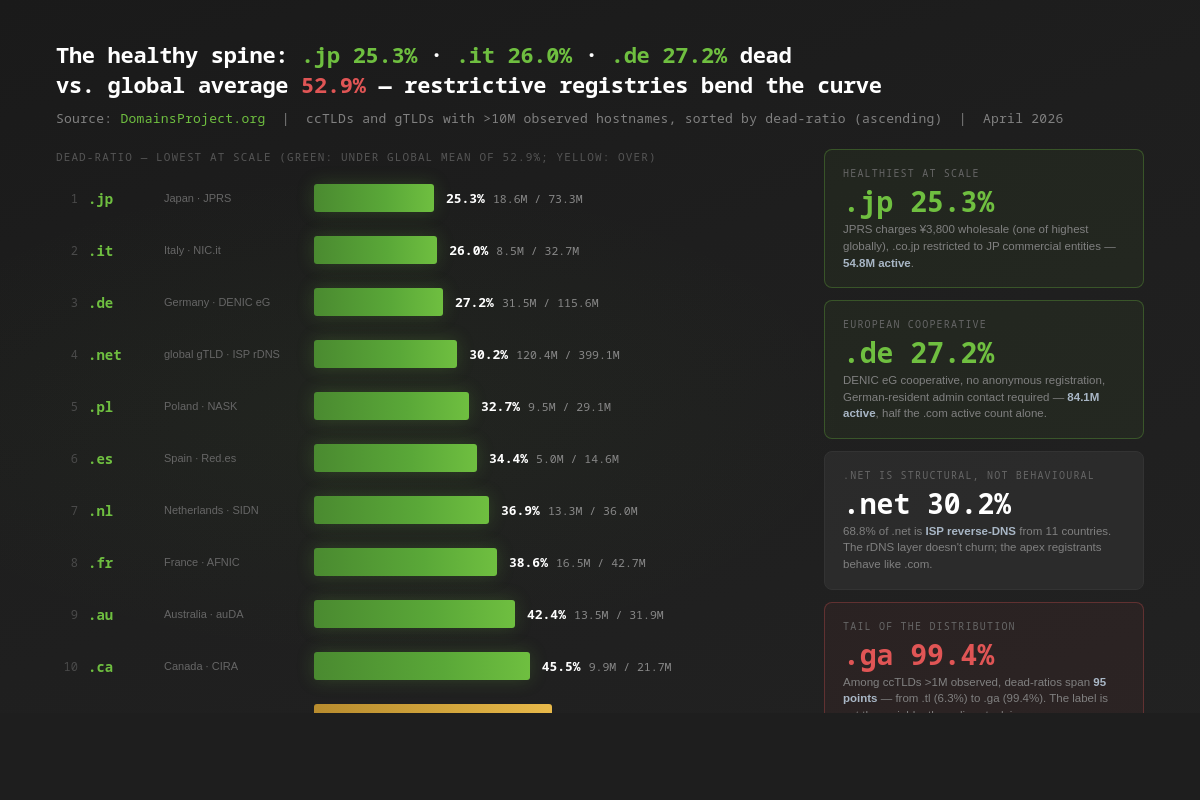
Restrictive registration correlates with low dead ratios at scale. .jp (operated by JPRS at ¥3,800 — among the highest wholesale fees globally; .co.jp restricted to Japanese commercial entities), .it (registered by NIC.it under verified-eligibility rules until 2004 and still requiring a stable contact for natural persons), .de (DENIC cooperative, no anonymous registration, German-resident admin contact required for years), and .nl (SIDN, registrar-scorecard incentives that punish abuse) all sit below 30% dead. .fr (AFNIC, identity-verified pre-2011, EU/EEA-restricted post-2011 until further liberalization) sits at 38.6%, still 14 points below the global mean.
The pattern is not "all ccTLDs are healthy." Among ccTLDs with more than one million observed hostnames, the dead ratios span a 95-point range — from .tl (Timor-Leste, 6.3% dead) to .ga (Gabon, 99.4% dead). What separates the spine from the tail is not the ccTLD label; it is the policy stack underneath it. Where the registry charges enough to make speculative bulk registration uneconomic, requires identity verification on at least the contact role, and runs an abuse-response apparatus, the dead ratio bends downward. Where the registry charges nothing and asks no questions, the dead ratio approaches one as the abandonment rate dominates use.
.net's presence in this list is the surprise. At 30.2% dead, the second-largest TLD by observed hostnames is statistically as healthy as .de. This is not a story about .net registrants being more careful than .com registrants. It is a story about composition: 68.8% of .net hostnames in our prior research are ISP reverse-DNS entries from 11 countries (Comcast 47M, HiNet 20.2M, Virgin Media 15.5M, SFR/Free 17.6M, Telefónica 9.8M, etc.), and ISP reverse-DNS hostnames sit at the low end of the churn distribution because the underlying /16 and /8 blocks are reassigned only on multi-year cycles. The .net apex registrants behave like .com registrants and produce a similar dead ratio; the ISP reverse-DNS layer drags .net's aggregate dead ratio down.
The Brand-TLD Cemetery
A hundred and forty-three TLDs in our master corpus have zero active hostnames — every observation we ever made under them is now dead. The aggregate is small (10,081 hostnames), but the list is instructive.
| TLD | Total observed | Notes |
|---|---|---|
.jcp |
7,592 | JCPenney brand TLD — JCPenney filed Chapter 11 in May 2020, the brand TLD followed |
.bv |
191 | Bouvet Island ccTLD — uninhabited Norwegian Antarctic territory; has never been opened to public registration |
.sj |
162 | Svalbard and Jan Mayen ccTLD — Norwegian Arctic; same closed-registration policy as .bv |
.linde |
123 | Linde plc industrial-gases brand TLD — quietly retired |
.lipsy |
111 | Lipsy London fashion-brand TLD |
.baidu |
111 | Baidu corporate brand TLD |
| 137 other TLDs | <100 each | Mostly retired brand TLDs (corporate consolidations, IPO failures, ICANN withdrawals) |
The brand-TLD cohort decays fast under either of two pressures. Corporate failure (JCPenney's Chapter 11 in May 2020 produced a 100% dead .jcp namespace within four years). And quiet corporate retirement, where a brand simply stops paying ICANN's $25,000 annual fee for a TLD nobody used and ICANN's standard process retires the delegation; the long tail of fully-dead .linde, .lipsy, .baidu-class brand TLDs is dominated by this lifecycle.
The .bv and .sj cases are categorically different and worth flagging separately. Both are Norwegian-administered ccTLDs (Bouvet Island, Svalbard and Jan Mayen) that have never been opened to third-party public registration — Norway's NORID policy is to hold them closed in deference to the local administrative reality. The 191 and 162 hostnames our crawler ever observed under them are residual technical entries; the present-day zero-active state is the steady state, not a collapse.
What's at Stake
- The web you can read is half the size of the web that was registered. Citation rot, link rot, and reference rot are not failures of memory — they are downstream consequences of the underlying registration churn. The 1.65 billion dead hostnames in our dataset are the supply side of every "404 Not Found" anyone has ever seen.
- The new-gTLD program shipped a renewal cliff at scale. Three out of every four hostnames ever observed in the post-2012 generic cohort no longer resolve. Whether ICANN's 2026 second round repeats the pattern is a policy choice; the 2012 outcome is now measurable.
- Free registration produces near-total extinction once the commercial backstop collapses. Freenom's 28.3 million dead hostnames against 304K survivors is a clean natural experiment. The 98.94% extinction ratio is unusually clean precisely because the commercial driver — Freenom's revenue model — disappeared in a single 12-month window after Meta's lawsuit and settlement.
- Restrictive registration is the dead-ratio control variable.
.jp,.it,.de,.nl,.fr,.es,.pl,.au,.caall sit below 50% dead. They share verification requirements, structural barriers to bulk speculative registration, and active abuse-response programs. Permissive ccTLDs (.cc,.us,.in,.mx) sit above 50%. Where the registry policy is the dependent variable, the dead ratio is the independent variable. .com's 808 million dead hostnames are infrastructure, not failure. Most of them died because their underlying purpose ended — the campaign concluded, the customer churned, the SaaS tenant was provisioned and then de-provisioned. The .com graveyard is the ground truth of how the modern web's hostname allocation actually works: hostnames are issued ephemerally, consumed for a finite use, and abandoned.- Disappearance is uneven by TLD, by category, and by registry policy. A research method that treats "the web" as a single homogeneous corpus loses every signal that this analysis surfaces. Per-TLD decay rates are stable across crawl windows, predictive of registry quality, and useful as a normalization factor when comparing absolute counts across TLDs.
What Would Help
- Researchers measuring link rot or citation rot: report per-TLD decay rates, not corpus-wide rates. A 53% global dead ratio aggregates across
.jp(25%) and.bond(98%). Reporting one number obscures every interesting signal. The per-TLD decay rates in this post are stable enough to use as published baselines until our next snapshot. - ICANN: publish dead-ratio statistics as part of the new-gTLD program review. The 2012 round was justified largely on the registration-count metric; the 2026 second round is being designed under the same metric. A registration count without a paired dead-ratio is not a meaningful indicator of program success. The data is publicly available — Verisign reports active counts, registries report total registrations, and the dead-ratio falls out of the difference.
- Registry operators: charge enough to make speculative bulk registration uneconomic. The dead-ratio data is unambiguous: registries that charge fees in the €4–€10 wholesale range and verify identity sit below 40% dead at scale; registries that charge nothing or run $1 promos sit above 80% dead. The pricing decision has a measurable downstream consequence on namespace durability.
- Security teams: use the dead-ratio as a TLD risk signal, not an absolute ranking. A new gTLD with an 85% dead ratio is producing 5–7× more dropped hostnames per registration than a controlled ccTLD. That ratio correlates with expired-domain-takeover surface area, post-takedown reuse risk, and indicator-of-compromise volatility. Pairing the dead-ratio with abuse-incidence data produces a TLD-level risk score that is more diagnostic than abuse rates alone.
- The Internet Archive and citation-preservation efforts: prioritize archival of high-dead-ratio TLDs. A
.comlink from 2018 is twice as likely to resolve in 2026 as a.topor.shoplink from 2018, and 40 times more likely than a.tklink. Crawl prioritization that weights by underlying TLD survival would materially improve archival yield against bandwidth budget. Our /dataset page exposes the master corpus for exactly this kind of triage planning.
This analysis was produced from the DomainsProject master corpus (3,121,769,039 unique hostnames, all-time master union) and the 17 April 2026 active crawl (1,470,645,938 unique hostnames). Aggregations were computed with two independent GNU awk passes over the global flat files. The full active dataset is available at /dataset; per-TLD dashboards at /stats/ reflect the historical master snapshot from 2026-03-18 and will be refreshed against the 17 April 2026 crawl on the next dashboard regeneration. Snapshot dates referenced in this post: master corpus consolidated 30 April 2026; active crawl 17 April 2026.